How to Calculate Correlation Coefficients in R (5 Examples) | cor Function
This tutorial illustrates how to calculate correlations using the cor function in the R programming language.
The tutorial will consist of five examples for the application of the cor function. To be more specific, the content is structured as follows:
It’s time to dive into the examples!
Example Data
The data below is used as basement for this R programming tutorial.
First, we have to set a random seed for reproducibility:
set.seed(35843367) # Set random seed
Then, we can create a first variable as shown below:
x <- rnorm(100)                             # Create x variable
head(x)                                     # Print head of x variable
# [1]  0.5613421  0.3596981 -0.6503523  0.4343684  0.6023800  0.0320683
The previously shown output of the RStudio console shows that our example data is a randomly distributed numerical vector called x.
Next, we have to create a second variable:
y <- rnorm(100) + x                         # Create y variable
head(y)                                     # Print head of y variable
# [1]  0.5934054  2.0107541 -1.4445170 -1.2551753  1.5718713 -1.1317284
The previous output shows the first values of our second numerical variable.
Let’s use these data to calculate some correlations!
Example 1: Using cor() Function to Calculate Pearson Correlation
In this example, I’ll illustrate how to apply the cor function to compute the Pearson correlation coefficient.
Have a look at the following R code and its output:
cor(x, y)                                   # Pearson correlation
# [1] 0.63733
As you can see, the Pearson correlation coefficient of our two example variables is 0.63733.
Example 2: Using cor() Function to Calculate Kendall Correlation
We can also use the cor function to calculate other types of correlation coefficients. This example explains how to compute a Kendall Correlation:
cor(x, y, method = "kendall")               # Kendall correlation
# [1] 0.4719192
As shown in the previous R code, we had to set the method argument to be equal to “kendall”.
Example 3: Using cor() Function to Calculate Spearman Correlation
Similar to Example 2, we can use the method argument of the cor function to return the Spearman correlation coefficient for our two variables:
cor(x, y, method = "spearman")              # Spearman correlation
# [1] 0.6522172
Example 4: Calculate Correlation of Data with NA Values
In this example, I’ll explain how to calculate a correlation when the given data contains missing values (i.e. NA).
First, we have to modify our example data:
x_NA <- x                                   # Create variable with missing values
x_NA[c(1, 3, 5)] <- NA
head(x_NA)
# [1]        NA 0.3596981        NA 0.4343684        NA 0.0320683
As you can see in the RStudio console, we have inserted some NA values in our x variable.
If we now use the new x variable with NA values to calculate a correlation, NA is returned as result:
cor(x_NA, y)                                # Try to calculate correlation
# [1] NA
If we want to remove those NA observations from our data to calculate a valid correlation coefficient, we have to set the use argument to be equal to “complete.obs”:
cor(x_NA, y, use = "complete.obs")          # Remove NA from calculation
# [1] 0.6317544
Example 5: Calculate Correlation Matrix for Entire Data Frame
In Example 5, I’ll demonstrate how to create a correlation matrix for an entire data frame.
For this, we first have to create an exemplifying data set:
data <- data.frame(x, y, z = rnorm(100))    # Create example data frame
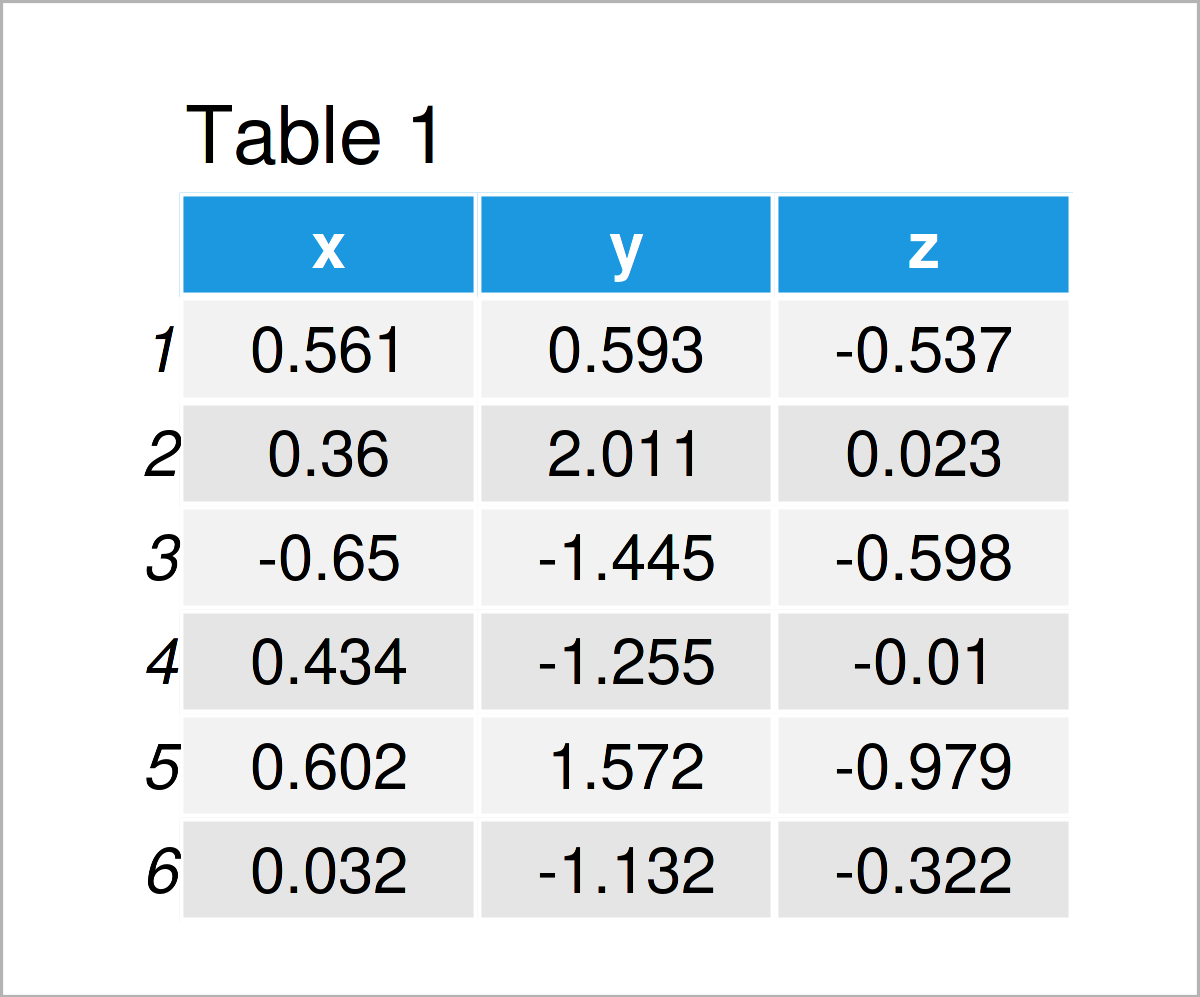
head(data)                                  # Print head of example data frame

Table 1 illustrates the first lines of our example data.
Next, we can use the cor function to calculate a correlation matrix of these data:
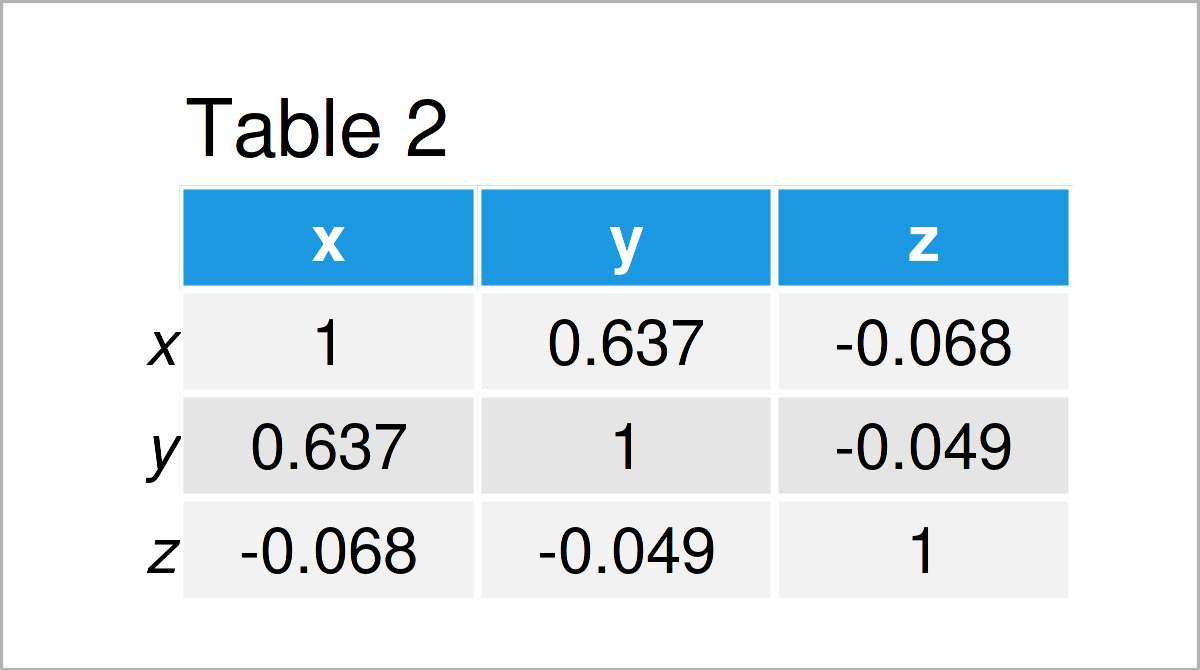
cor(data) # Create correlation matrix

In Table 2 it is shown that we have created a correlation matrix for our example data frame by using the previous syntax.
Video & Further Resources
In case you need more information on the topics of this tutorial, I recommend having a look at the following video on the Statistics Globe YouTube channel. In the video, I illustrate the examples of this article:
In addition, you might want to read the other tutorials on this website:
- Correlation Matrix in R
- Correlation of One Variable to All Others
- Calculate Correlation Matrix Only for Numeric Columns
- Remove Highly Correlated Variables from Data Frame
- Variance in R
- Standard Deviation in R
- Useful Commands in R
- R Programming Language
To summarize: You have learned in this article how to compute correlations using the cor function in the R programming language. If you have any additional comments or questions, let me know in the comments.
Statistics Globe Newsletter
R Tutorials
abs Function in R
all & any R Functions
Set Aspect Ratio of Plot
attach & detach R Functions
attr, attributes & structure in R
cbind R Command
Change ggplot2 Legend Title
Character to Numeric in R
Check if Object is Defined
col & row sums, means & medians
Complete Cases in R
Concatenate Vector of Strings
Convert Date to Weekday
cumsum R Function
Data Frame Column to Numeric
diff Command in R
difftime R Function
dim Function in R
dir R Function
Disable Scientific Notation
Draw Segments in R
droplevels R Example
Evaluate an Expression
Extract Characters from String
Factor to Numeric in R
Format Decimal Places
get, get0 & mget in R
is.na R Function
is.null Function in R
jitter R Function
Join Data with dplyr Package
length Function in R
lowess R Smoothing Function
max and min Functions in R
NA Omit in R
nchar R Function
ncol Function in R
nrow Function in R
outer Function in R
pairs & ggpairs Plot
parse, deparse & R expression
paste & paste0 Functions in R
pmax and pmin R Functions
polygon Plots in R
pretty R Function
R Find Missing Values
R Functions List (+ Examples)
R NA – Values
R Replace NA with 0
rbind & rbind.fill in R
Read Excel Files in R
readLines, n.readLines & readline
Remove Element from List
Remove Legend in ggplot2
Rename Column Name in R
Replace Last Comma of String
rev R Command
Round Numeric Data in R
Save & Load RData Workspace
scan R Function
setdiff R Function
setNames vs. setnames in R
sink Command in R
Sort, Order & Rank Data in R
sprintf Function in R
Square Root in R
str_c Function of stringr Package
str_sub Function of stringr Package
strptime & strftime Functions
substr & substring R Commands
sweep R Function
Transform Data Frames
union Function in R
unlist in R
weekdays, months, quarters & julian in R
with & within R Functions
Write Excel File in R


