The segments R Function | 3 Example Codes
Basic R Syntax:
segments(x0 = 1, y0 = 1, x1 = 2, y1 = 2)
The segments R function draws a line segment between two pairs of points. The basic syntax for segments in R is shown above.
In the following article, I’m going to show you three examples for the application of the segments command in the R programming language.
So if you want to know more about the segments function, keep reading…
Example 1: Basic Application of the segments R Function
The basic usage of the segments R function is quite straight forward. Let’s first create an empty plot, to which we can add a line segment:
plot(0, 0, col = "white", xlab = "", ylab = "") # Create empty example plot

Graphic 1: Empty Plot as Preparation for Segments R Example.
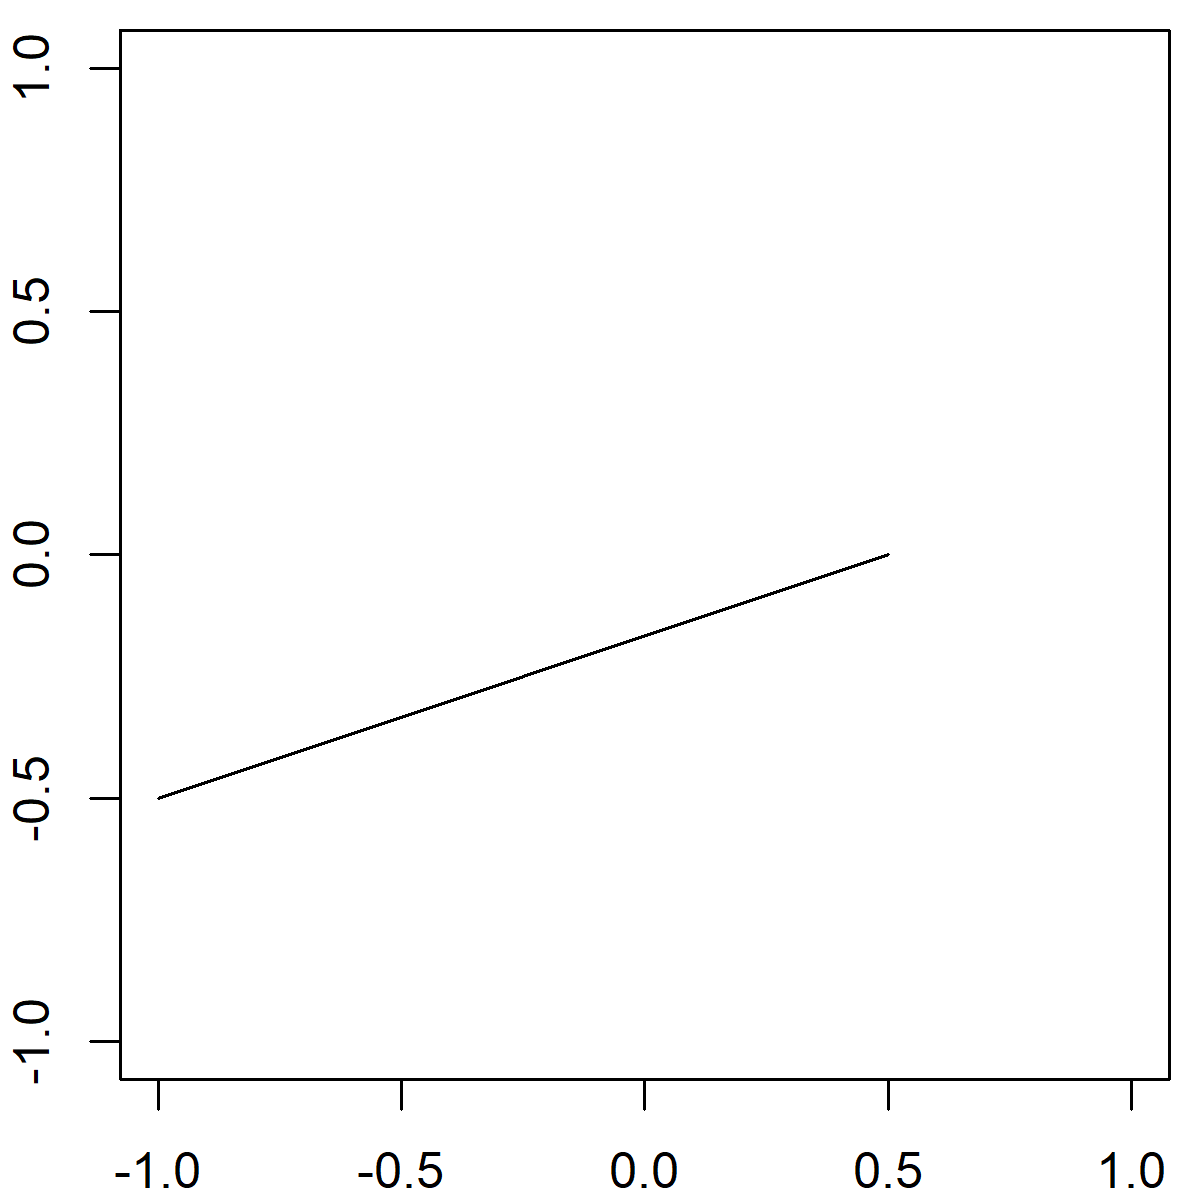
Now, let’s apply the segments R function in order to draw a line segment:
segments(x0 = - 1, y0 = - 0.5, x1 = 0.5, y1 = 0) # Draw one line

Graphic 2: Basic Application of segments() Function.
As you can see, we had to specify four different values within the segments function:
- x0 & y0: The x-y coordinates of the starting point from which to draw the line segment.
- x1 & y1: The x-y coordinates of the ending point to which to draw the line segment.
That’s it!
By the way, you may also have a look at the following YouTube video. In the video, I explain the R programming code of Example 1.
However, the segments R function is very flexible. In the next example I’m going to show you some ways to make the line segments of your graphic much prettier…
Example 2: How to Modify Color, Thickness & Line Type
In the following example, I’m going to show you how to modify color, thickness and line type of your line segments. First, we need to create an empty plot (as in Example 1):
plot(0, 0, col = "white", xlab = "", ylab = "") # Create empty example plot
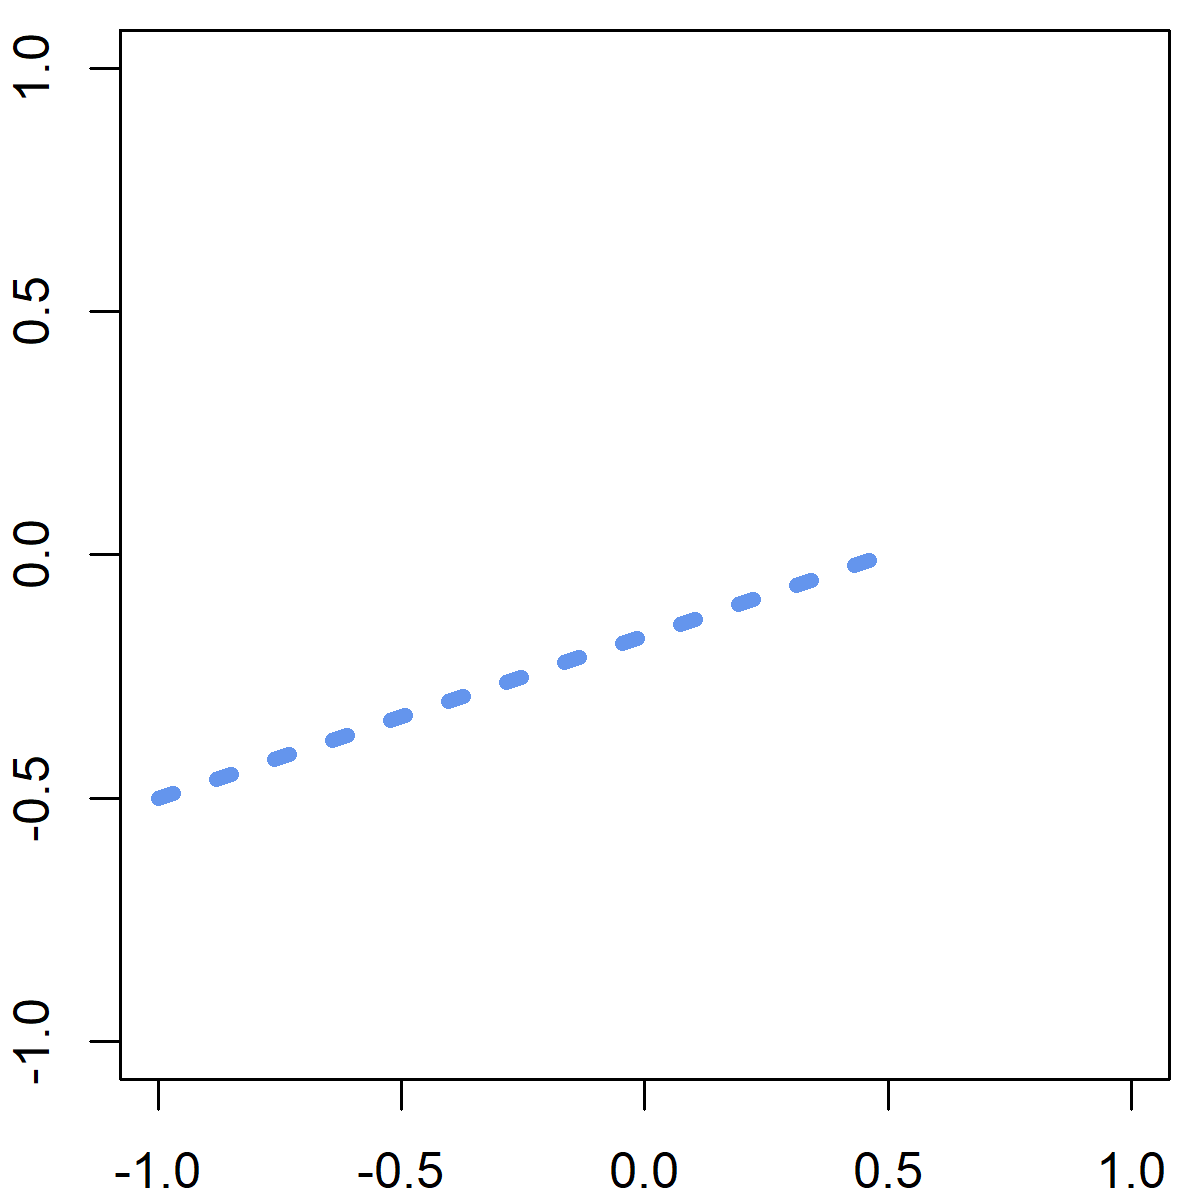
We then can apply the segments command as in Example 1, but with additional specifications:
segments(x0 = - 1, y0 = - 0.5, x1 = 0.5, y1 = 0,               # Draw one line as in Example 1
         col = "cornflowerblue",                               # Color of line
         lwd = 5,                                              # Thickness of line
         lty = "dotted")                                       # Line type

Graphic 3: Manual modifications of segments() Function: Color, Thickness & Line Type.
As you can see, I changed the color, the thickness, and the line type of our line segment. However, many other arguments for modifying line segments can be found in the par help documentation.
Example 3: Add Multiple Line Segments to R Plot
The segments R function can also be useful, when you need to draw multiple lines to your graph. Again, let’s start with an empty figure:
plot(0, 0, col = "white", xlab = "", ylab = "") # Create empty example plot
Now, let’s crate a data frame, in which we specify multiple starting and ending x-y coordinates:
mult_seg <- data.frame(x0 = c(0.7, 0.2, - 0.9, 0.5, - 0.2),    # Create data frame with line-values
                       y0 = c(0.5, 0.5, 0.6, - 0.3, 0.4),
                       x1 = c(0, 0.2, 0.4, - 0.3, - 0.6),
                       y1 = c(- 0.1, 0.3, - 0.6, - 0.8, 0.9))
As you can see, our data matrix consists of four columns:
- Column 1: x0 coordinates
- Column 2: y0 coordinates
- Column 3: x1 coordinates
- Column 4: y1 coordinates
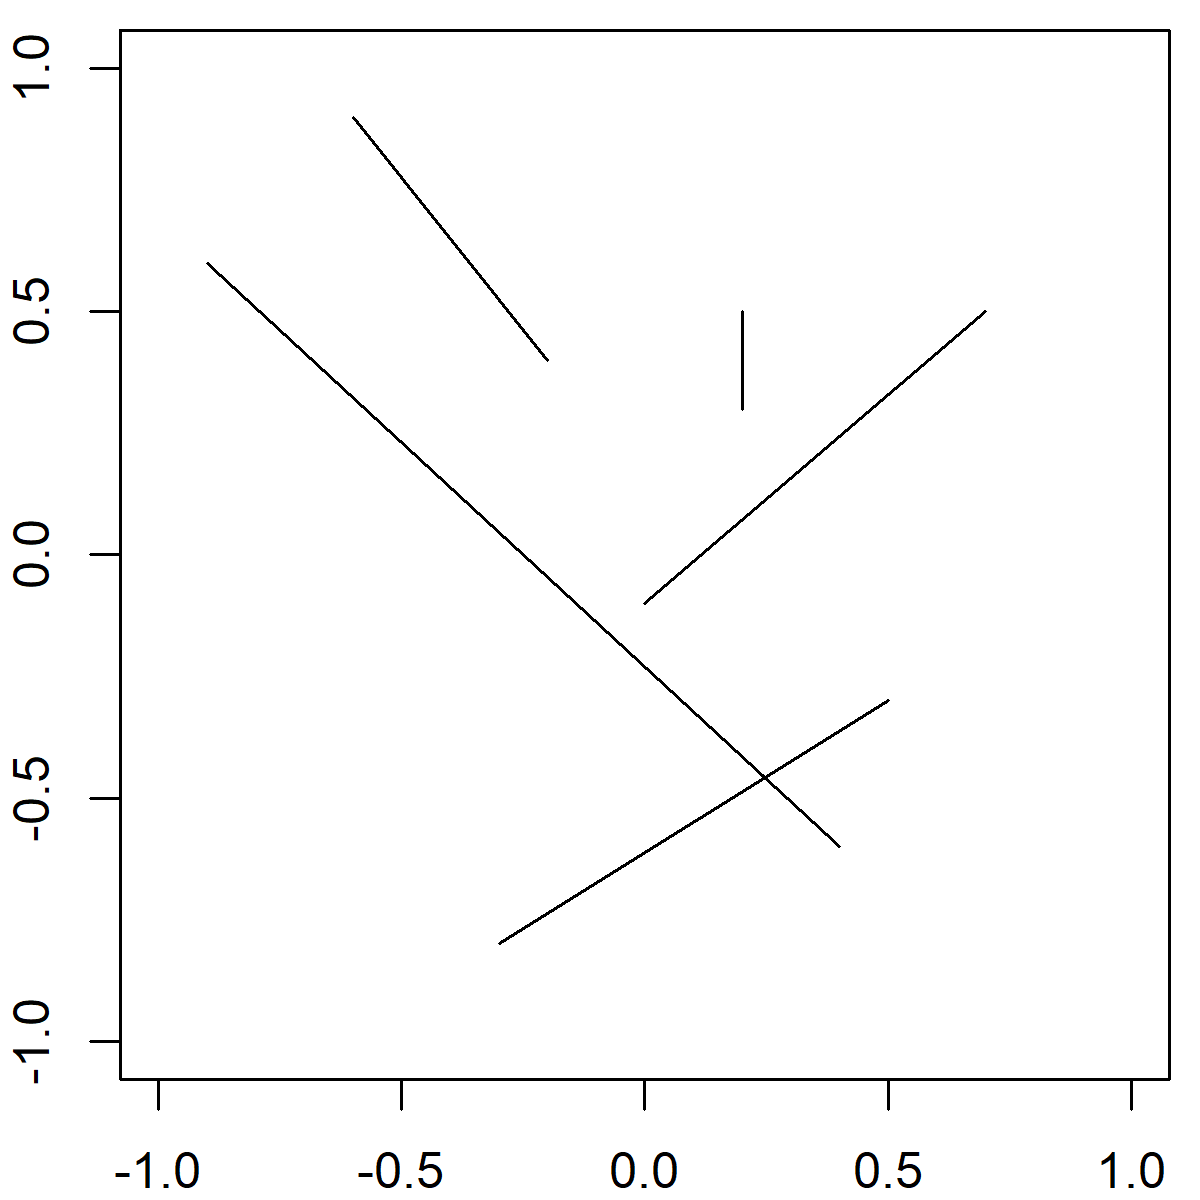
After creating this data frame, we can draw multiple line segments with the following R code:
segments(x0 = multiple_segments$x0,                            # Draw multiple lines
         y0 = multiple_segments$y0,
         x1 = multiple_segments$x1,
         y1 = multiple_segments$y1)

Graphic 4: How to Draw Multiple Line Segments.
With this procedure, you can draw as many line segments as you want with one simple application of the segments command.
But there is even more…
Video Tutorial: R Boxplot with Segments
So far, I have shown you how to draw a line segment to an empty plot. However, it gets even more interesting, when you use the segments function to visualize real statistical results. You can learn more about that in the following video of the YouTube channel DWR447. The video explains how to use the segments function in combination with boxplots.
Further Reading
- Draw Line with plot() Function
- Draw Multiple Graphs to One Plot
- Graphics in R
- The R Programming Language


