Standard Deviation in R (3 Examples) | Apply sd Function in R Studio
This tutorial explains how to compute the standard deviation in the R programming language.
The article is mainly based on the sd() R function. The basic R syntax and the definition of sd are show below:
Basic R Syntax of sd:
sd(x)
Definition of sd:
The sd R function computes the standard deviation of a numeric input vector.
In the following R tutorial, I’ll show in three examples how to use the sd function in R.
Let’s dive in!
Example 1: Compute Standard Deviation in R
Before we can start with the examples, we need to create some example data. Consider the following numeric vector in R:
x <- c(4, 5, 1, 8, 9, 4) # Create example vector in R
Now, we can apply the sd function to this vector in order to compute its standard deviation:
sd(x)                          # Apply sd function
# 2.926887
The standard deviation of our example vector is 2.926887!
As you can see, the calculation of a standard deviation in R is quite easy. However, with real data there might occur problems. One of these problems is missing data (i.e. NA values). How to handle such NA values within the sd R function is what I’m going to show you next…
Example 2: Handle NA Values with sd R Function
For the example, we first need to add an NA value to our example vector:
x_NA <- c(x, NA) # Create vector with NA
Now, let’s see what happens to our RStudio output, when we use the sd command as in Example 1:
sd(x_NA)                       # Apply sd to NA vector
# NA
As you can see, the RStudio console returns NA (Not Available)! This output is always returned when our input data contains NA values.
Fortunately, the R programming language provides an easy solution. We simply need to specify the option na.rm = TRUE within the sd function:
sd(x_NA, na.rm = TRUE)         # Use na.rm option
#2.926887
Same output as in Example 1 – Looks good!
In the next example, I’ll show you how to apply the sd function to a real data set:
Example 3: Apply sd to Real Data
For this example, I’ll use the iris flower data set. The iris data can be loaded to R (or RStudio) as follows:
data(iris) # Load iris data
The first six rows of the data frame look as follows:
head(iris) # First 6 rows of iris data
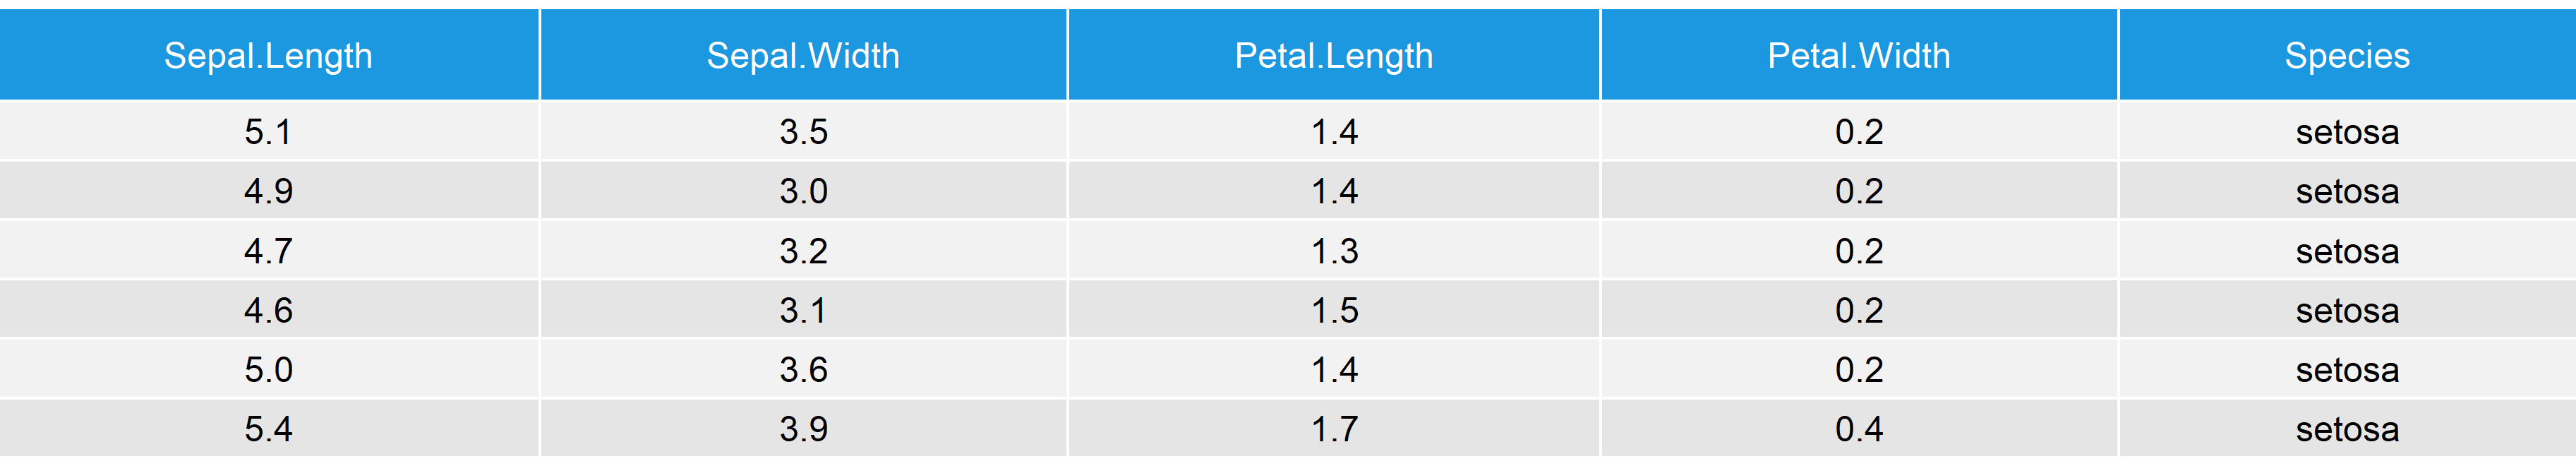
Table 1: First 6 Rows of Iris Flower Data Matrix.
We can now use the $-sign to compute the standard deviation for the columns of this data frame:
sd(iris$Sepal.Length)           # Apply sd to column of iris
# 0.8280661
For instance, the standard deviation of the column Sepal.Length is 0.8280661.
Tutorial Video & Further Resources
For more detailed information concerning the code of this article, please check out the below video on the Statistics Globe YouTube channel:
Do you want to learn more about the calculation of metrics such as standard deviation, variance, mean, frequencies etc. in R? Then I can recommend the following video of the MarinStatsLectures YouTube channel:
Furthermore, you might be interested in some of the other articles of my website:
In summary: this tutorial illustrated how to use the sd command in order to compute the standard deviation in R. However, if you have any further comments or questions, don’t hesitate to let me know in the comments below.

I’m Joachim Schork. On this website, I provide statistics tutorials as well as code in Python and R programming.
Statistics Globe Newsletter
Get regular updates on the latest tutorials, offers & news at Statistics Globe. I hate spam & you may opt out anytime: Privacy Policy.