Remove Highly Correlated Variables from Data Frame in R (Example)
In this R tutorial you’ll learn how to delete columns with a very high correlation.
The article will contain one example for the removal of columns with a high correlation. To be more specific, the post is structured as follows:
Please note: This tutorial does not discuss whether you SHOULD exclude highly correlated variables from your data. Please ensure that it is theoretically justified to remove these variables before continuing the removal in practice.
However, here’s the step-by-step process!
Construction of Exemplifying Data
The first step is to define some data that we can use in the examples later on:
set.seed(356947)                             # Create example data
x1 <- rnorm(100)
x2 <- x1 + rnorm(100, 0, 0.01)
x3 <- x1 + x2 + rnorm(100)
data <- data.frame(x1, x2, x3)
head(data)                                   # Head of example data
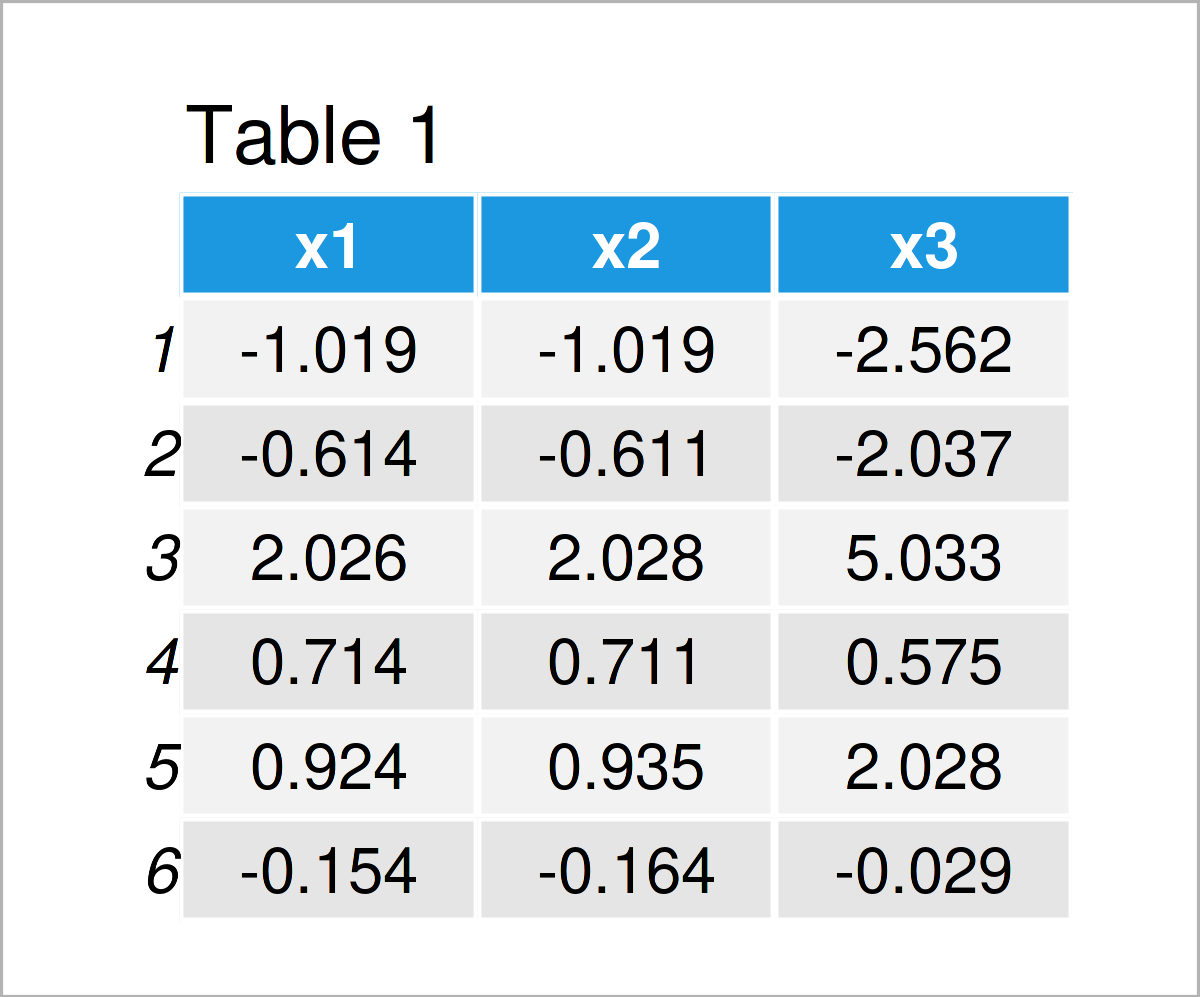
Table 1 shows that our example data consists of three numerical columns called “x1”, “x2”, and “x3”.
Example: Delete Highly Correlated Variables Using cor(), upper.tri(), apply() & any() Functions
In this section, I’ll illustrate how to remove all highly correlated columns from a data frame.
For this, we first have to calculate a correlation matrix of our data:
cor_matrix <- cor(data)                      # Correlation matrix
cor_matrix
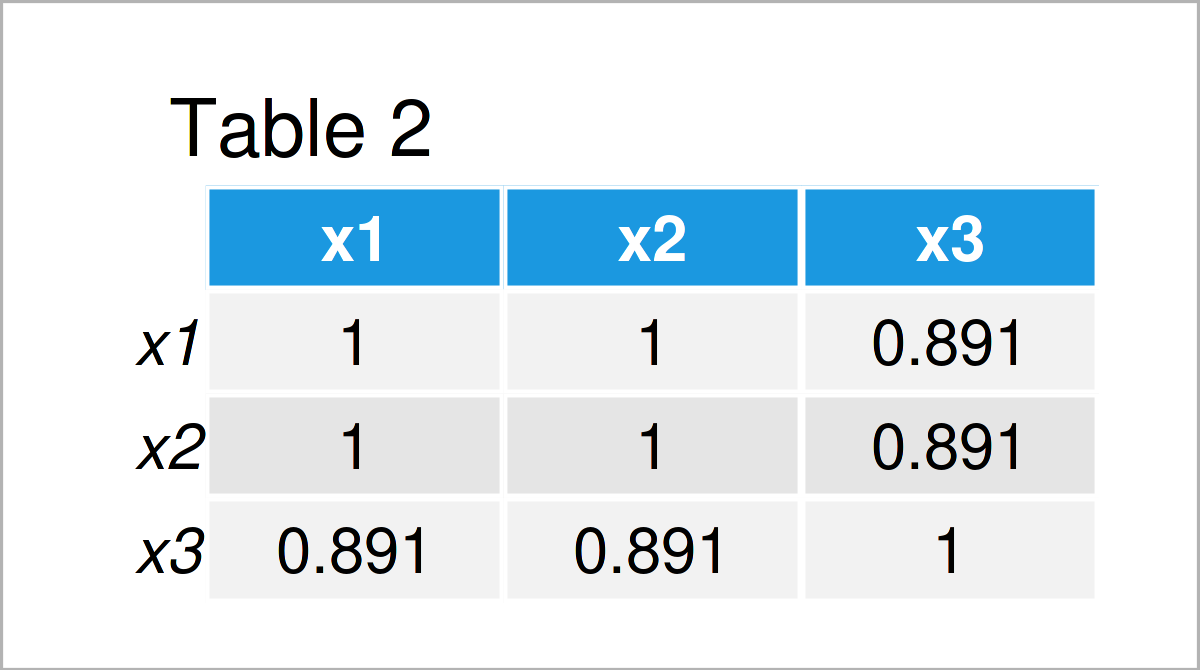
As shown in Table 2, we have created a correlation matrix of our example data frame by running the previous R code. Note that the correlations are rounded, i.e. the correlation of x1 and x2 is shown as 1 even though it is slightly below 1 in reality.
In the next step, we have to modify our correlation matrix as shown below:
cor_matrix_rm <- cor_matrix                  # Modify correlation matrix
cor_matrix_rm[upper.tri(cor_matrix_rm)] <- 0
diag(cor_matrix_rm) <- 0
cor_matrix_rm
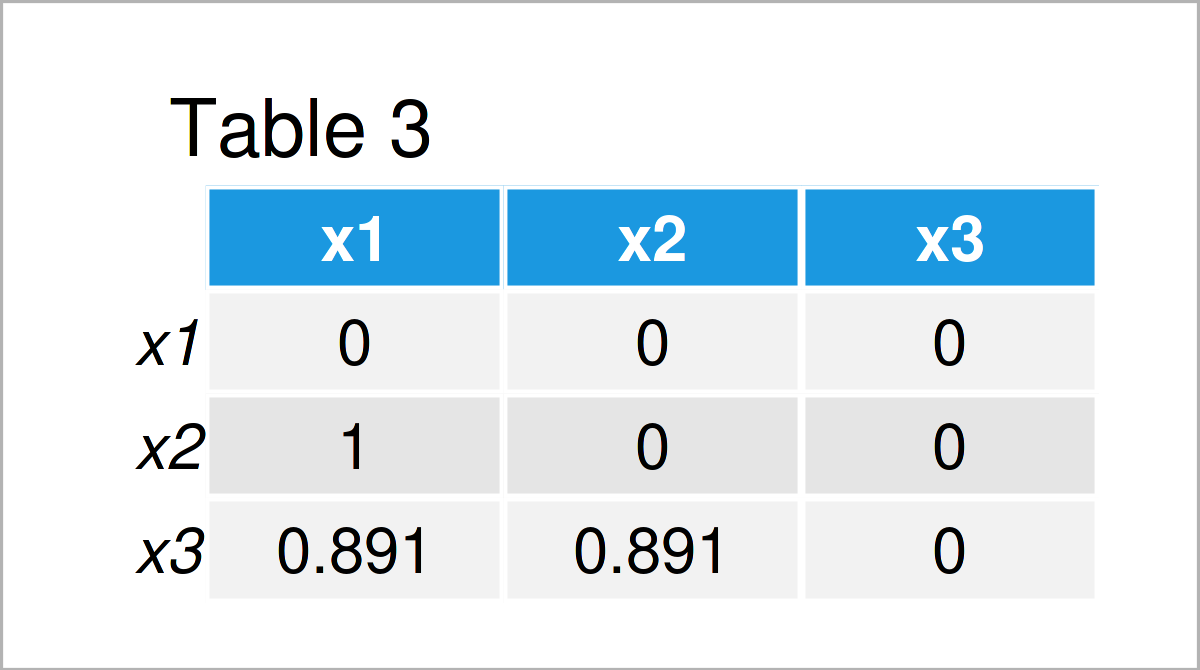
In Table 3 it is shown that we have created an updated version of our correlation matrix where the diagonal and the upper triangle have been set to zero.
Now, we can use this updated correlation matrix to remove all variables with a correlation above a certain threshold (i.e. > 0.99):
data_new <- data[ , !apply(cor_matrix_rm,    # Remove highly correlated variables
                           2,
                           function(x) any(x > 0.99))]
head(data_new)                               # Print updated data frame
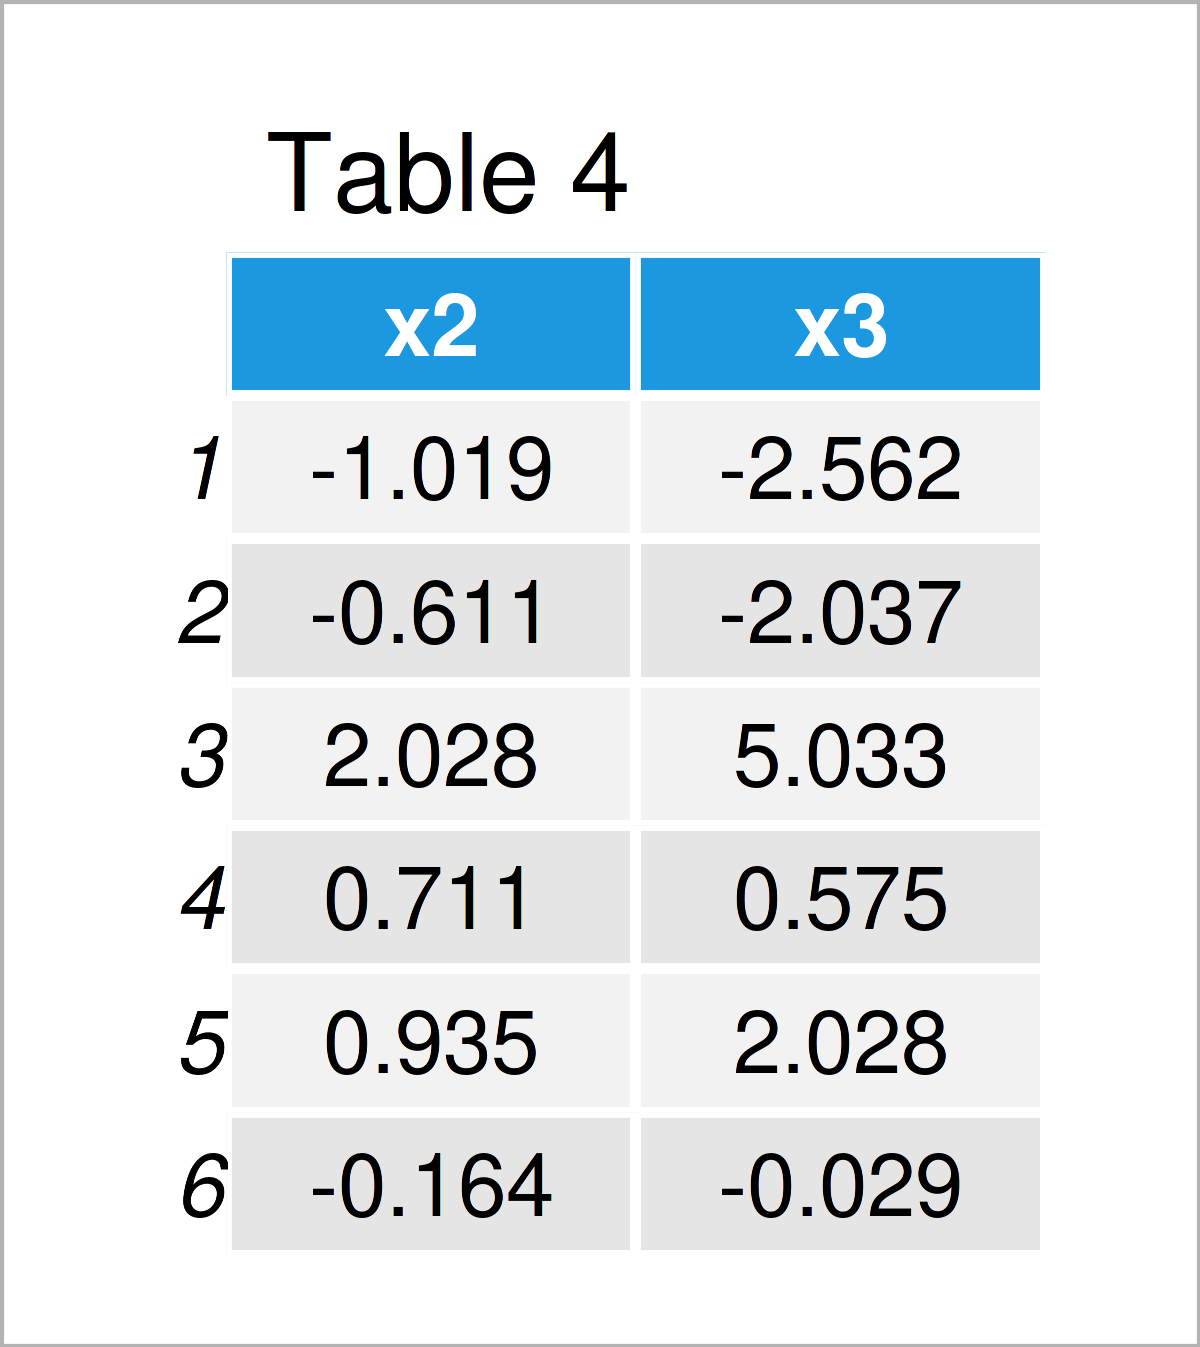
As shown in Table 4, we have created a subset of our original data frame where highly correlated variables have been excluded.
In the present example, the variable x1 was removed because it has a correlation larger than 0.99 with the variable x2.
Video & Further Resources
If you need more explanations on the R codes of this article, you might want to have a look at the following video on my YouTube channel. I’m explaining the content of this tutorial in the video:
Besides that, you may read the related articles on my website:
- Remove Duplicated Rows from Data Frame in R
- Sort Variables of Data Frame by Column Names
- R Programming Tutorials
In summary: You have learned on this page how to remove columns with a very high correlation in the R programming language. Don’t hesitate to let me know in the comments, if you have additional comments or questions. Furthermore, don’t forget to subscribe to my email newsletter to receive updates on new articles.




4 Comments. Leave new
Nice and simple approach 🙂
you may consider any(abs(x) > 0.99)
Thanks
Hey Hadi,
Thank you for the kind comment, and the additional code! 🙂
Regards,
Joachim
Sorry, if it’s a stupid question, but how do you know which of the variables are removed? If x1 and x2 are correlated with each other, why is only x1 removed? 😀
Hello Herluf,
Thank you for your question. No, I wouldn’t call it stupid 🙂
In our specific case, always the leftmost column in the data set is removed (i.e. x1).
To give a more general response: How to select a proper variable depends on your preference of which variable to include in your model, in other words, which variable is more important for your research question. But there are also more technical ways to decide on which variable to include, in case you are a bit clueless. In the context of linear regression, checking this link might be helpful to understand the concept and different applications for the variable selection.
Regards,
Cansu