
Online Courses at Statistics Globe
At Statistics Globe, we are excited to offer a selection of premium online courses designed to enrich your learning experience.
These courses specialize in the R and Python programming languages, equipping you with a profound understanding of these tools.
Our curriculum also encompasses the fields of data science and statistical methodologies, delivering a blend of practical applications and theoretical insights.
Comprehensive Online Courses
Our online courses are structured to fit various learning styles and skill levels, ensuring that whether you’re a beginner or a seasoned professional, you’ll find content that resonates with your educational needs.
By engaging with our courses, you will gain hands-on experience and comprehensive knowledge, essential for navigating the complexities of today’s data-driven landscape. Join us on a journey of learning and professional growth in the ever-evolving world of programming and data analysis.


Free Tutorials at Statistics Globe
We believe that education should be affordable and accessible to everyone. That’s why, in addition to our paid and more extensive online courses, we also offer a wide range of free tutorials.
We provide written tutorials on our website as well as video tutorials on our YouTube channel. You may click on the images below to visit the corresponding sections.

Consulting Services
Are you looking for help with your data science project that is completely customized to your individual needs? At Statistics Globe, we also offer statistical consulting and data science services for a variety of clients, including businesses, public institutes, and researchers.
Our experienced team is skilled in statistical software such as R and Python, and we provide complete support for every stage of your project.
We help you from the start with study design and data handling, all the way to advanced statistical analysis and creating dynamic visualizations.
We also focus on clearly presenting and sharing your project’s results to make sure they have a strong impact.
Find out more about our consulting services here.

22 Comments. Leave new
Hi,
I have purchased the “Data Manipulation Course”. I have previously followed the link at the confirmation mail I have received after the purchase and it was working and I hade access to the course. But now, I don’t have the access anymore. Can you help me out with this issue?
Best regards,
Karun Korkmaz, MD
Hello Karun Korkmaz,
Apologies for the late reply. Is the problem still existent? The link in the email you received should actually work permanently. If not, I saw you are also in the course’s LinkedIn group, and the first post (pinned at the top) gives you access to the course page as well. Hope this helps you.
Please let us know if it doesn’t work. The best way to inform us is over the LinkedIn group.
Best regards,
Matthias
Hi Matthias,
I am also experiencing the access issue. Unfortunately, I don’t have the access to LinkedIn group. When I joined, I thought to access the course later as I was traveling, but now I don’t seem to find the location where I can get all the course content. Some of the emails are in spam. Can you provide me the link to all the course content at vshfrm@gmail.com please.
Hey Vishal,
Thank you for your message. I have just sent all the information about the course to your email once again. Please let me know in case you need further help.
Best regards,
Joachim
Thank you for this helpful website.
I am a statistics lecturer. Your work on R, Python, and applied statistics supports my research goals.
I follow Statistics Globe often and learn a lot from it.
Thank you for sharing such clear and useful resources.
Hi Wubie,
Thank you very much for the kind message and for following Statistics Globe.
I am glad to hear that the content on R, Python, and applied statistics is useful for your teaching and research. It is always motivating to get feedback from fellow statistics lecturers.
Thanks again for your support, and all the best with your work.
Best regards,
Joachim
I am glad to join you and I shall work hard to attain my goals.I hold BEd Maths, MSc Statistics and currently a PhD Mathematics candidate of the University of Mines and Technology Tarkwa -sGhana
Hey George,
Thank you for your kind message and interest in the course, I hope you’ll enjoy it!
Regards,
Joachim
Hi I would like Learn r for Clinica domain
Hi Venkatesh,
Thank you for your interest. While I do not offer a course specifically focused on the clinical domain, the courses provide general knowledge about R, which is also valuable for this area.
Regards,
Joachim
Good morning, to follow a logical course usage guide, what would be the order from the most basic to the most complex? Best regards, Kurt Wiederhold
Hi Kurt,
Thank you for your interest in our courses. I recommend the following order. However, once you have a solid understanding of the basics from the introduction course, you should be able to follow all the other courses as well.
1) Introduction to R Programming for Absolute Beginners
2) Data Manipulation in R Using dplyr & the tidyverse
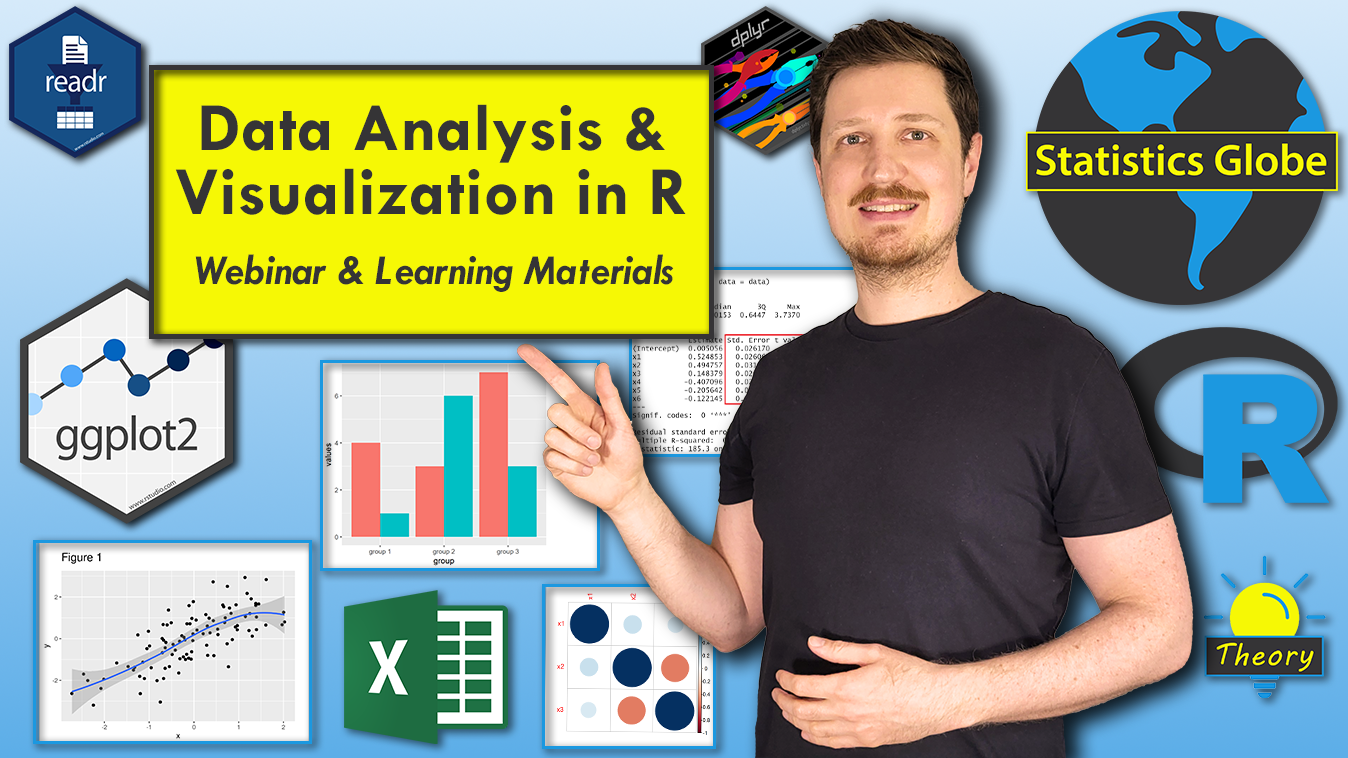
3) Data Visualization in R Using ggplot2 & Friends
4) Statistical Methods in R
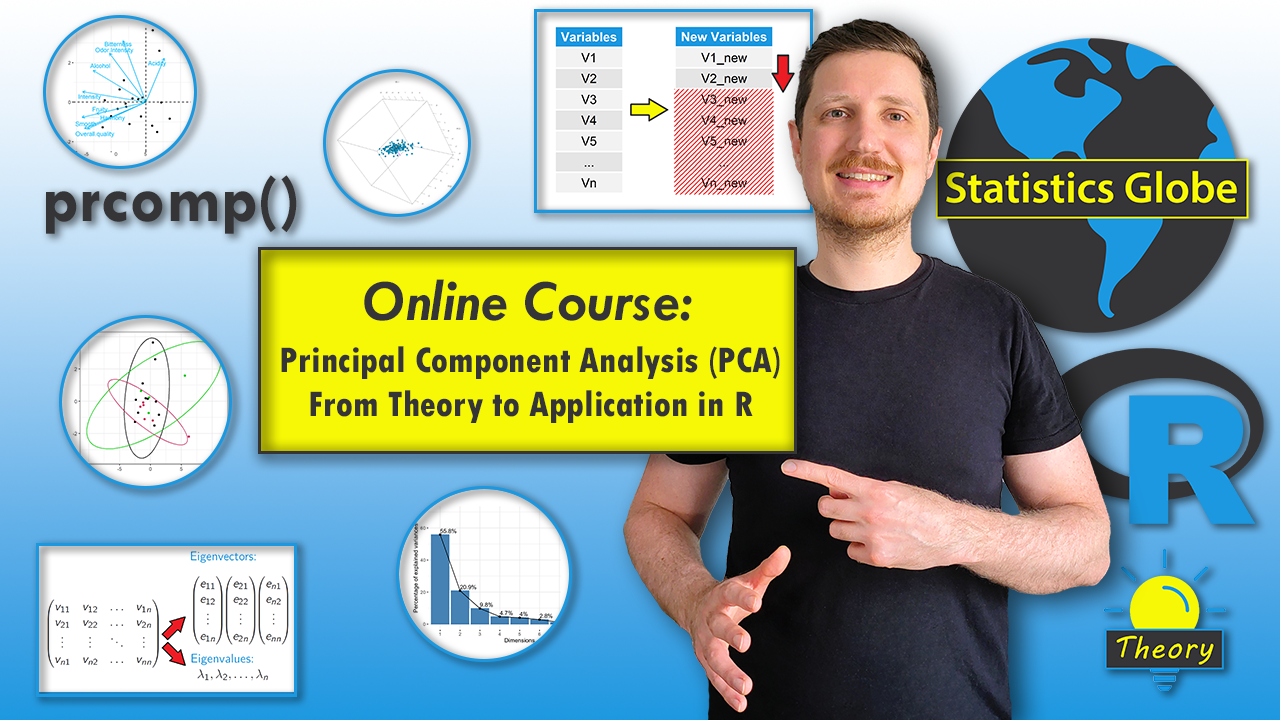
5) Principal Component Analysis (PCA) – From Theory to Application in R
Let me know if you have any further questions.
Regards,
Joachim
Hiii Joachim,
I am very interested to hand on data analysis using R and hence, i need to know how is delivered, and fee for whole course. And hence, i need i formation as i am MSc student
Hi Mulalem,
Thank you for your interest in our courses. You can find all details about how each course is delivered and the full fees directly on the corresponding course pages. If you have any further questions, feel free to reach out.
Regards,
Joachim
I was wondering when the wait list opens
Hi John,
Thank you for your interest in my courses. Registration will open in mid to late July.
Regards,
Joachim
Hello,
I’ve completed the course ‘Statistical Methods in R’.
How do I receive the certificate?
Thanks for some info.
Hi,
Thanks for your comment, and congratulations on completing the Statistical Methods in R course.
To receive your certificate, please send a short email with your full name to info@statisticsglobe.com
Regards,
Joachim
This week I completed the online course ‘Statistical Methods in R’ on Statistics Globe.
The course covers the essential content of statistical data analysis while remaining focused and concise throughout.
It served for me as a valuable refresher of the relevant statistical learning in my university time and also demonstrated very effectively how the individual statistical techniques can be implemented in practice using the R programming language.
I consider Statistics Globe as a highly recommended learning platform.
If I could make a wish, it would be for a course on econometrics and time series analysis / forecasting using R, presented in the same style and at the same level.
Thank you for providing the course.
Hey,
Thank you so much for the very kind feedback, glad you enjoyed the course! Also, thanks for the topic suggestion, I’ll keep it in mind for the future course planning.
All the best,
Joachim
Why there are so many square roots used in Statistical estimates ?
Thanks.
Hi Madan,
It is difficult to answer your question without more context, but I will try to give a general explanation.
Square roots appear frequently in statistics because many estimates are based on variance, which uses squared deviations for mathematical reasons. Since variance is expressed in squared units, the square root is taken to return the result to the original scale of the data. This is the case, for example, for the standard deviation and the standard error, which are easier to interpret than the variance.
The exact reason depends on the specific estimate you have in mind, so it would help if you could share a concrete example.
I hope this helps.
Joachim