cumsum R Function Explained (Example for Vector, Data Frame, by Group & Graph)
In many data analyses, it is quite common to calculate the cumulative sum of your variables of interest (i.e. the sum of all values up to a certain position of a vector).
In the R programming language, the cumulative sum can easily be calculated with the cumsum function.
In the following article, I’m going to show you how to apply the cumsum R function – starting with a simplified example, followed by some more advanced applications.
cumsum Explained – Example of the R Function
Consider the following example vector in R (i.e. R Studio):
set.seed(456654)                # Set seed for reproducibility
x <- round(runif(10, 1, 9))     # Create example vector
x                               # Print example vector
# 6 4 7 8 4 6 3 5 4 7
Our example vector consists of 10 numbers ranging from 3 to 8.
We can calculate the cumulative sum of this vector as follows:
cumsum(x) # Apply cumsum R function
That’s basically it. Just insert your vector into the brackets of the cumsum R function and run the code.
Easy, right? However, you can get much more out of the cumsum function. Check out the following applications…
Advanced Application of the cumsum Function in R
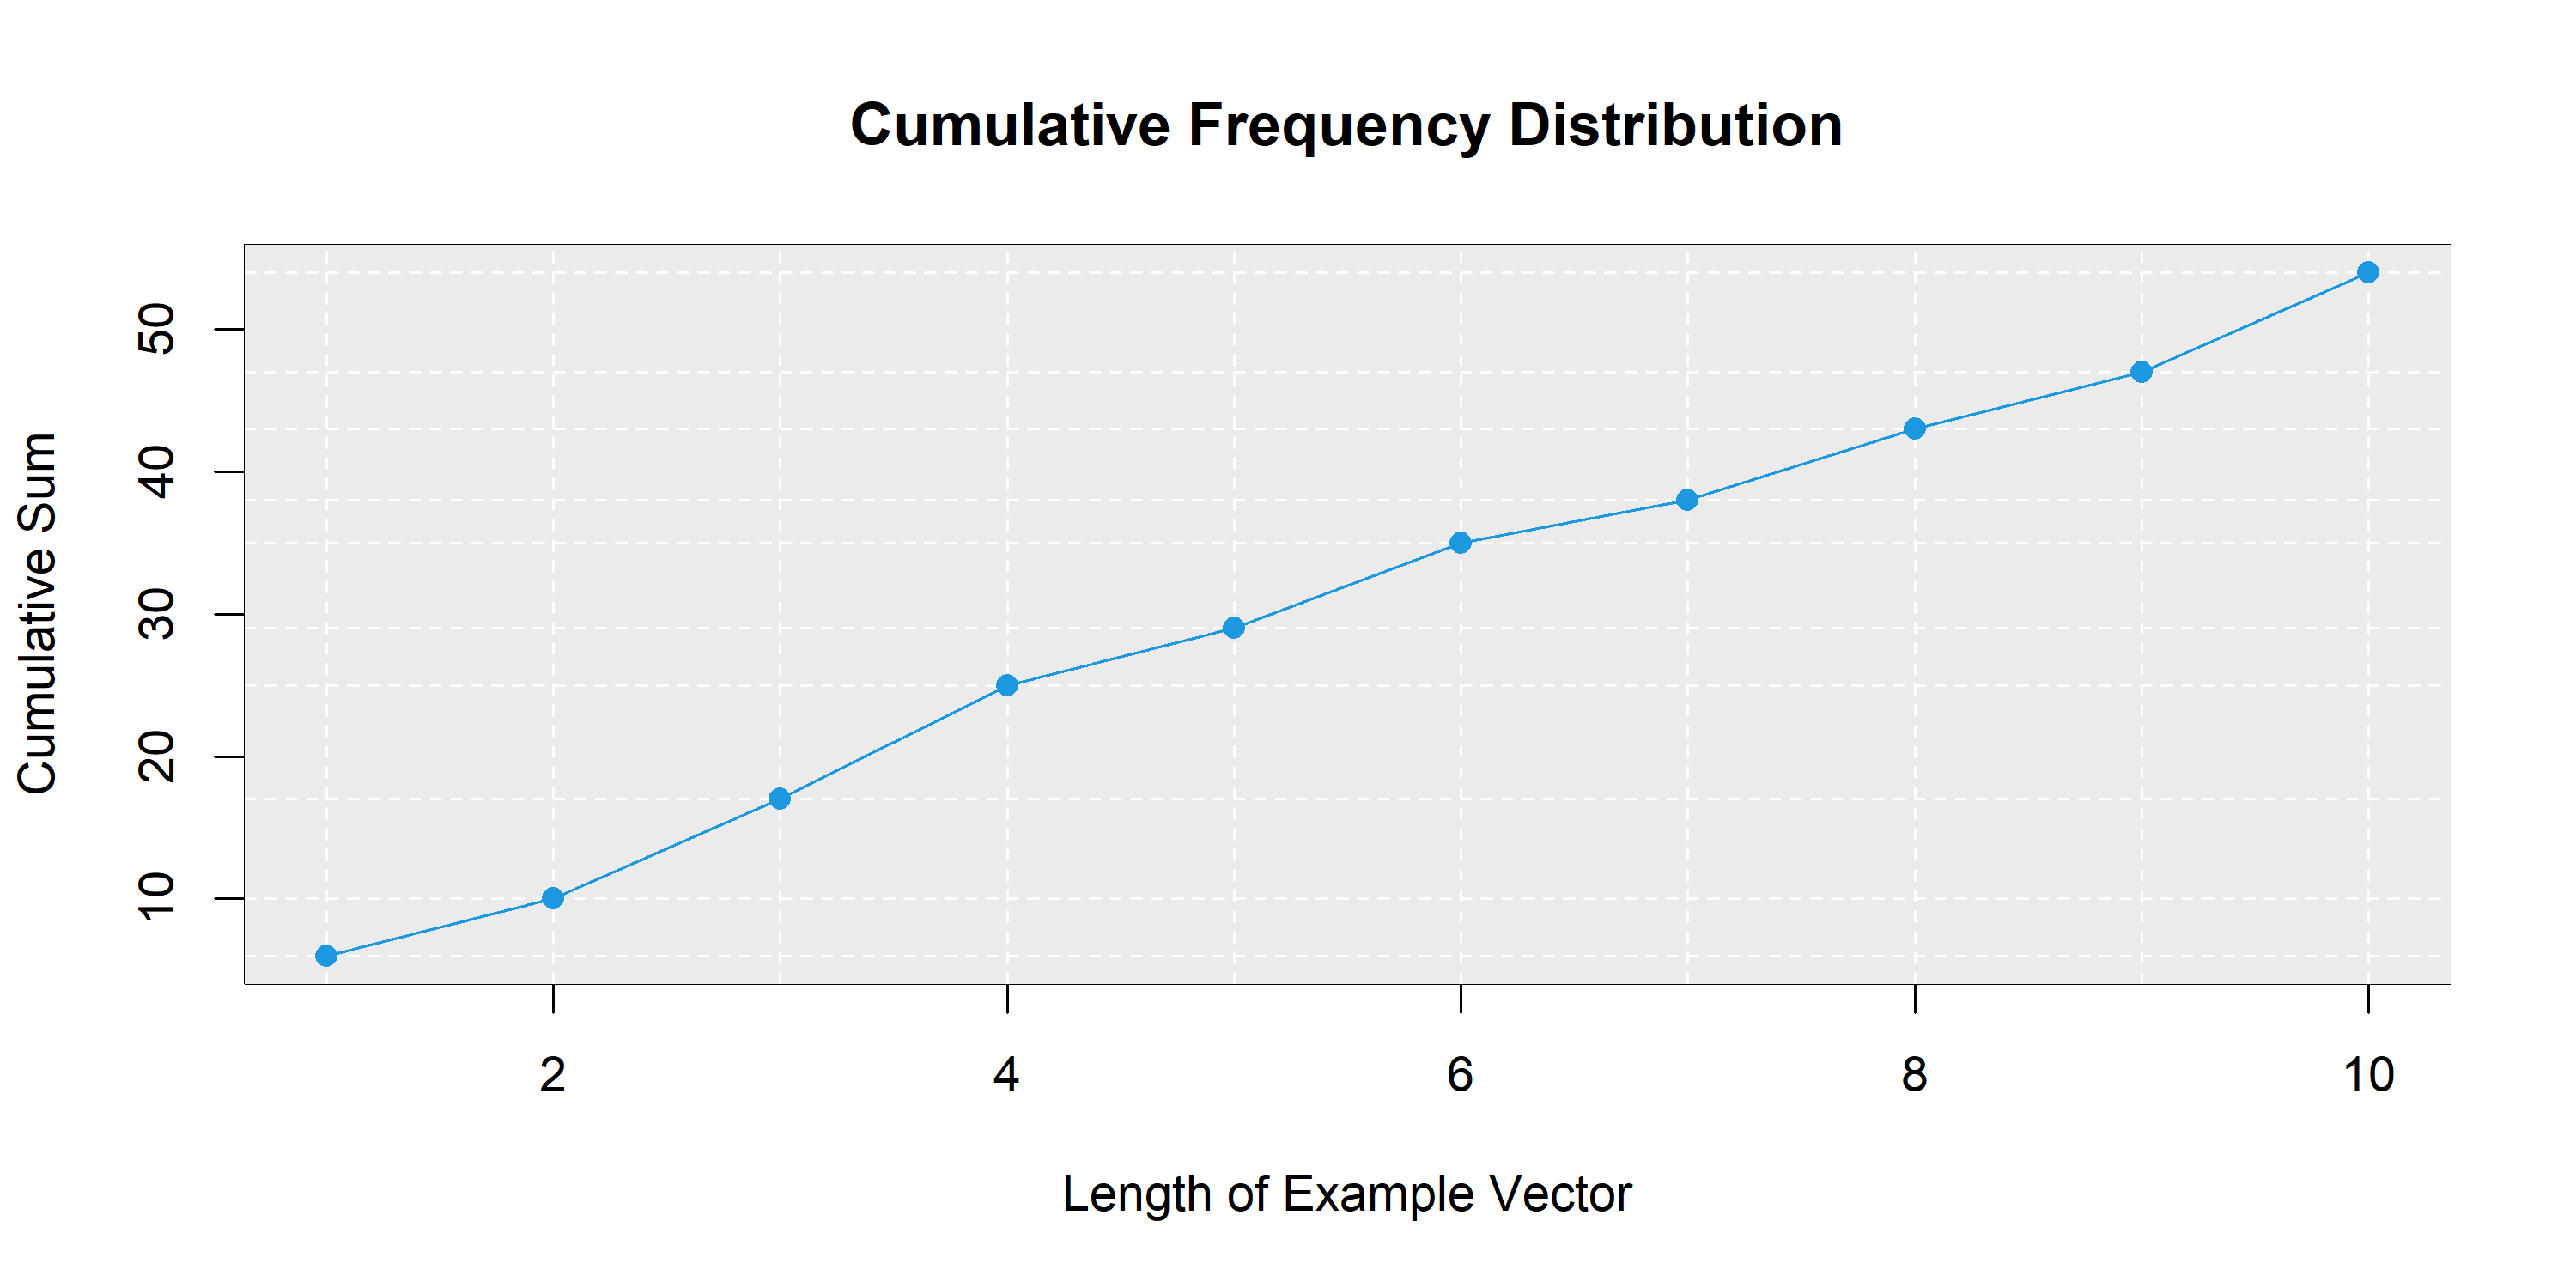
How to Create a cumsum Graph
A nice way to visualize the cumulative sum is a cumsum graph (e.g. time series data is often visualized with such a cumsum chart).
I’m using the example vector we already used above:
csx <- cumsum(x)                # Store cumsum of our example vector

plot(x = 1:length(csx),         # Plot of cumsum vector
     y = csx,
     main = "Cumulative Frequency Distribution",
     xlab = "Length of Example Vector",
     ylab = "Cumulative Sum")

rect(0, 60, 11, 0,              # Modify background color
     border = "black",
     col = "grey92")

abline(v = 1:length(csx),       # Add vertical lines to plot
       col = "white",
       lty = "dashed")

abline(h = csx,                 # Add horizontal lines to plot
       col = "white",
       lty = "dashed")

points(x = 1:length(csx),       # Add line to plot
       y = csx,
       col = "#1b98e0",
       type = "l")

points(x = 1:length(csx),       # Add points to plot
       y = csx,
       col = "#1b98e0",
       pch = 16)

Graphic 1: Cumulative Sum of Our Example Vector – Visualized in R
Apply cumsum to a Real Data Frame
So far, we have applied the cumsum R function only to a very simple example vector. Let’s apply the function to a more realistic data table…
For the realistic example, I’m using the AirPassengers data set:
data(AirPassengers)                  # Load AirPassengers data.frame

data <- data.frame(                  # Some data cleaning
  pass = as.vector(AirPassengers),
  year = sort(rep(1949:1960, 12)),
  month = rep(c("Jan", "Feb", "Mar", "Apr",
                "May", "Jun", "Jul", "Aug",
                "Sep", "Oct", "Nov", "Dec"), 12))
Now let’s apply the cumsum function to this data matrix:
cumsum(data$pass)                    # Apply cumsum function to first column
# ... 37966 38572 39080 39541 39931 40363
It might be useful to add a new column consisting of the cumulative sum to your data. That task could be done as follows:
data$pass_sum <- cumsum(data$pass)   # Add cumsum of passengers to data.frame
head(data)

Table 1: AirPassengers Data Frame with Cumulative Sum
cumsum by Group in R
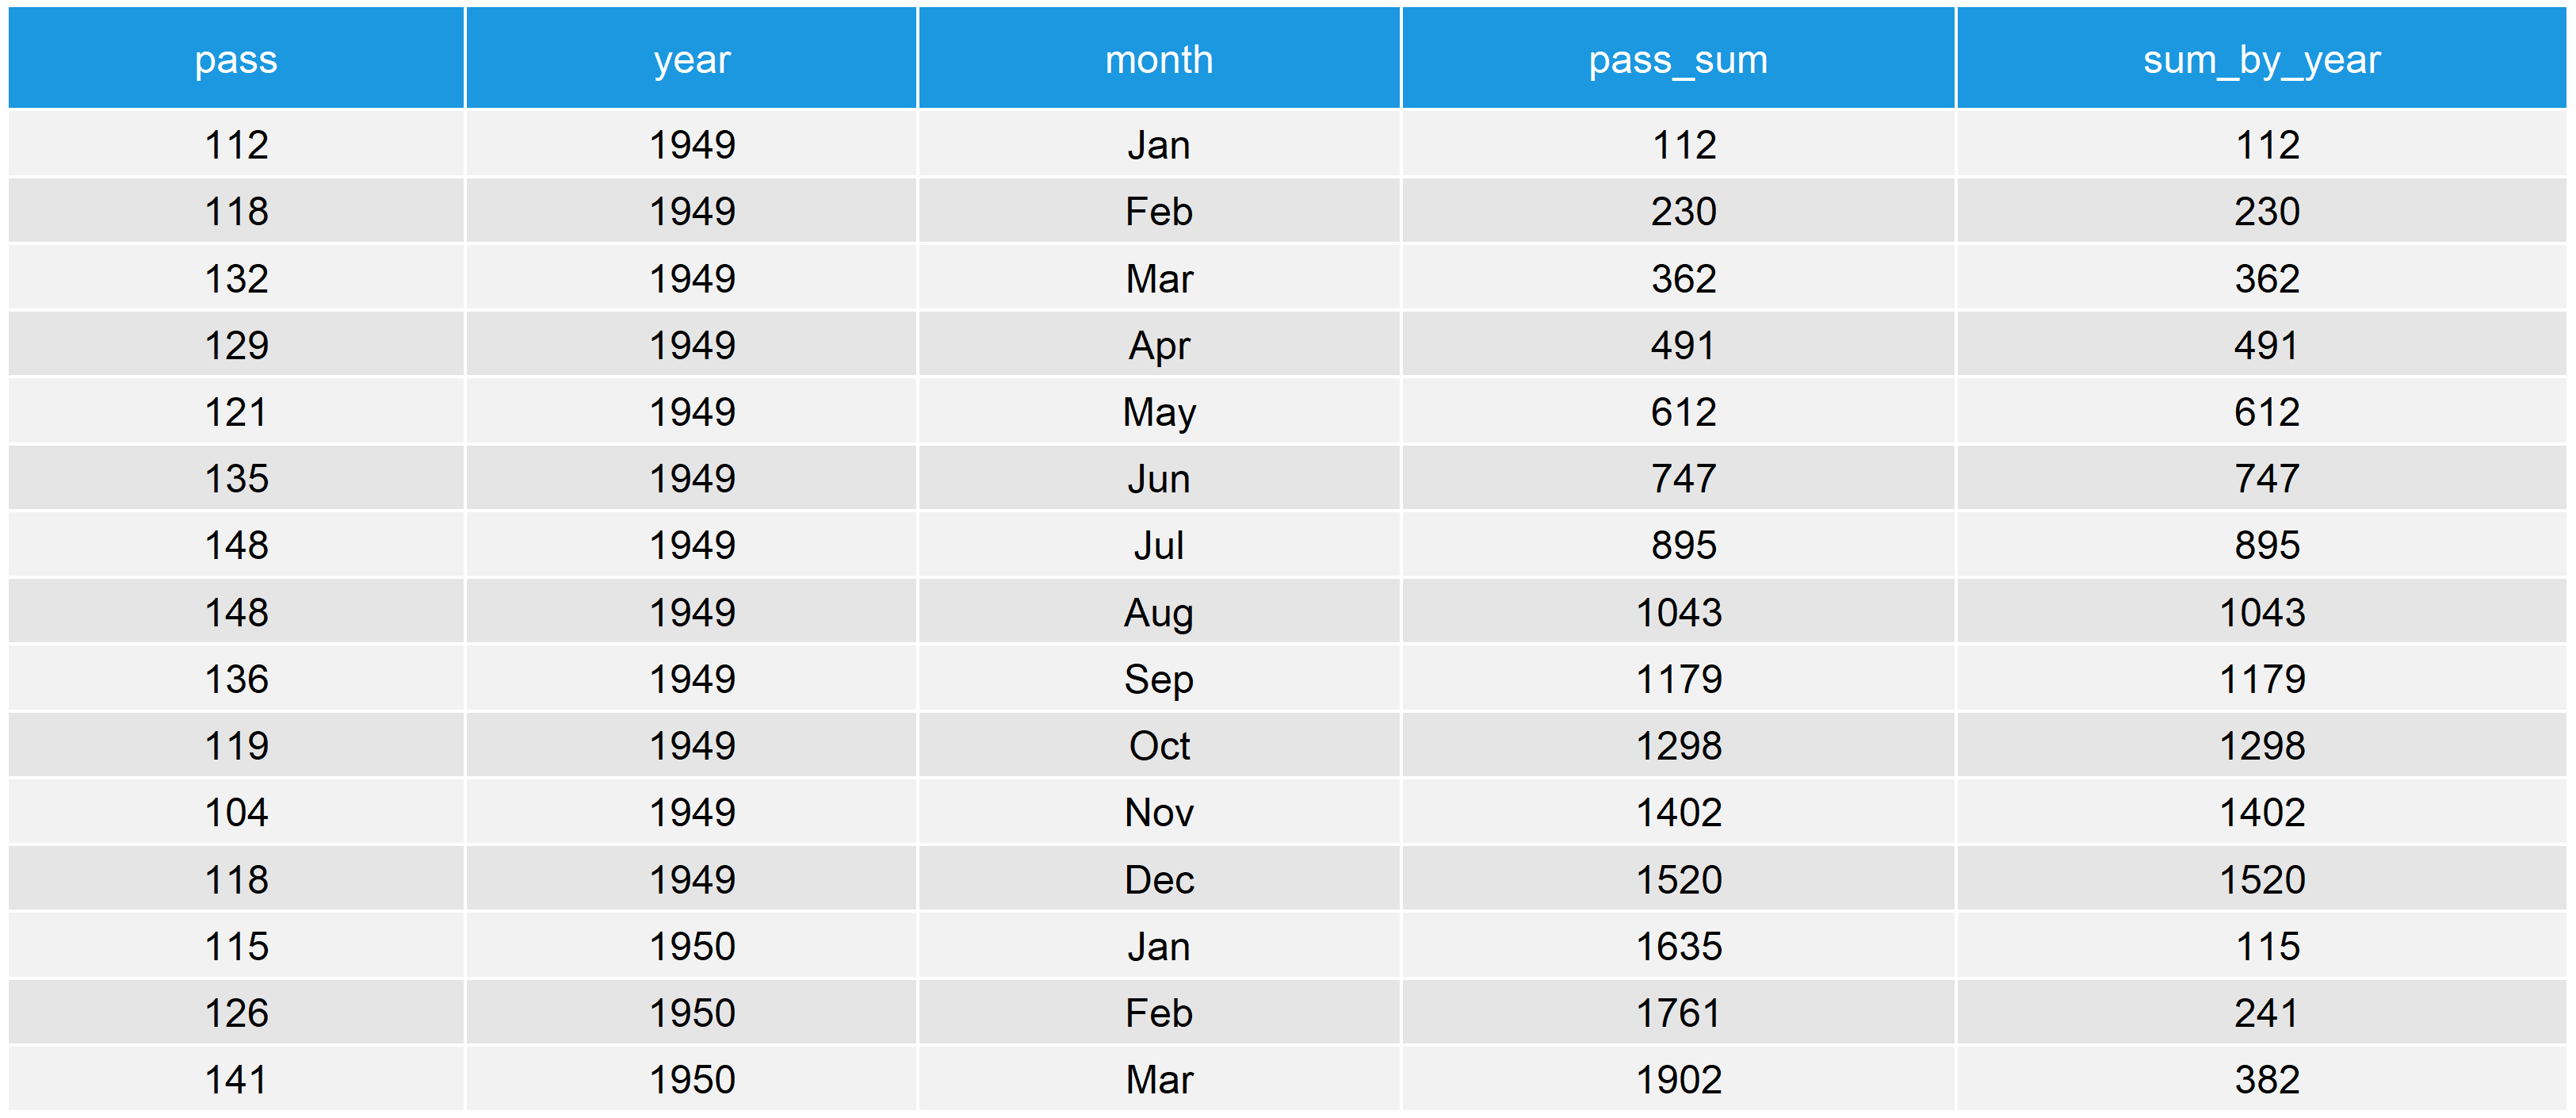
With the cumsum function, it is also possible to calculate the cumulative sum by group. Imagine you would like to calculate the cumulative sum by year (instead of the whole time series):
as.numeric(unlist(tapply(data$pass, data$year, cumsum)))
# 112  230  362  491  612  747...
Of course, you could also add this calculation to your data matrix:
data$sum_by_year <- as.numeric(unlist(tapply(data$pass, data$year, cumsum)))
data[1:15, ]                         # First 15 rows of AirPassengers data.frame

Table 2: AirPassengers Data Frame with Cumulative Sum Conditional on Group
Please have a look at this tutorial to get more information on how to calculate the cumulative sum by group. In the tutorial, I’m also explaining how to use the dplyr and data.table packages for this task.
R cumsum – How to Ignore NA?
Missing values need to be addressed when using the cumsum function in R. Otherwise, cumsum returns NA to the RStudio console.
Let’s insert some missing values to the example vector we used in the beginning and let’s see what happens:
x_na <- x                            # Replicate example vector
x_na[c(3, 8)] <- NA                  # Insert missing values at position 3 and 8

cumsum(x_na)                         # Cumsum function returns NAs
# 6 10 NA NA NA NA NA NA NA NA...
After the first NA at position 3, the cumsum function returns NA (not good).
Unfortunately, the na.rm option is not available within the cumsum function. However, the is.na function provides a good alternative:
cumsum(x_na[!is.na(x_na)])           # Use the is.na function to ignore NA
# 6 10 18 22 28 31 35 42
As you can see, the is.na function excludes all NAs from our example vector and, hence, the cumulative sum is calculated for all available cases (much better).
Video Explanation: How to Use cumsum in R
Do you need some more explanations and examples of the cumsum R function? I can recommend the following video of my YouTube channel:
Appendix
par(mar = c(0, 0, 0, 0))
par(bg = "#353436")

N <- 1000                            # Sample size
x1 <- cumsum(rnorm(N, 1, 5))         # Cumsum of normal distribution
x2 <- cumsum(rnorm(N, 1, 5))
x3 <- cumsum(rnorm(N, 1, 5))
x4 <- cumsum(rnorm(N, 1, 5))
x5 <- cumsum(rnorm(N, 1, 5))
x6 <- cumsum(rnorm(N, 1, 5))
x7 <- cumsum(rnorm(N, 1, 5))
x8 <- cumsum(rnorm(N, 1, 5))
x9 <- cumsum(rnorm(N, 1, 5))
x10 <- cumsum(rnorm(N, 1, 5))

# Add lines to plot
plot(x = 1:length(x1), y = x1, col = "#1b98e0", type = "l")
points(x = 1:length(x2), y = x2, col = "#1b98e0", type = "l")
points(x = 1:length(x3), y = x3, col = "#1b98e0", type = "l")
points(x = 1:length(x4), y = x4, col = "#1b98e0", type = "l")
points(x = 1:length(x5), y = x5, col = "#1b98e0", type = "l")
points(x = 1:length(x6), y = x6, col = "#1b98e0", type = "l")
points(x = 1:length(x7), y = x7, col = "#1b98e0", type = "l")
points(x = 1:length(x8), y = x8, col = "#1b98e0", type = "l")
points(x = 1:length(x9), y = x9, col = "#1b98e0", type = "l")
points(x = 1:length(x10), y = x10, col = "#1b98e0", type = "l")


4 Comments. Leave new
Hello, i have a question. I have a timeseries with date and price of a share. I want to calculate the cumsum for only 12 Month( date with year- month- day) of the timeseries. Could you tell me how to setup a start and a end for the cumsum function? I have to calculate it many times for many years.
Hey Franz,
This is actually a very interesting question. I have created an example that creates a new data frame column containing the cumulative sum by year. Please have a look at the code and its output below:
I hope that helps!
Joachim
Dear Joachim, Good day:
I want to plot a cumsum graph to see how biomass increases or decreases with tree size, but when I run the function it only plots a point in the middle of the graph. I wrote the following loop:
x&y are numerical vectors. dbh (size) starts from 1 up to 100cm. Y is biomass.
dat <- dat[order(agb.dat$dbh, decreasing=FALSE),] # small to large
sumdbh <- sumagb <- numeric()
for(i in 1:nrow(dat)){
sumdbh[i] <- cumsum(dat$dbh[1:i])
sumagb[i] <- cumsum(dat$chave2014[1:i])
}
plot(sumagb ~ sumdbh)
After running it I got 50 warnings telling me this:
49: In sumdbh[i] <- cumsum(agb.dat$dbh[1:i]) :
number of items to replace is not a multiple of replacement length
50: In sumagb[i] <- cumsum(agb.dat$chave2014[1:i]) :
number of items to replace is not a multiple of replacement length
Hey Diego,
The cumsum function returns a vector, and you are trying to insert this vector to a single index position (i.e. sumdbh[i] <- cumsum(dat$dbh[1:i])). There should be more efficient solutions, but I assume that sumdbh[i] <- sum(dat$dbh[1:i]) should work (sum instead of cumsum). I hope that helps! Joachim