rbind in R | 3 Examples (Vector, Data Frame & rbind.fill for Missing Columns)
Basic R Syntax:
rbind(my_data, new_row)
The name of the rbind R function stands for row-bind. The rbind function can be used to combine several vectors, matrices and/or data frames by rows. Above, you can find the basic code for rbind in R.
In the following article, I’m going to provide you with 3 examples for the application of the rbind function in R. Let’s start right away…
Example 1: rbind Vector to Data Frame
The easiest way of using rbind in R is the combination of a vector and a data frame. First, let’s create some example data frame…
x1 <- c(7, 4, 4, 9)                  # Column 1 of data frame
x2 <- c(5, 2, 8, 9)                  # Column 2 of data frame
x3 <- c(1, 2, 3, 4)                  # Column 3 of data frame
data_1 <- data.frame(x1, x2, x3)     # Create example data frame
…and an example vector:
vector_1 <- c(9, 8, 7) # Create example vector
Now, let’s rbind this vector to the data frame:
rbind(data_1, vector_1) # rbind vector to data frame

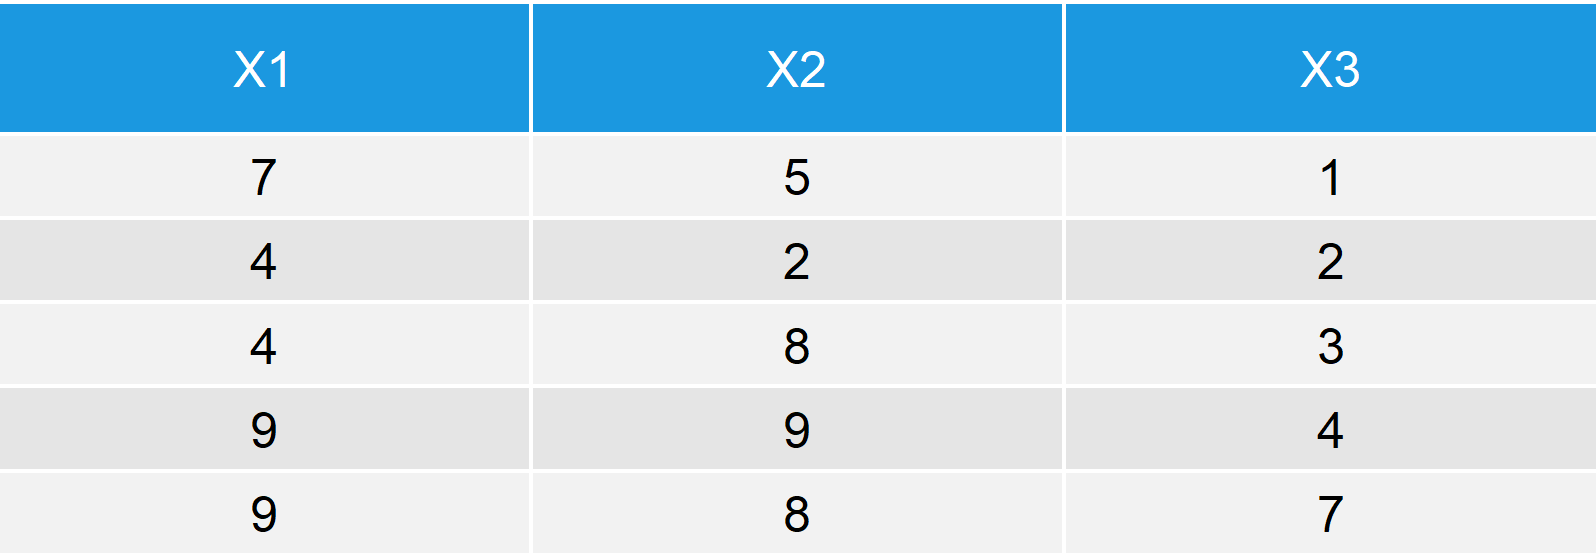
Table 1: Output Data Table after Applying rbind to Vector and Data Frame.
Table 1 illustrates the output of the rbind function: The first four rows are identical to our original data frame data_1; the fifth row is identical to our vector vector_1.
Example 2: rbind Two Data Frames in R
The rbind command can also be applied to two data frames. Let’s create a second data frame and row bind it to data_1 (the data frame that we created above):
x1 <- c(7, 1)                        # Column 1 of data frame 2
x2 <- c(4, 1)                        # Column 2 of data frame 2
x3 <- c(4, 3)                        # Column 3 of data frame 2
data_2 <- data.frame(x1, x2, x3)     # Create second data frame
We can rbind these two data frames with the same R code as before:
rbind(data_1, data_2) # rbind two data frames in R

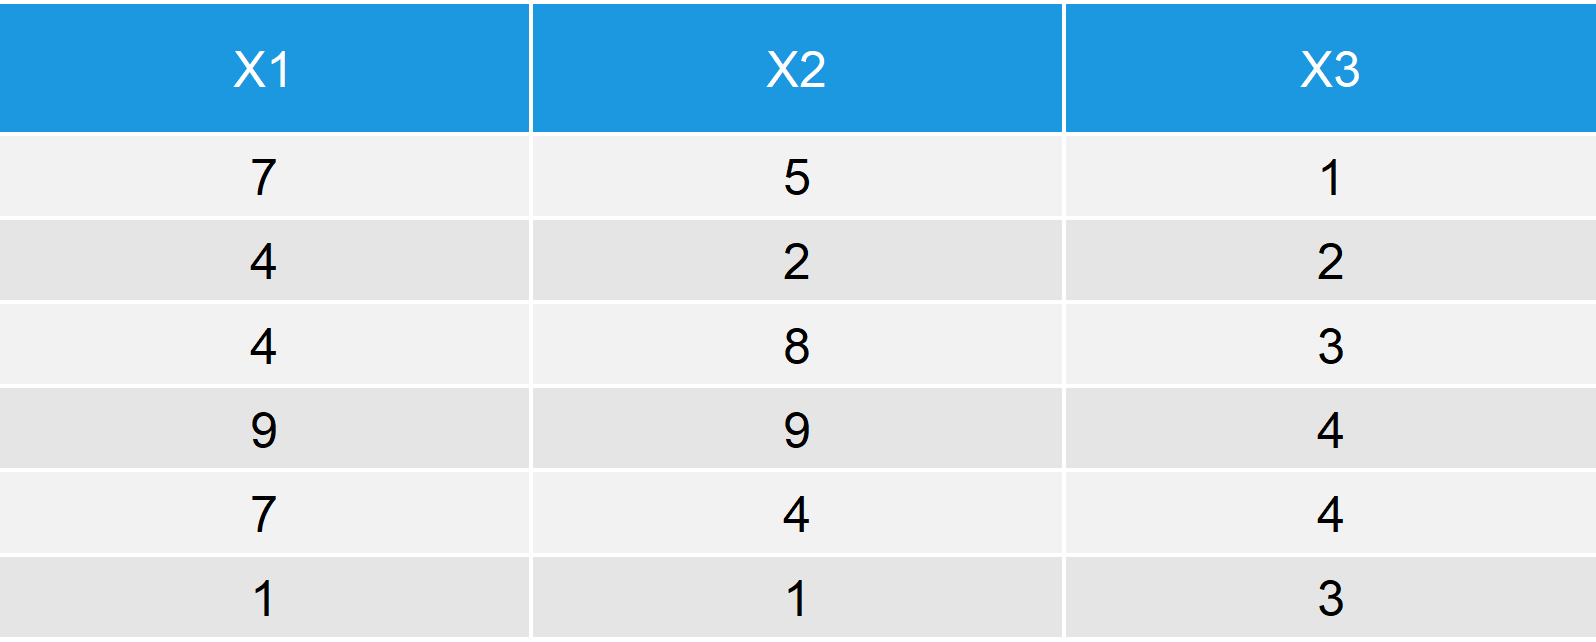
Table 2: Output after row-binding Two Data Frames in R.
As in Example 1, the upper part of the rbind output consists of data_1 and the lower part of the rbind output consists of data_2.
Note: Both data frames have the same column names. When the columns of the two data frames differ, it gets a bit more complicated. In the next example, I’m going to show you how to rbind data frames with different column names.
Example 3: rbind fill – Row Bind with Missing Columns
The binding of data frames with different columns / column names is a bit more complicated with the rbind function. R usually returns the error “Error in match.names(clabs, names(xi))”, if you try to use the rbind function for data frames with different columns.
For that reason, the plyr package (be careful: it’s called plyr; not dplyr) provides the rbind.fill R function as add-on to the rbind base function. In the following example, I’ll show you how to use the plyr rbind.fill function in R.
Consider the following two example data frames:
col1 <- c(5, 1, 1, 8)                # Column 1 of data frame 1 plyr example
col2 <- c(9, 7, 5, 1)                # Column 2 of data frame 1 plyr example
col3 <- c(1, 1, 2, 2)                # Column 3 of data frame 1 plyr example

data_plyr1 <- data.frame(col1, col2, col3) # Create plyr data frame 1
# col1 col2 col3
#    5    9    1
#    1    7    1
#    1    5    2
#    8    1    2
col3 <- c(5, 1, 1, 8)                # Column 1 of data frame 2 plyr example
col4 <- c(9, 7, 5, 1)                # Column 2 of data frame 2 plyr example

data_plyr2 <- data.frame(col3, col4) # Create plyr data frame 2
# col3 col4
#    5    9
#    1    7
#    1    5
#    8    1
To apply rbind.fill in R, we need to load the plyr package first:
library("plyr") # Load plyr package
Now, we can apply the rbind.fill R command to our two example data frames:
rbind.fill(data_plyr1, data_plyr2) # Apply the rbind.fill plyr function

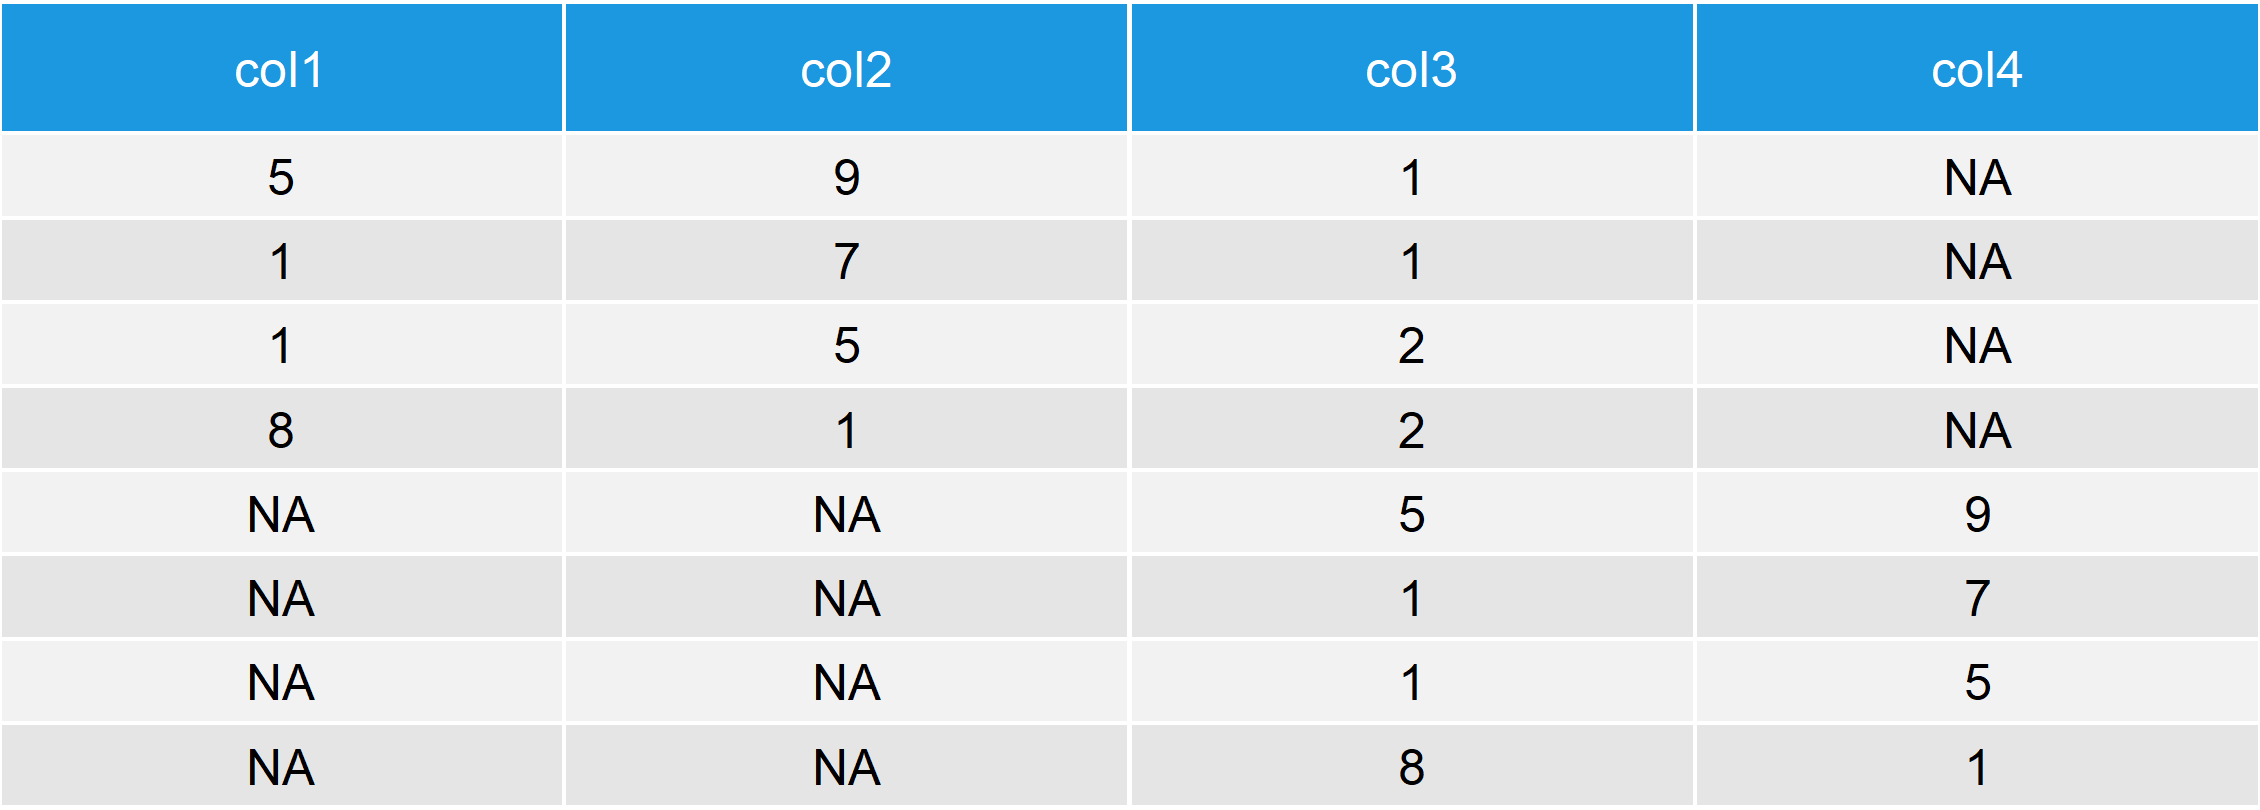
Table 3: Output after row-binding Two Data Frames with the rbind.fill R Function.
Table 3 makes it clear how rbind fill works: The function creates a column for each column name that appears either in the first or in the second data matrix. If a column exists in both data frames, it is row binded as usual. However, if a column is missing in one of the two data frames, the empty cells are replaced by NA.
In the previous two examples we have combined only two data frames. However, please note that it would also be possible to rbind multiple data sets using the rbind and rbind.fill functions. We can simply specify as many data frame objects within those functions as we want.
Video: Further Examples of rbind & rbind.fill
Have a look at the following video of my Statistics Globe YouTube channel. In the video, I’m showing two examples for rbind() and rbind.fill() based on a real data set.
By the way, I have released many statistical programming videos on my YouTube channel already. So make sure to subscribe to my channel to get informed about new videos.
Furthermore, you may check out the following list of R programming tutorials that I have published on this website. They explain related concepts to the content of this article.
Further Reading
- The cbind Function in R
- bind_rows & bind_cols functions of dplyr Package
- The merge Function in R
- Convert List to Data Frame
- Subsetting Data Frame in R
- NA Values in R
- The R Programming Language


4 Comments. Leave new
Excellent
Thanks again, Zainab! 😀
I have been trying to combine multiple csv’s with same data types but varing headers. I want the end product to have TmStamp_UTC, WaterTemp_C, and SensorDepth_m. This is what I have been trying but I get object not found errors:
(thanks for any insight)
> total_wl_data % ncol(.)),
+ skip1 = map_dbl(files, ~read_csv(.x, skip =1) %>% ncol(.)),
+ num = if_else(skip1 > skip0, 1, 0),
+ data = map2(files, num, ~read_csv(.x, skip = .y))
+ ) %>%
+ select(files, data)
> total_wl_data
# A tibble: 0 × 2# ℹ 2 variables: files , data > wl_clean %
+ mutate(data = map(data, ~mutate_all(.x, as.character))) %>%
+ unnest() %>%
+ mutate(
+ TmStamp_UTC = coalesce(
+ ‘Date Time, GMT+00:00’,
+ TimeStamp_UTC,
+ TmStamp_UTC,
+ `Date Time`
+ )
+ > wl_clean %
+ mutate(data = map(data, ~mutate_all(.x, as.character))) %>%
+ unnest() %>%
+ mutate(
+ TmStamp_UTC = coalesce(
+ ‘Date Time, GMT+00:00’,
+ TimeStamp_UTC,
+ TmStamp_UTC,
+ `Date Time`
+ ),
+ WaterTemp_C = coalesce(
+ `Temp, °C (LGR S/N: 10365879, SEN S/N: 10365879, LBL: w_temp)`,
+ WaterTemp_C,
+ `Temp, °C (SEN S/N: 10365879, LBL: w_temp)`,
+ `w_temp Temp (°C)`,
+ `w_temp Temp (C)`
+ ),
+ SensorDepth_m = coalesce(
+ `Sensor Depth, meters (LGR S/N: 10365879)`,
+ `SensorDepth,_m`,
+ `Sensor Depth, meters`,
+ SensorDepth_m,
+ `Sensor Depth (meters)`
+ )
+ ) %>%
+ select(files, TmStamp_UTC, WaterTemp_C, SensorDepth_m)
Hello Brandon,
I could return to the questions just now. I was on vacation recently. Do you still need help?
Best,
Cansu