asp in R Plot (2 Example Codes) | Set Aspect Ratio of Scatterplot & Barplot
In this R tutorial, I’m going to show you how to use the asp option to set the aspect ratio of a plot, i.e. the proportional relationship between width and height of the plot axes. Let’s start with the basic R syntax:
Basic R Syntax:
plot(x, y, asp = 5)
The asp option sets a plot window so that one data unit in the x direction is equal to the length of asp multiplied by one data unit in the y direction.
That may sound a bit difficult to understand. However, in practice the application of asp is quite easy. So let’s directly move on to the examples!
Example 1: Set Aspect Ratio of Scatterplot
In the first example, I’ll show you how to set the asp option within a regular scatterplot. Let’s first create some example data:
set.seed(99999)              # Set seed for reproducibility
x <- runif(100)              # Create random x variable
y <- x + runif(100)          # Create y variable correlated with x
We can now plot this data in a regular scatterplot without setting the aspect ratio:
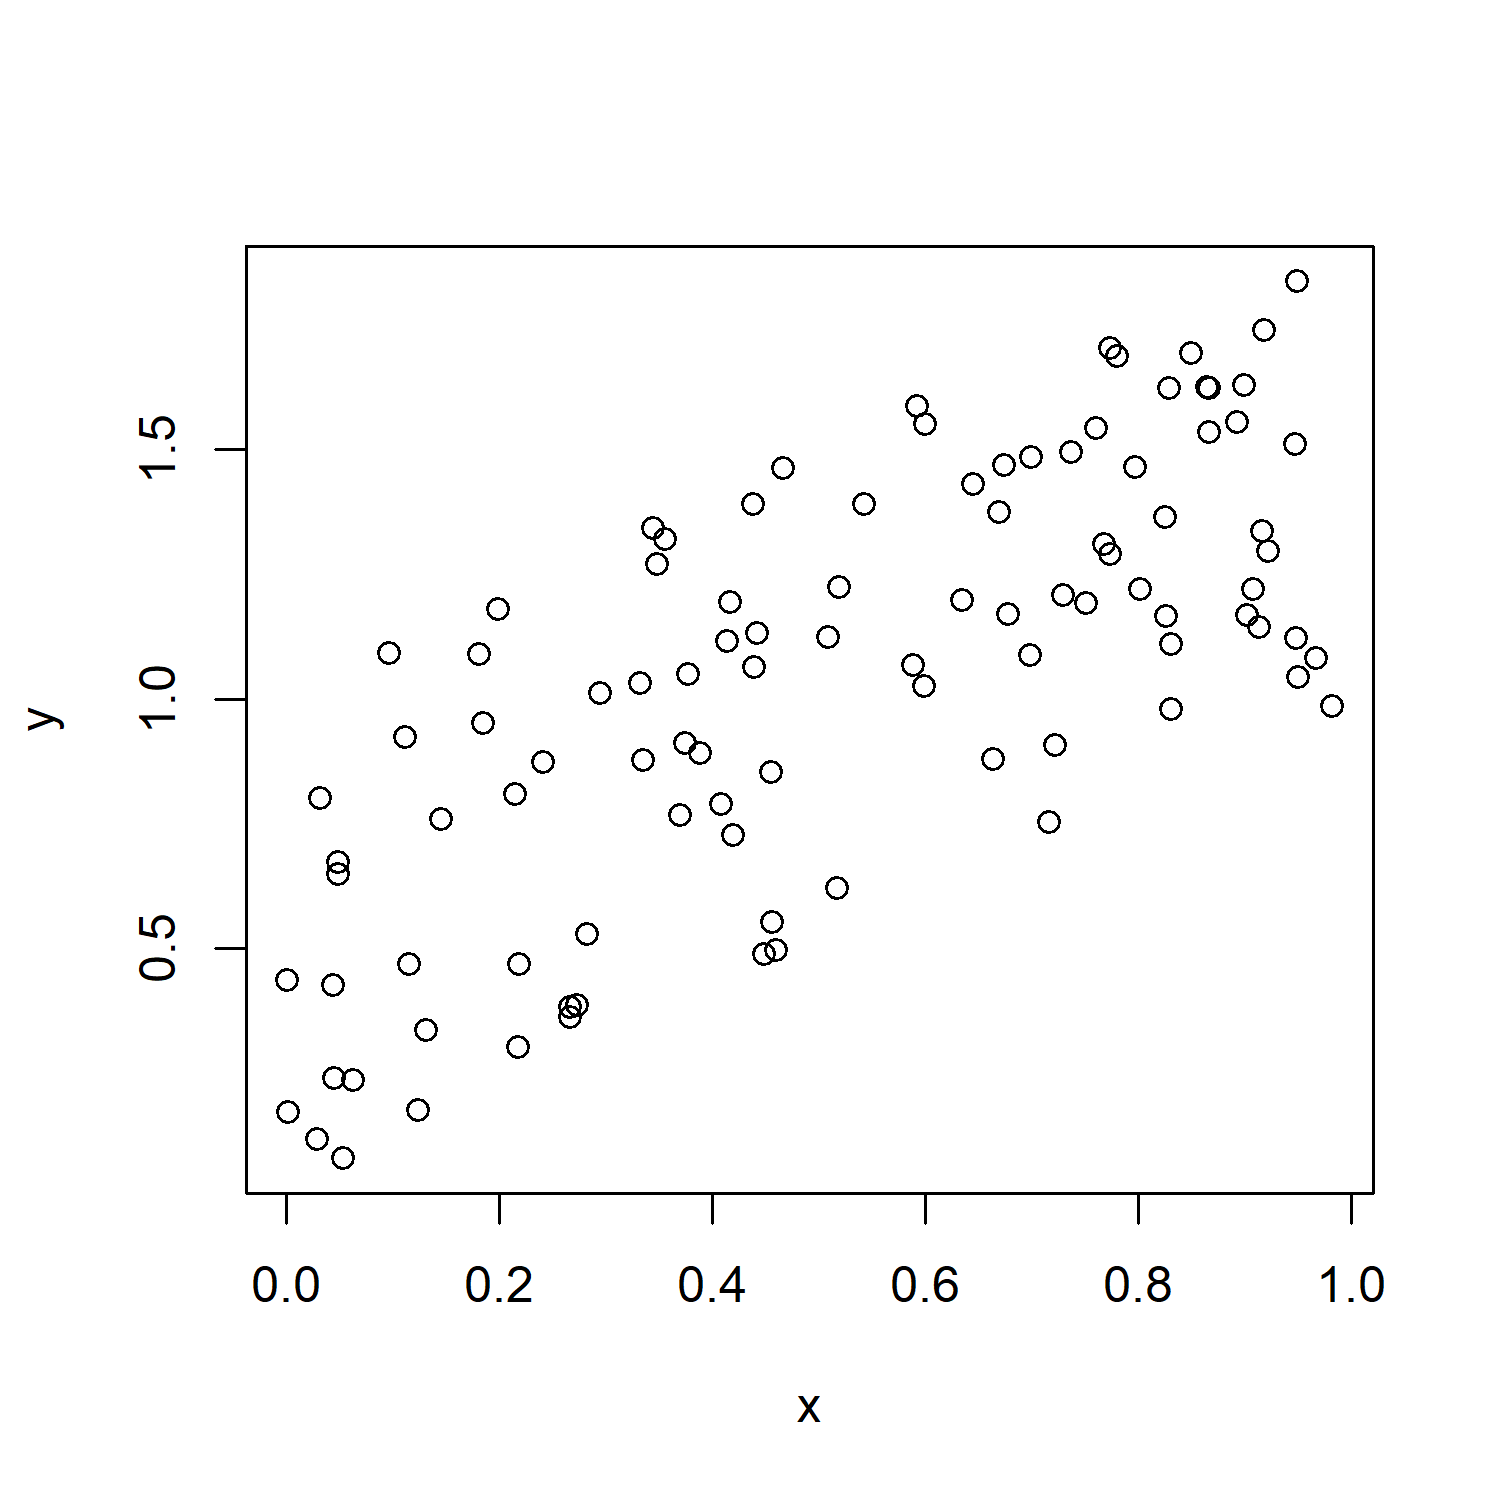
plot(x, y) # Plot without setting aspect ratio

Figure 1: Regular Scatterplot in R.
As you can see, the limits of the x-axis of our plot are set to 0 and 1 and the limits of our y-axis are set to 0 and 2.
With the asp option, we can now modify the width of the x-axis in any ratio to the y-axis that we want.
Let’s do this:
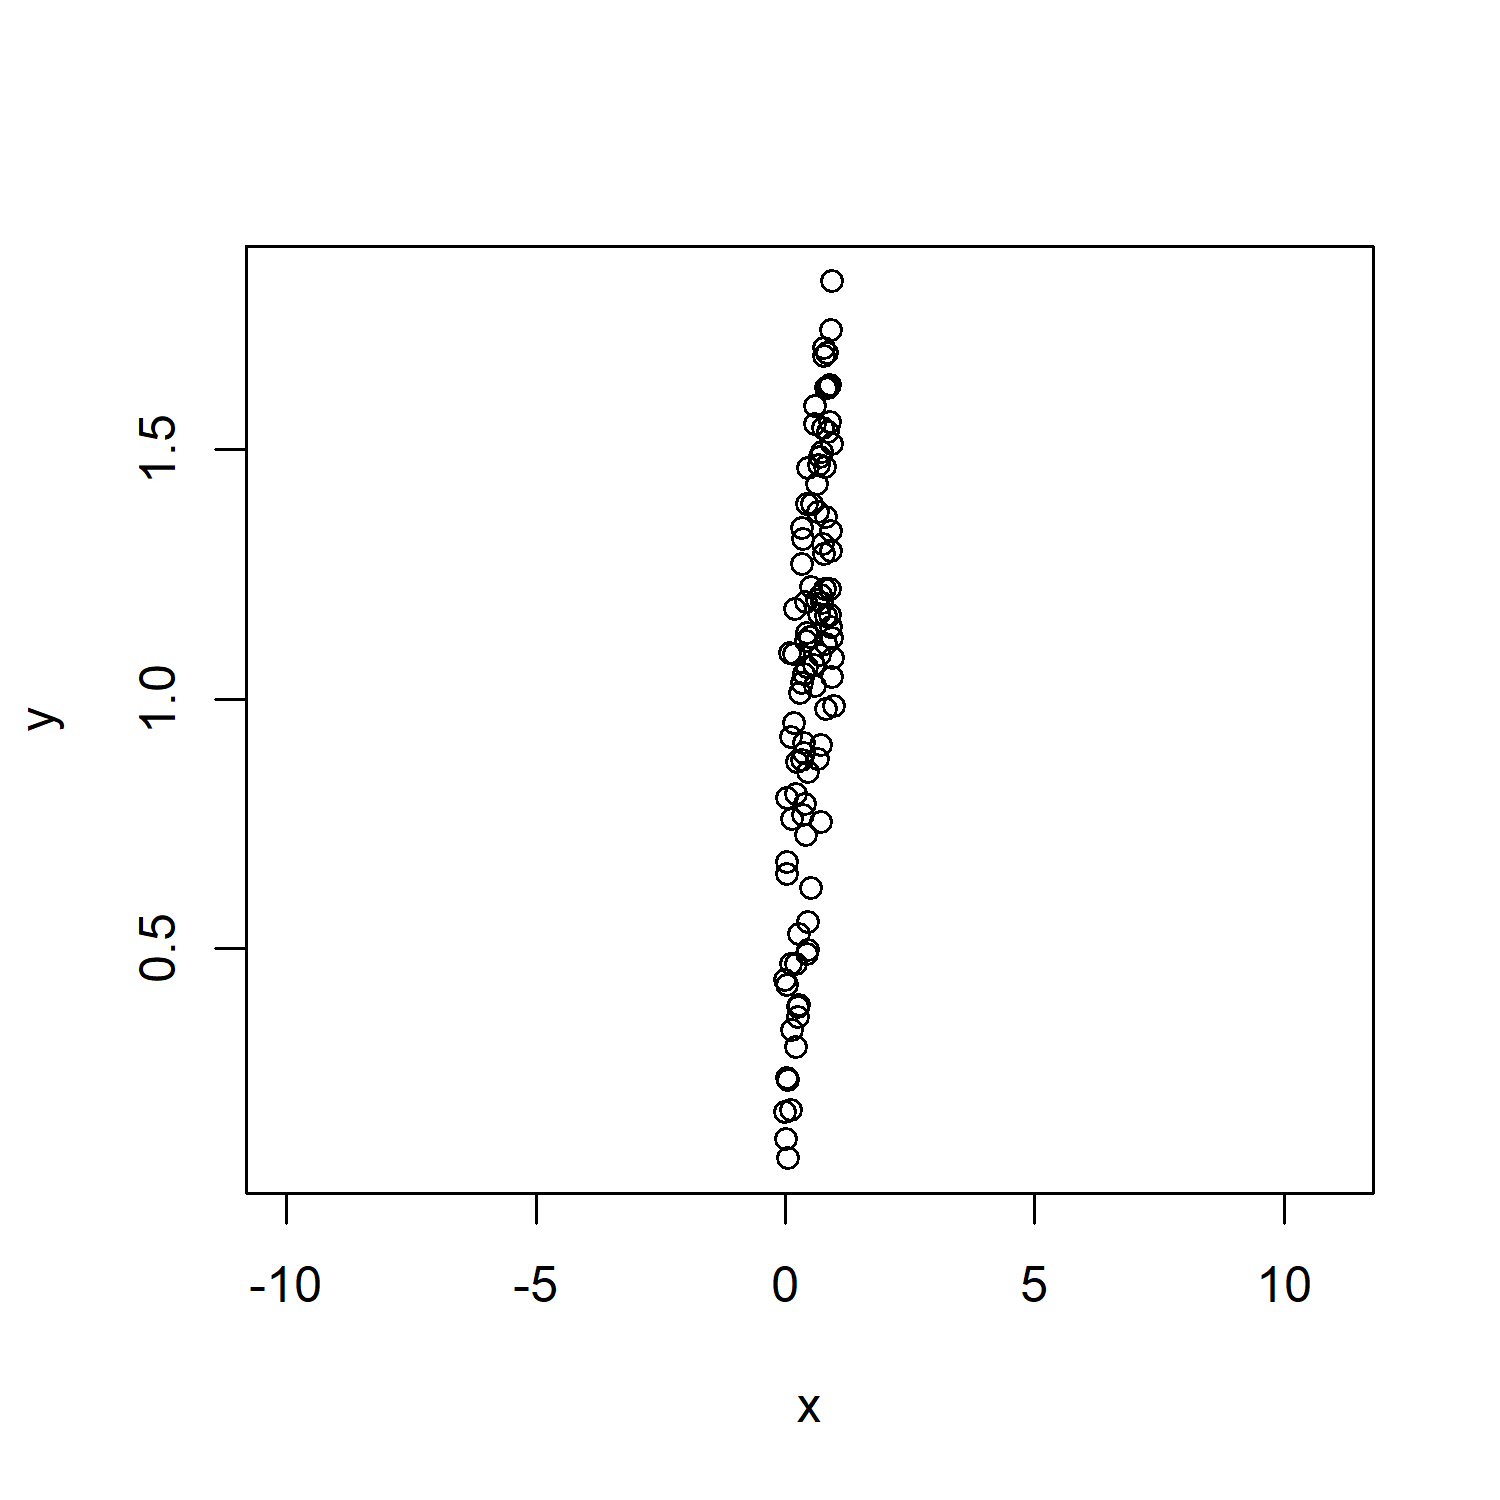
plot(x, y, asp = 10) # Plot with asp = 10

Figure 2: Scatterplot with asp Option Set to 10.
Since we defined asp = 10 within the plot function of R, the width of the x-axis was increased heavily. Of cause you can set the aspect ratio to whatever value you like (as long as the value is positive and finite).
Note: We could change the width and length ranges of our plot with other specifications such as xlim and ylim. However, the advantage of the asp option is that we can maintain a specific aspect ratio without doing any calculations.
So, can we apply the R asp option also to other types of plots? Sure, keep on reading…
Example 2: Modify asp of Barplot
In the second example, I’m going to use the asp specification in order to change the axis of a barplot. For the example, I’m using the x vector that we have created in example 1.
Let’s first draw a regular barplot:
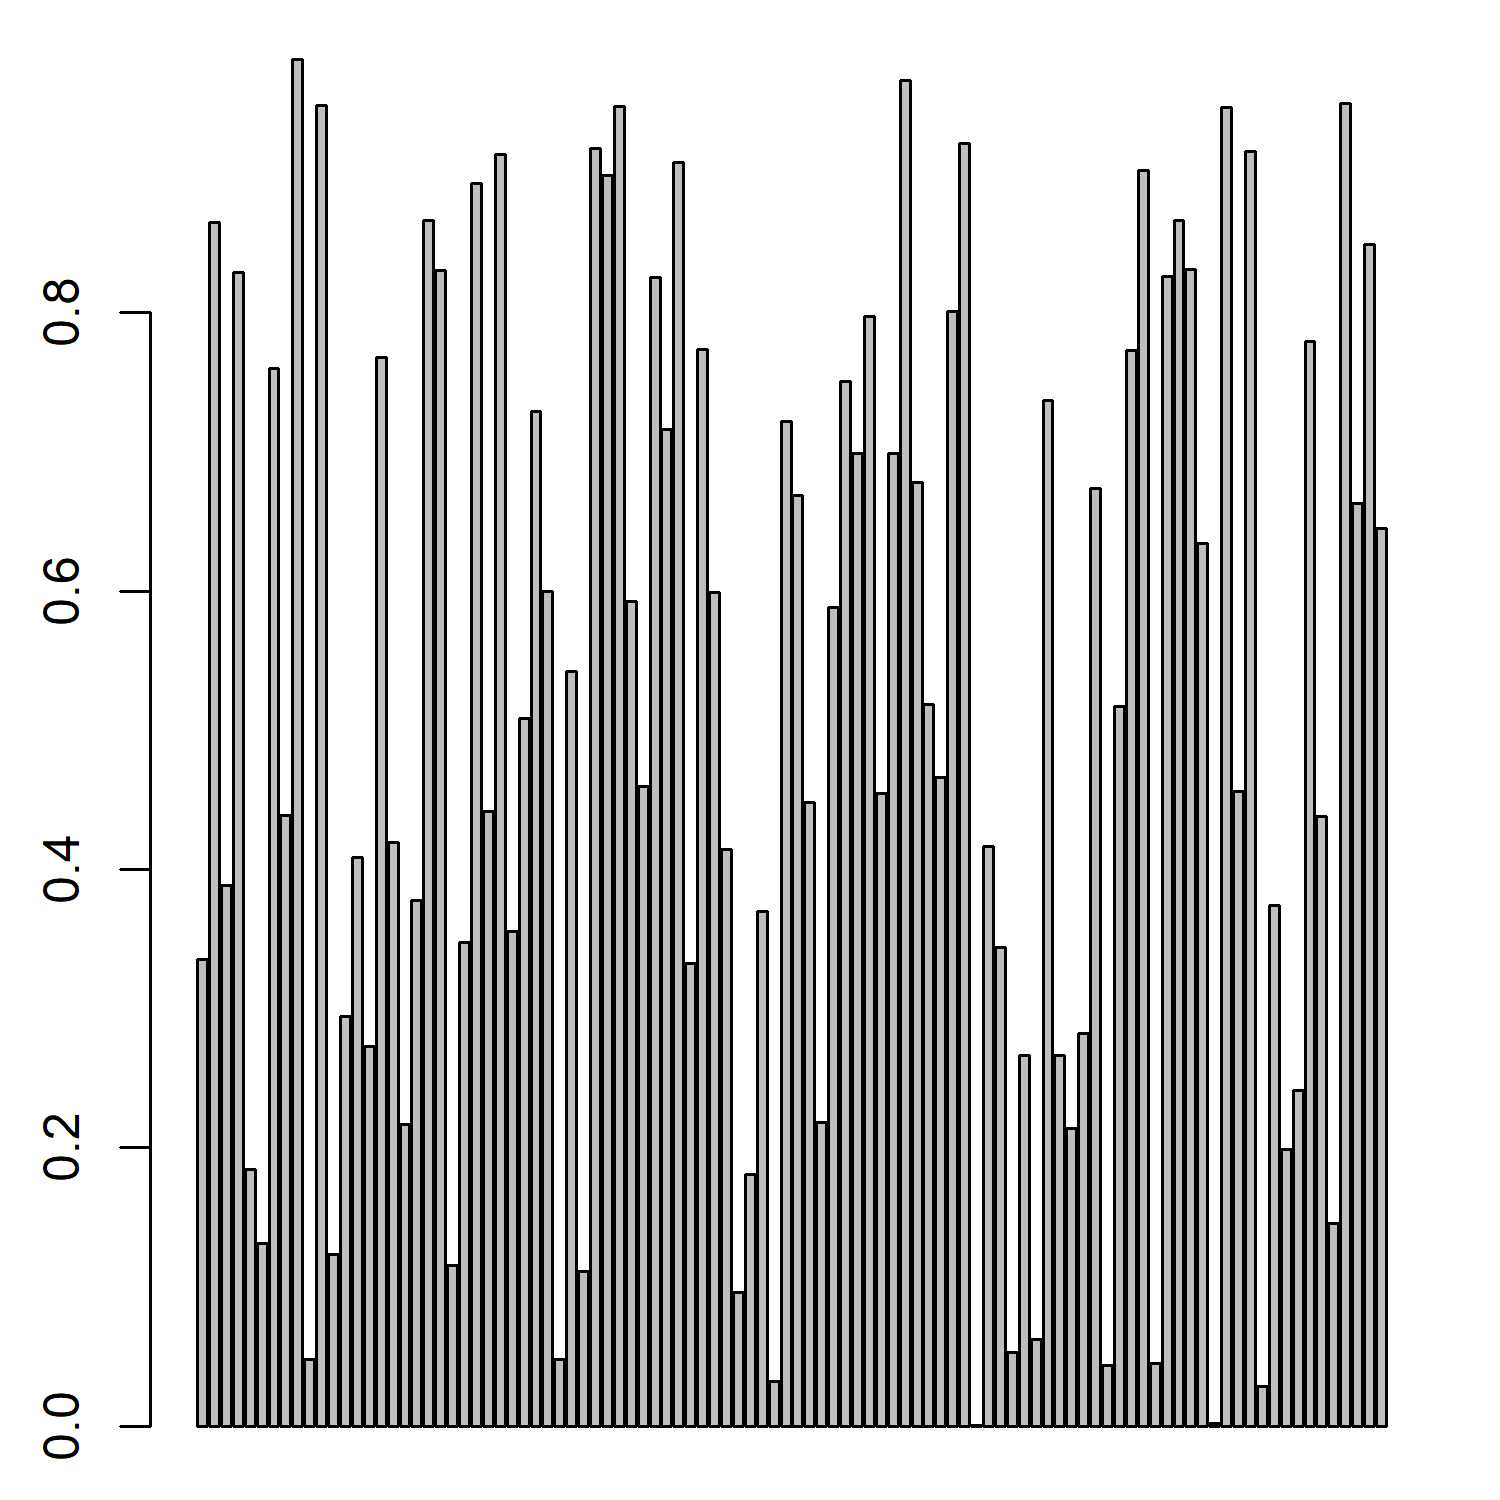
barplot(x) # Regular barplot

Figure 3: Regular Barplot in R.
As before, we can now specify asp within the barplot function to modify the axes of our plot:
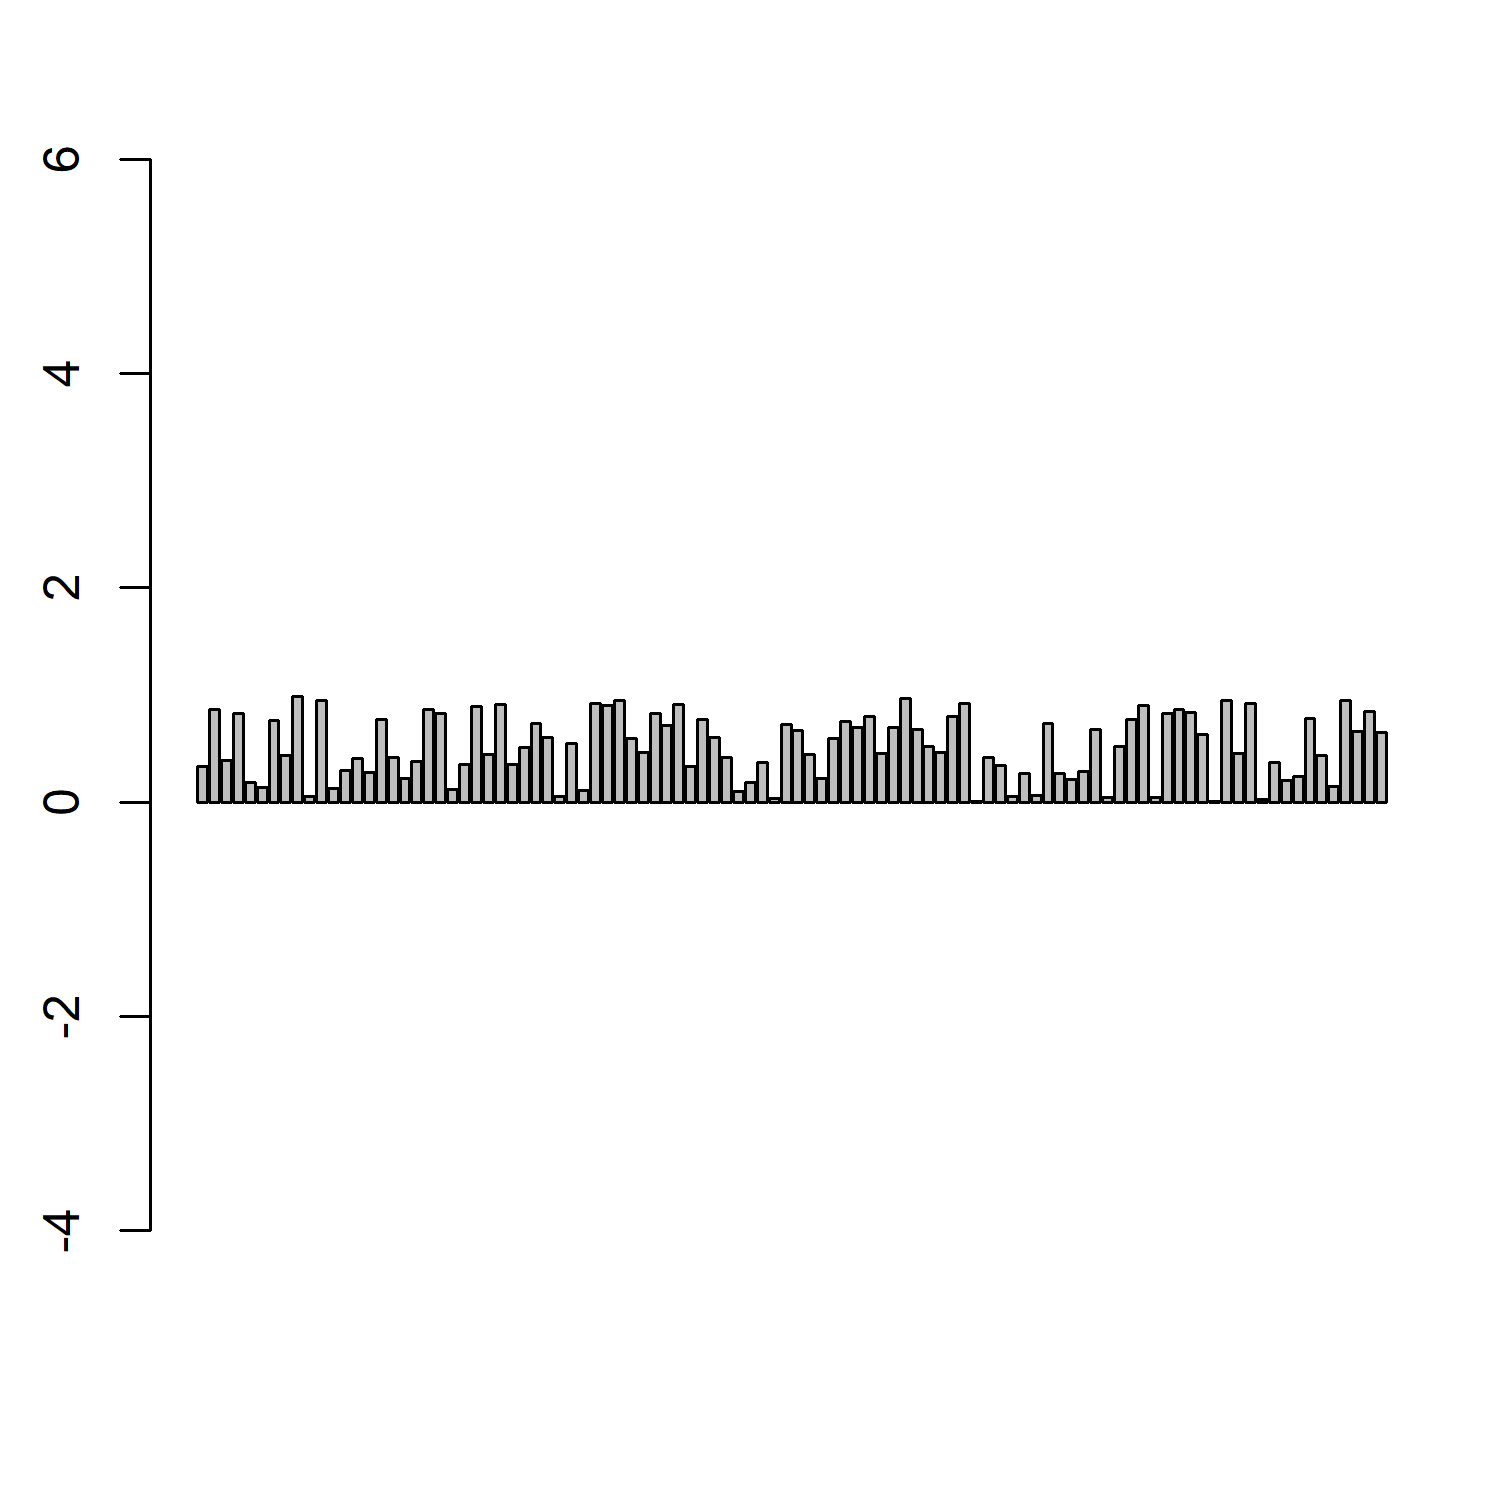
barplot(x, asp = 10) # Barplot with aspect ratio of 10

Figure 4: Barplot with asp Option Set to 10.
Note: Within the barplot function, the asp option increases the width of the y-axis.
Video Examples: Different Plot Types in R
In this R tutorial, I have explained the basic application of the asp option for R base plots. No matter if you want to change the aspect ratio of a boxplot, a heatmap, a wordcloud or any other type of chart or graph, the asp option is your friend.
However, if you want to make your plots prettier, the R programming language also provides many other possibilities. If you want to learn more about different types of plots, I can recommend the following YouTube video of Maria Nattestad.
In the video, she is explaining several different plot types of the R package ggplot2. Definitely have a look in case you want to know more about plots in R!
Have fun with the video and let me know in the comments in case you have any feedback or further questions!
Further Reading


