Correlation of One Variable to All Others in R (Example)
In this R tutorial you’ll learn how to calculate the correlation of one data frame column to all the others.
The page contains this:
It’s time to dive into the example…
Creation of Exemplifying Data
Consider the following example data:
set.seed(6529489)                                 # Create example data
data <- data.frame(x1 = rnorm(100),
                   x2 = rnorm(100),
                   x3 = rnorm(100),
                   x4 = rnorm(100))
head(data)                                        # Print head of example data

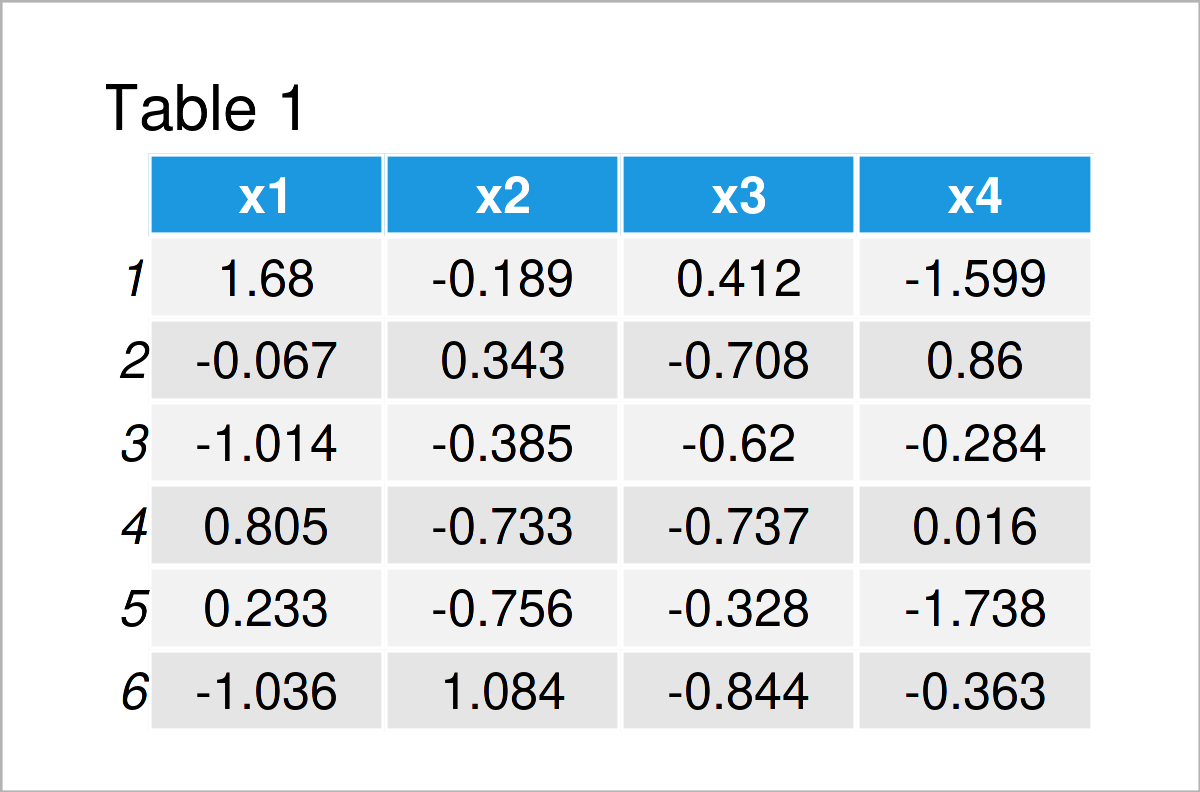
Table 1 shows that our example data is constructed of the four columns “x1”, “x2”, “x3”, and “x4”.
Example: Calculate Correlation of One Variable to All Others Using cor() Function
In this example, I’ll demonstrate how to get the Pearson correlation coefficient between a particular data frame variable with all the other variables in this data frame.
To achieve this, we can apply the cor and colnames functions as shown below:
data_cor <- cor(data[ , colnames(data) != "x1"],  # Calculate correlations
                data$x1)
data_cor                                          # Print correlation values

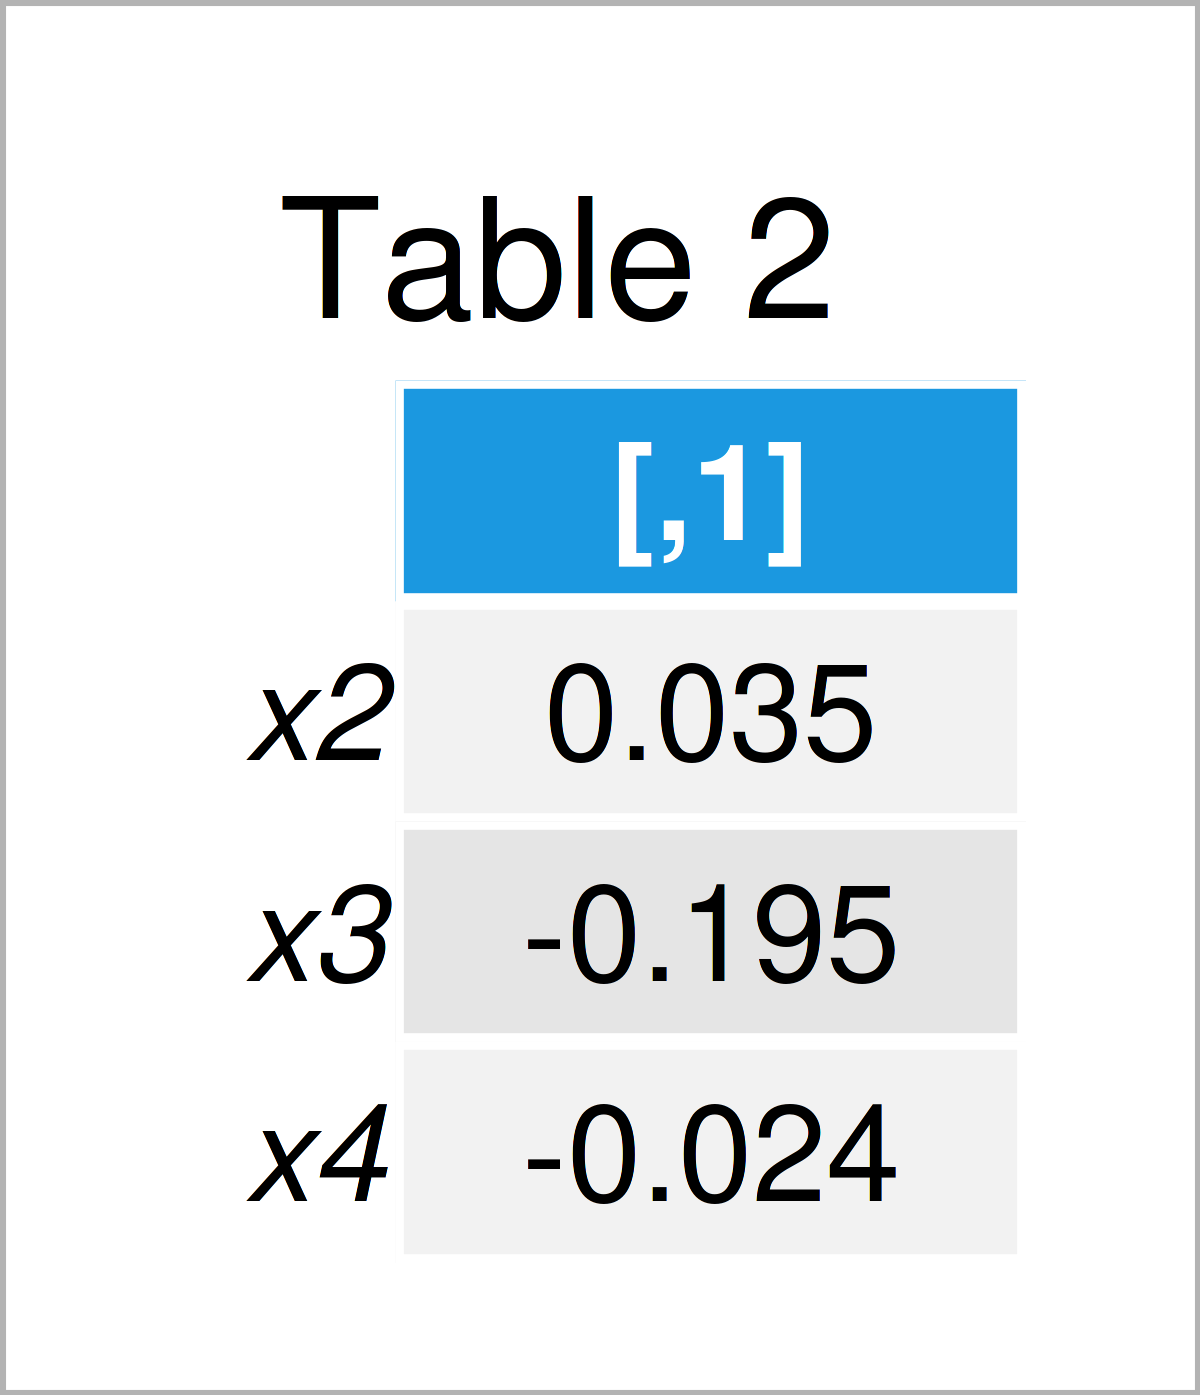
As visualized in Table 2, the previous code has managed to construct a correlation matrix for only one of the columns in our data set.
Video, Further Resources & Summary
If you need more information on the R codes of this article, you might watch the following video on my YouTube channel. I demonstrate the R programming codes of this tutorial in the video:
In addition, you may read the related articles on Statistics Globe. A selection of articles about topics such as ggplot2, variables, lists, and graphics in R is shown below.
- Correlation Matrix in R
- Calculate Correlation Matrix Only for Numeric Columns
- Remove Highly Correlated Variables from Data Frame
- List All Column Names But One in R
- All R Programming Tutorials
This tutorial has demonstrated how to compute the correlation of one data frame column to many others in R. If you have additional questions and/or comments, please let me know in the comments below.


6 Comments. Leave new
Hey thank you for the code, it works fine. I need the significances, too, but cor.mtest doesnt work.Do you have any idea, how to calculate the coefficients and sgnificances?
Hello Vanessa,
You need to convert your data frame to a matrix to use the cor.mtest() function. First, be sure that you install the library:
Then convert your data to a matrix:
After that, you can run the function:
Regards,
Cansu
How can I then plot a corrplot including significant marks (or only circles when significant) for the correlation of x1 with all the other variables (x2, x3 and x4)? resulting in a correlation “vector”
Hello Katharina,
Would a plot like here in the second example help? See the title Use chart.Correlation(): Draw scatter plots.
Best,
Cansu
Is there a way to make this work with cor.test as well? Thanks!
Hello Zach,
I understand that you are intention is to test the correlation between a variable and the others. You can achieve this by using a defined function in the apply() procedure. See the following script.
Best,
Cansu