R transform Function (2 Example Codes) | Transformation of Data Frames
In this tutorial, I’ll explain you how to modify data with the transform function. Let’s first have a look at the basic R syntax and the definition of the function:
Basic R Syntax:
transform(data, x = x_transformed)
Definition:
The transform function modifies data.frames in a quick and easy way.
In the following, I’ll show in two examples how to apply the transform function in R. So without further explanations, let’s move on to the examples…
Example 1: Use transform() to Convert Variables
The transform R function can be used to convert already existing variables of a data frame. Let’s first create an example data frame that we can use in the following examples:
data <- data.frame(x1 = c(1, 7, 5, 4),            # Create example data frame
                   x2 = c(3, 8, 1, 2))
data                                              # Print data to RStudio console

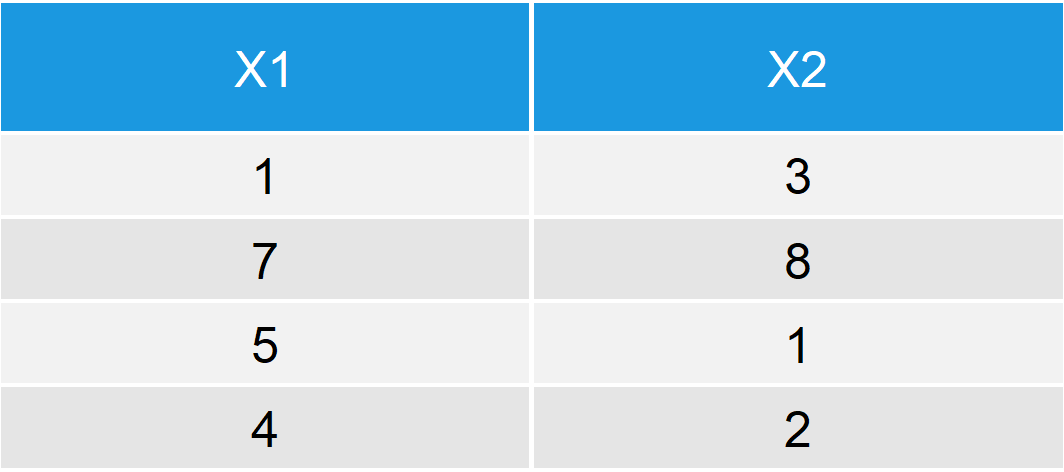
Table 1: Example Data Frame.
Our data contains of two columns (numeric variables) and four rows. Now let’s use the transform function in order to convert the variable x1:
data_ex1 <- transform(data, x1 = x1 + 10)         # Apply transform function
data_ex1                                          # Print data to RStudio console

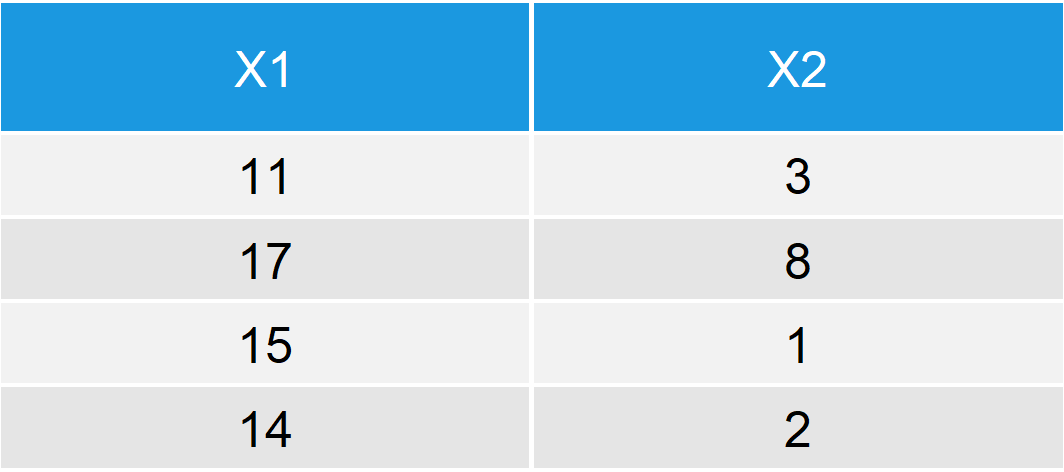
Table 2: Convert Column of Data Frame.
As you can see in Table 2, we have added the value 10 to each of the elements of variable x1. An easy way to modify variables of data.frames!
Check out the following video, in case you need more explanations on the R code of Example 1. I’m explaining this example in the video:
Example 2: Add New Variable to Data
We can also use the transform command to concatenate a completely new variable to our data matrix. Have a look at the following R code:
data_ex2 <- transform(data, x3 = c(5, 3, 3, 1))   # Apply transform function
data_ex2                                          # Print data to RStudio console

Table 3: Add Column to Data Frame.
As you can see, we have added a third column to our data.
Video: Alternatives to the transform Function
In this R tutorial, I have shown you two ways of using transform in order to modify data.frames. However, the R programming language provides many different functions for data manipulation and depending on your specific needs other functions might be preferable. In fact, the transform function is much less popular than other functions such as cbind or rbind.
If you want to learn more about the transformation of data.frames, I can recommend the following video of the DataCamp YouTube channel. Have fun with the video and let me know in the comments, in case you have any questions about data manipulation in R.
Further Reading


6 Comments. Leave new
Hi Joachim,
You are tutorials are excellent, short and crisp. Looking forward to seeing more on 1) data cleaning, 2) join functions, as well as 3) summary statistics when you have factor variables in the data frame.
Many thanks, Nara
Hey Nara, thanks a lot for the very nice comment, very motivating! In fact, your comment motivated me to write the following ultimate guide about the dplyr join functions: https://statisticsglobe.com/r-dplyr-join-inner-left-right-full-semi-anti I hope you like it 🙂
is it possible to have more demos on ‘tableone’ and ‘strata’ functions in r to create table and statistical summaries
Thanks for the follow up comment. Your requests are noted on my to-do-list!
Hi ,I need to know how to generate data from half normal on R
i make transformation from normal to half normal but what can i do the next step ? please
Hey Nadia,
Thank you very much for the interesting question. It has inspired me to create a new tutorial on how to use the half normal distribution in R.
You can find it here.
Regards,
Joachim