Studentized Range Distribution in R (2 Examples) | ptukey & qtukey Functions
In this tutorial, I’ll explain how to apply the Studentized Range distribution functions in R.
Table of contents:
- Example 1: Studentized Range Cumulative Distribution Function (ptukey Function)
- Example 2: Studentized Range Quantile Function (qtukey Function)
- Video & Further Resources
Here’s how to do it.
Example 1: Studentized Range Cumulative Distribution Function (ptukey Function)
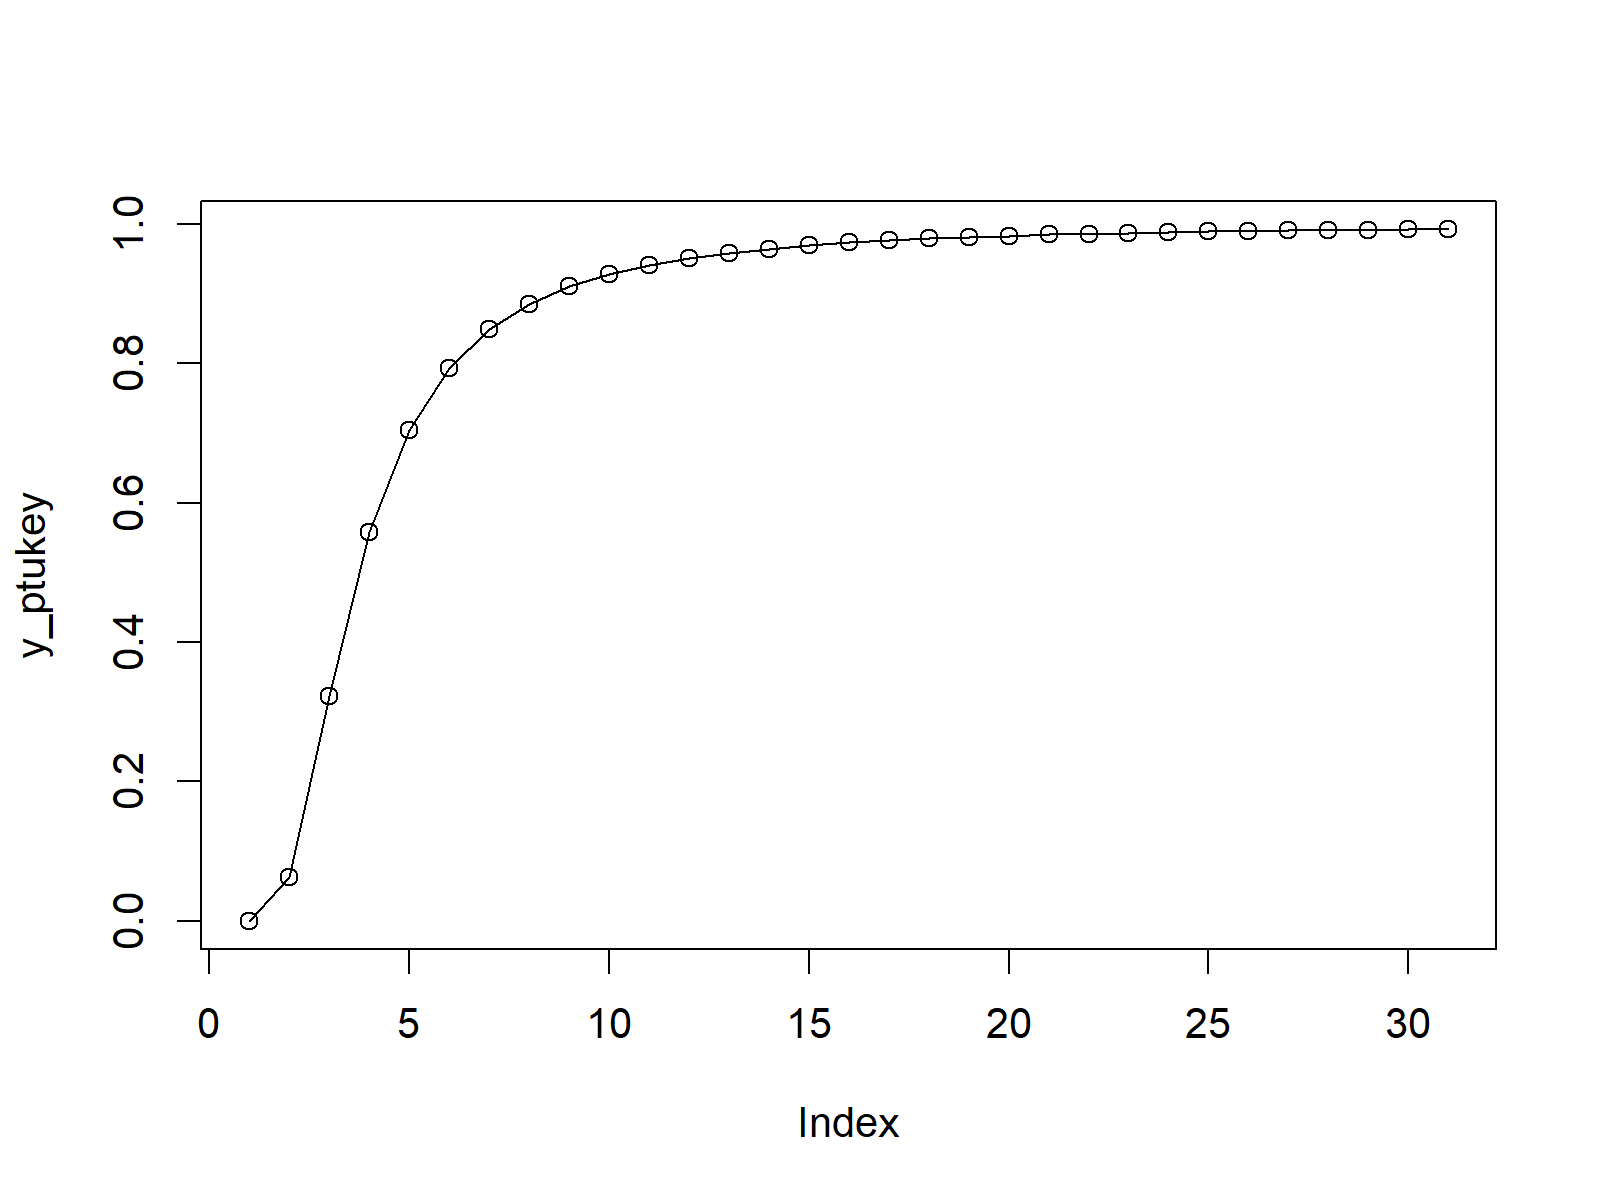
Example 1 shows how to draw a plot of the Studentized Range cumulative distribution function (CDF) in R:
x_ptukey <- seq(0, 30, by = 1)                       # Specify x-values for ptukey function
y_ptukey <- ptukey(x_ptukey, nmeans = 5, df = 2)     # Apply ptukey function
plot(y_ptukey, type = "o")                           # Plot ptukey values

Figure 1: CDF of Studentized Range Distribution in R.
Example 2: Studentized Range Quantile Function (qtukey Function)
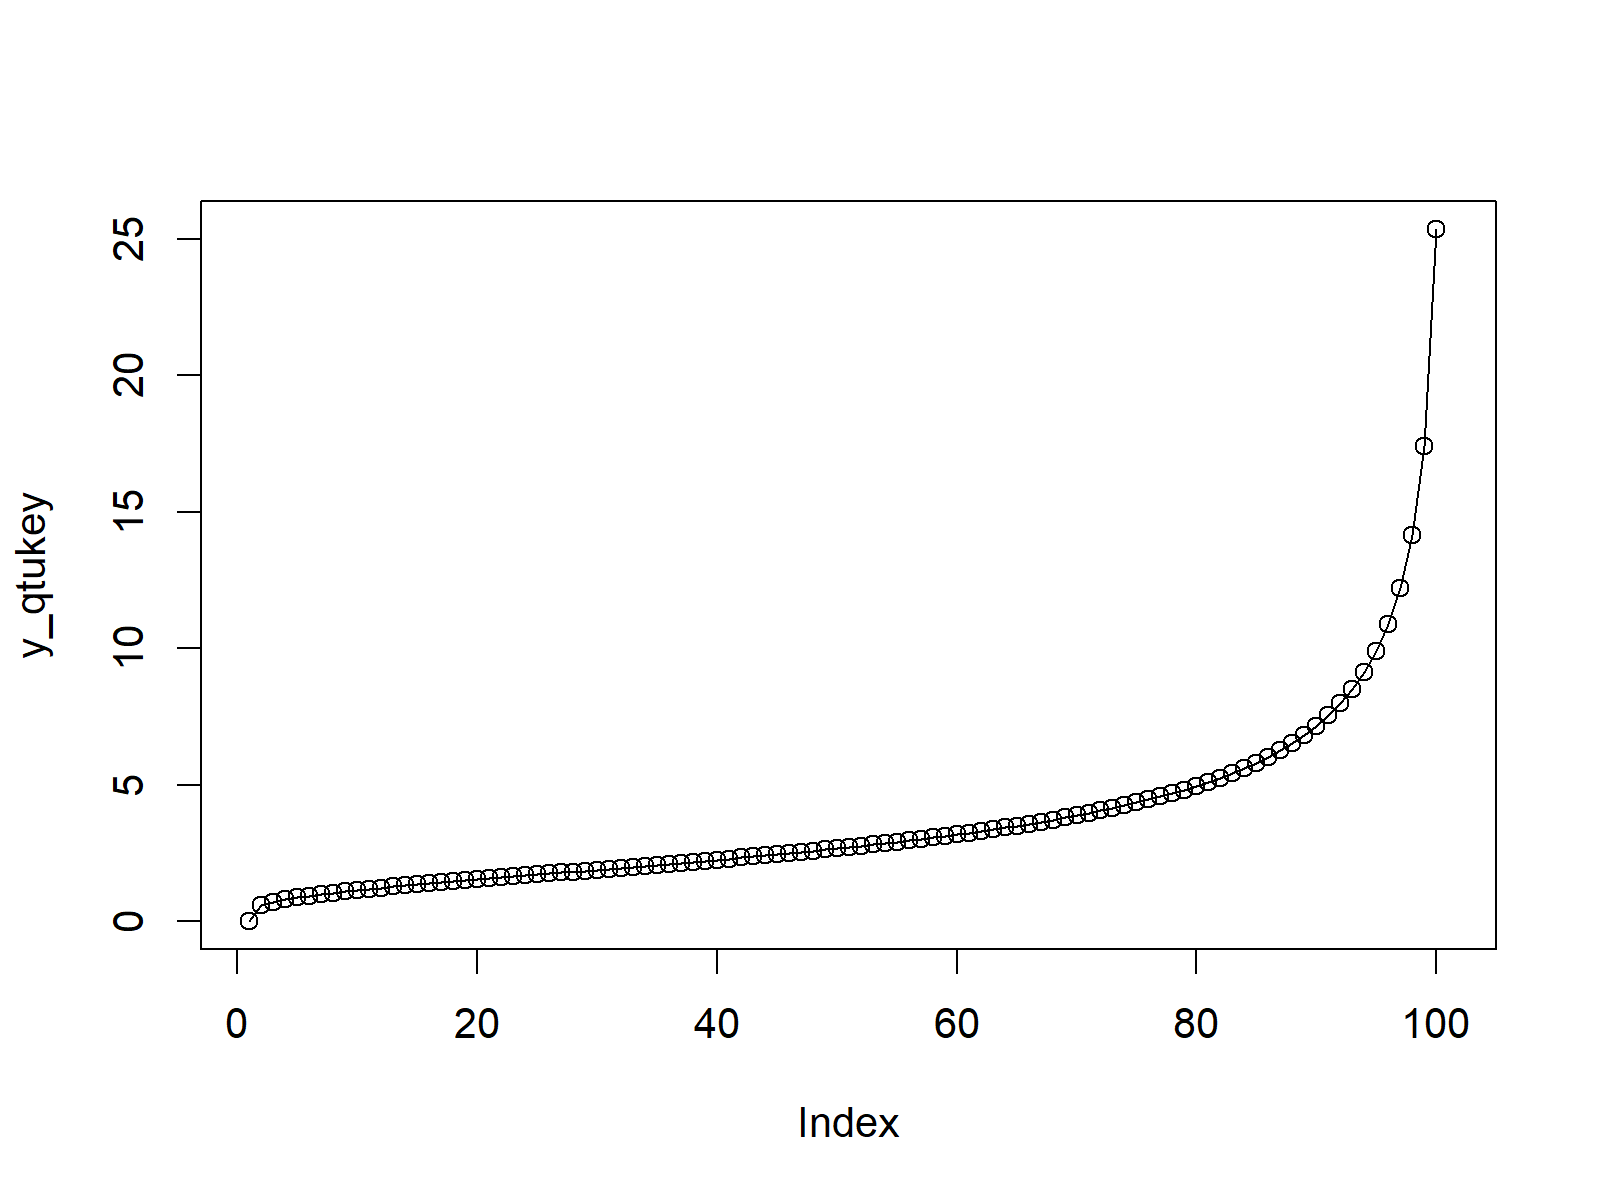
The second example illustrates how to plot the quantile function of the Studentized Range distribution in R:
x_qtukey <- seq(0, 1, by = 0.01)                     # Specify x-values for qtukey function
y_qtukey <- qtukey(x_qtukey, nmeans = 5, df = 2)     # Apply qtukey function
plot(y_qtukey, type = "o")                           # Plot qtukey values

Figure 2: Quantile Function of Studentized Range Distribution in R.
Video & Further Resources
Do you need further explanations on the R codes of this tutorial? Then you might want to have a look at the following video of my YouTube channel. In the video, I show the contents of this article in a live session:
The YouTube video will be added soon.
You might also have a look at the other posts on distributions and the simulation of random numbers in the R programming language:
- Bernoulli Distribution in R
- Beta Distribution in R
- Binomial Distribution in R
- Bivariate & Multivariate Distributions in R
- Cauchy Distribution in R
- Chi-Squred Distribution in R
- Exponential Distribution in R
- F Distribution in R
- Gamma Distribution in R
- Geometric Distribution in R
- Hypergeometric Distribution in R
- Log Normal Distribution in R
- Logistic Distribution in R
- Negative Binomial Distribution in R
- Normal Distribution in R
- Poisson Distribution in R
- Student t Distribution in R
- Studentized Range Distribution in R
- Uniform Distribution in R
- Weibull Distribution in R
- Wilcoxon Signedank Statistic Distribution in R
- Wilcoxonank Sum Statistic Distribution in R
In addition, you may read the related R programming articles of my website.
In summary: This tutorial illustrated how to use the Studentized Range commands in the R programming language. If you have additional questions, don’t hesitate to let me know in the comments section below.


2 Comments. Leave new
How to calculate and plot the probability of excedency and cumulative probability for 30 years annual rainfall data?
Hey Endalew,
For more precise tips, you would have to be more specific about your data.
However, you may have a look at the following tutorials for some hints:
https://statisticsglobe.com/cumulative-frequency-and-probability-table-in-r
https://statisticsglobe.com/draw-multiple-time-series-in-same-plot-in-r
Regards
Joachim