Logistic Distribution in R (4 Examples) | dlogis, plogis, qlogis & rlogis Functions
In this R tutorial you’ll learn how to apply the logistic functions.
The article contains this information:
- Example 1: Logistic Density in R (dlogis Function)
- Example 2: Logistic Cumulative Distribution Function (plogis Function)
- Example 3: Logistic Quantile Function (qlogis Function)
- Example 4: Generating Random Numbers (rlogis Function)
- Video, Further Resources & Summary
Let’s take a look at some R codes in action…
Example 1: Logistic Density in R (dlogis Function)
Let’s start with the density of the logistic distribution in R. First, we have to create a sequence of quantiles:
x_dlogis <- seq(- 10, 10, by = 0.1) # Specify x-values for dlogis function
Then, we can insert these quantiles into the dlogis function as you can see below:
y_dlogis <- dlogis(x_dlogis) # Apply dlogis function
To visualize the output of the dlogis function, we can draw a plot of its output:
plot(y_dlogis) # Plot dlogis values
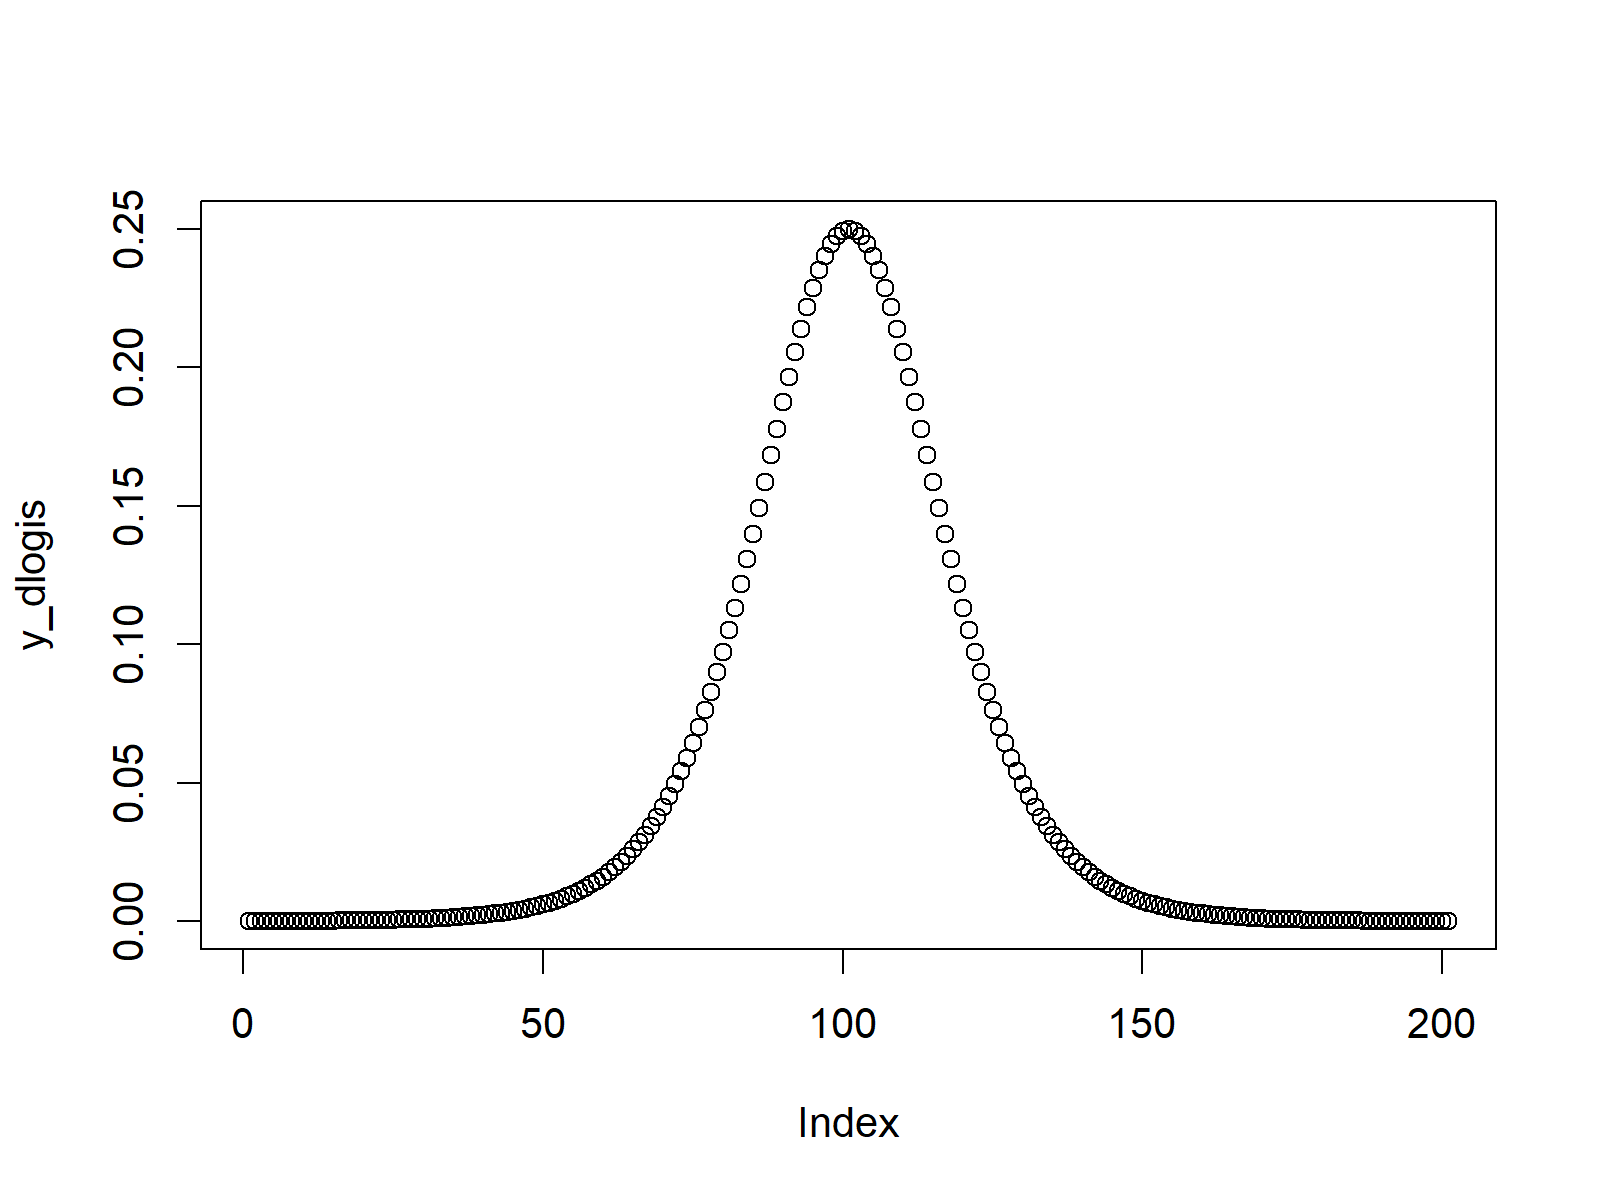
Figure 1: Logistic Probability Density Function (PDF).
Figure 1 shows the logistic probability density function (PDF).
Example 2: Logistic Cumulative Distribution Function (plogis Function)
In Example 2, we’ll create a plot of the logistic cumulative distribution function (CDF) in R. Again, we need to create a sequence of quantiles…
x_plogis <- seq(- 10, 10, by = 0.1) # Specify x-values for plogis function
…that we can use as input for the plogis function:
y_plogis <- plogis(x_plogis) # Apply plogis function
With the plot function, we can illustrate the output of plogis:
plot(y_plogis) # Plot plogis values
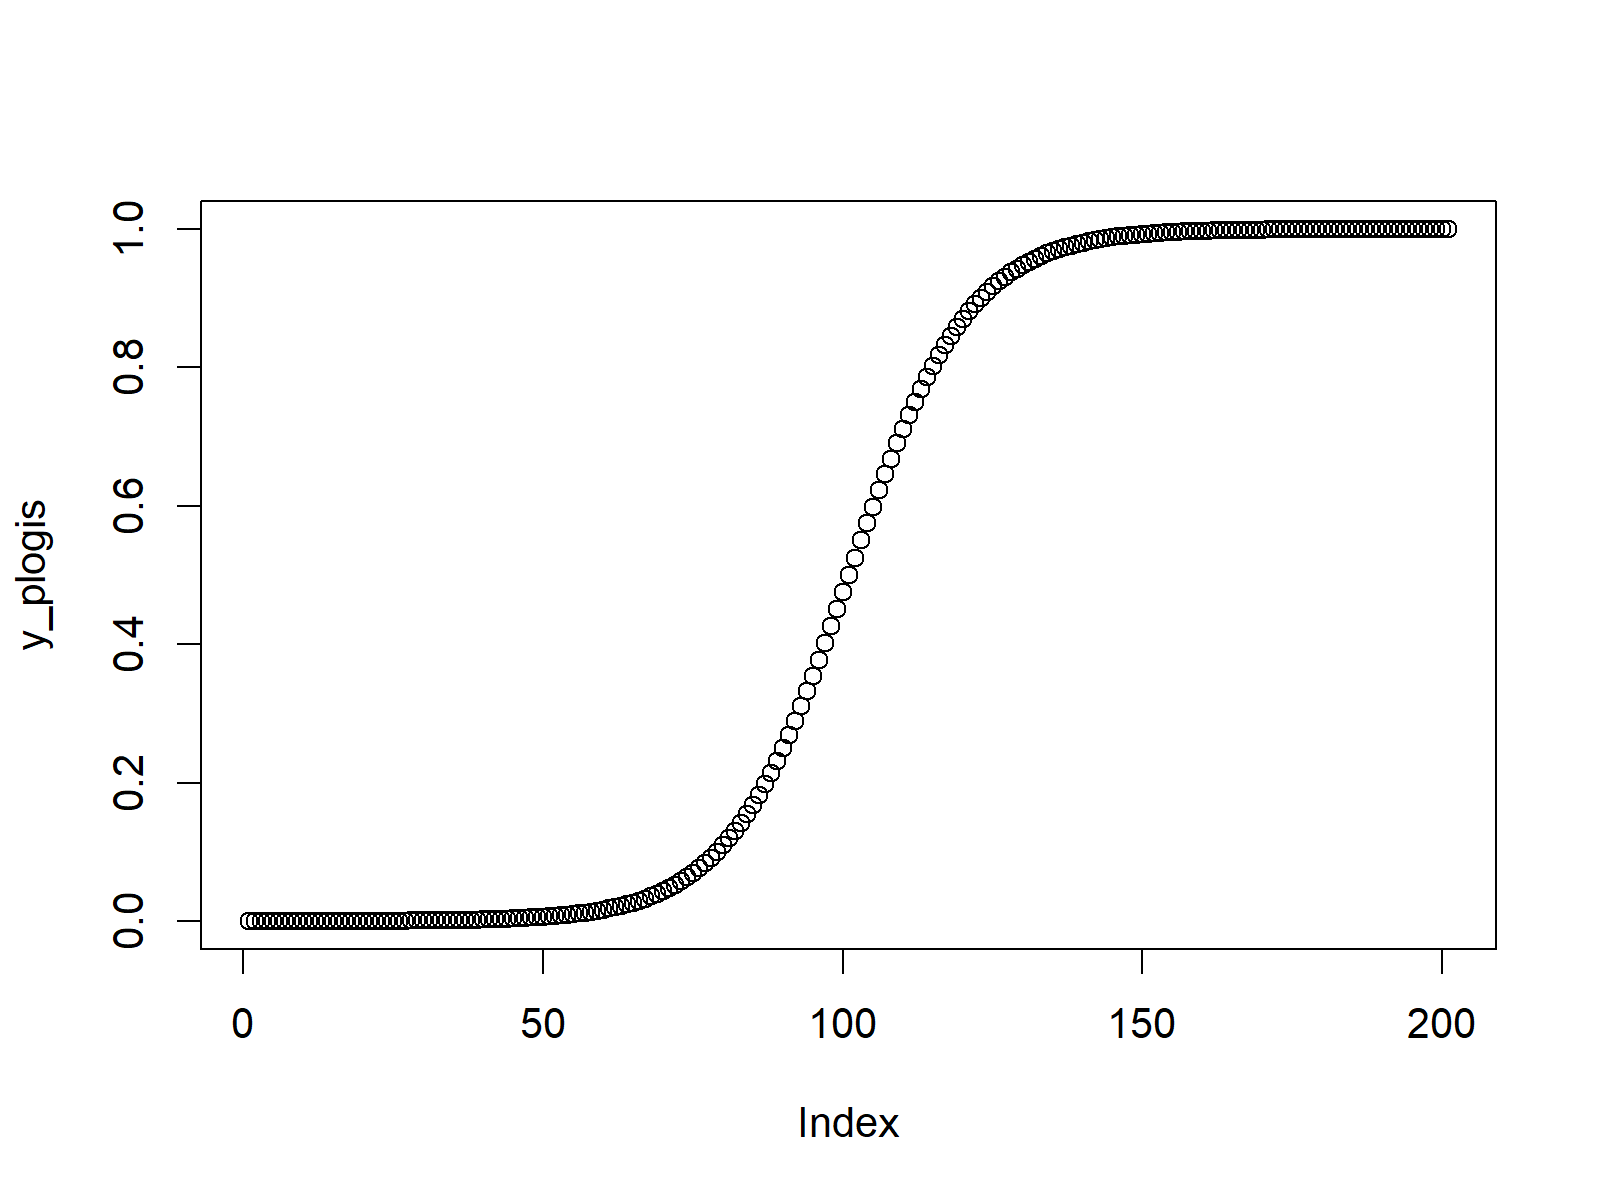
Figure 2: Logistic Cumulative Distribution Function (CDF).
Example 3: Logistic Quantile Function (qlogis Function)
The R programming language also provides a command for the logistic quantile function. This time we need to create a sequence of probabilities as input:
x_qlogis <- seq(0, 1, by = 0.01) # Specify x-values for qlogis function
Now, we can use the qlogis R command to create the logistic quantile function:
y_qlogis <- qlogis(x_qlogis) # Apply qlogis function
As in the previous examples, we can illustrate the output with the plot function:
plot(y_qlogis) # Plot qlogis values
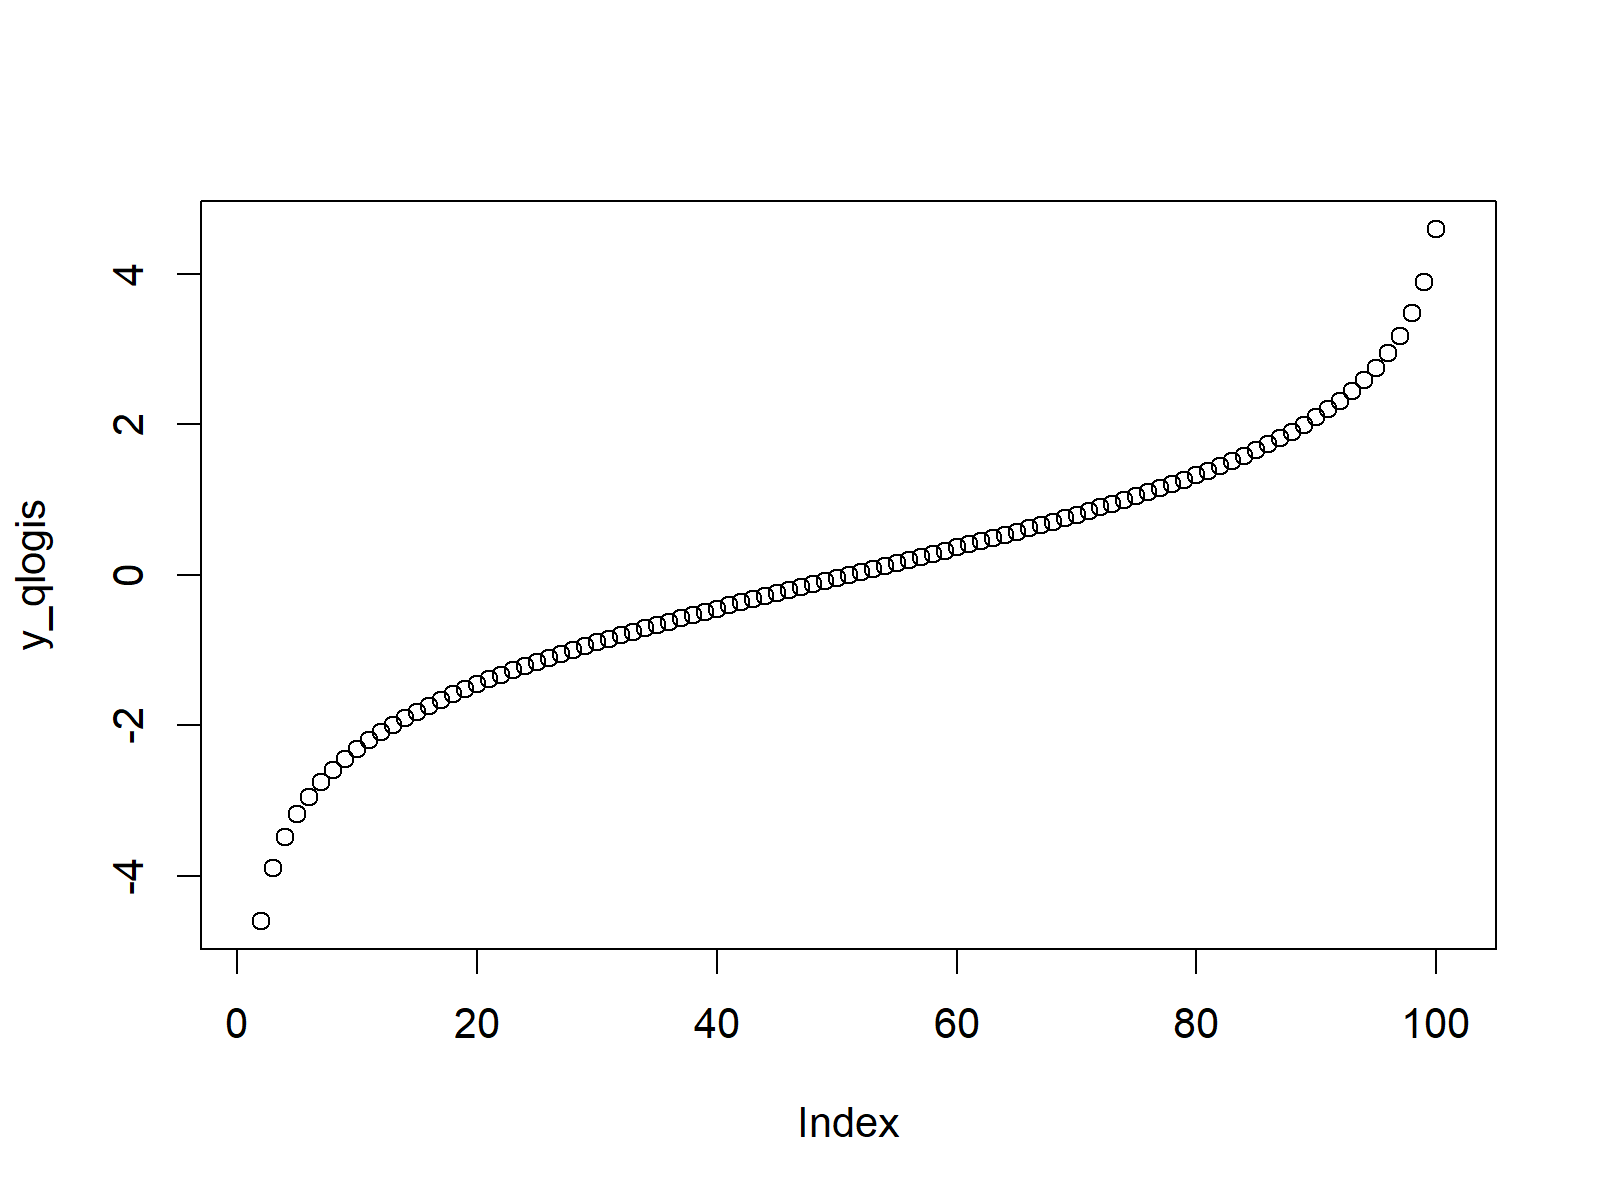
Figure 3: Logistic Quantile Function.
Example 4: Generating Random Numbers (rlogis Function)
We can also generate a set of random numbers with a logistic distribution. First, we need to set a seed for reproducibility and a sample size of random numbers that we want to simulate:
set.seed(91929)                                         # Set seed for reproducibility
N <- 10000                                              # Specify sample size
Now, we can apply the rlogis function to draw a set of random numbers:
y_rlogis <- rlogis(N)                                   # Draw N logistically distributed values
y_rlogis                                                # Print values to RStudio console
# -0.202638116  4.253454975 -0.546483563  1.015626074  0.713380391  1.228554727 -0.469496369  0.574367616...
The following histogram shows the output of rlogis:
hist(y_rlogis,                                          # Plot of randomly drawn logis density
     breaks = 70,
     main = "")
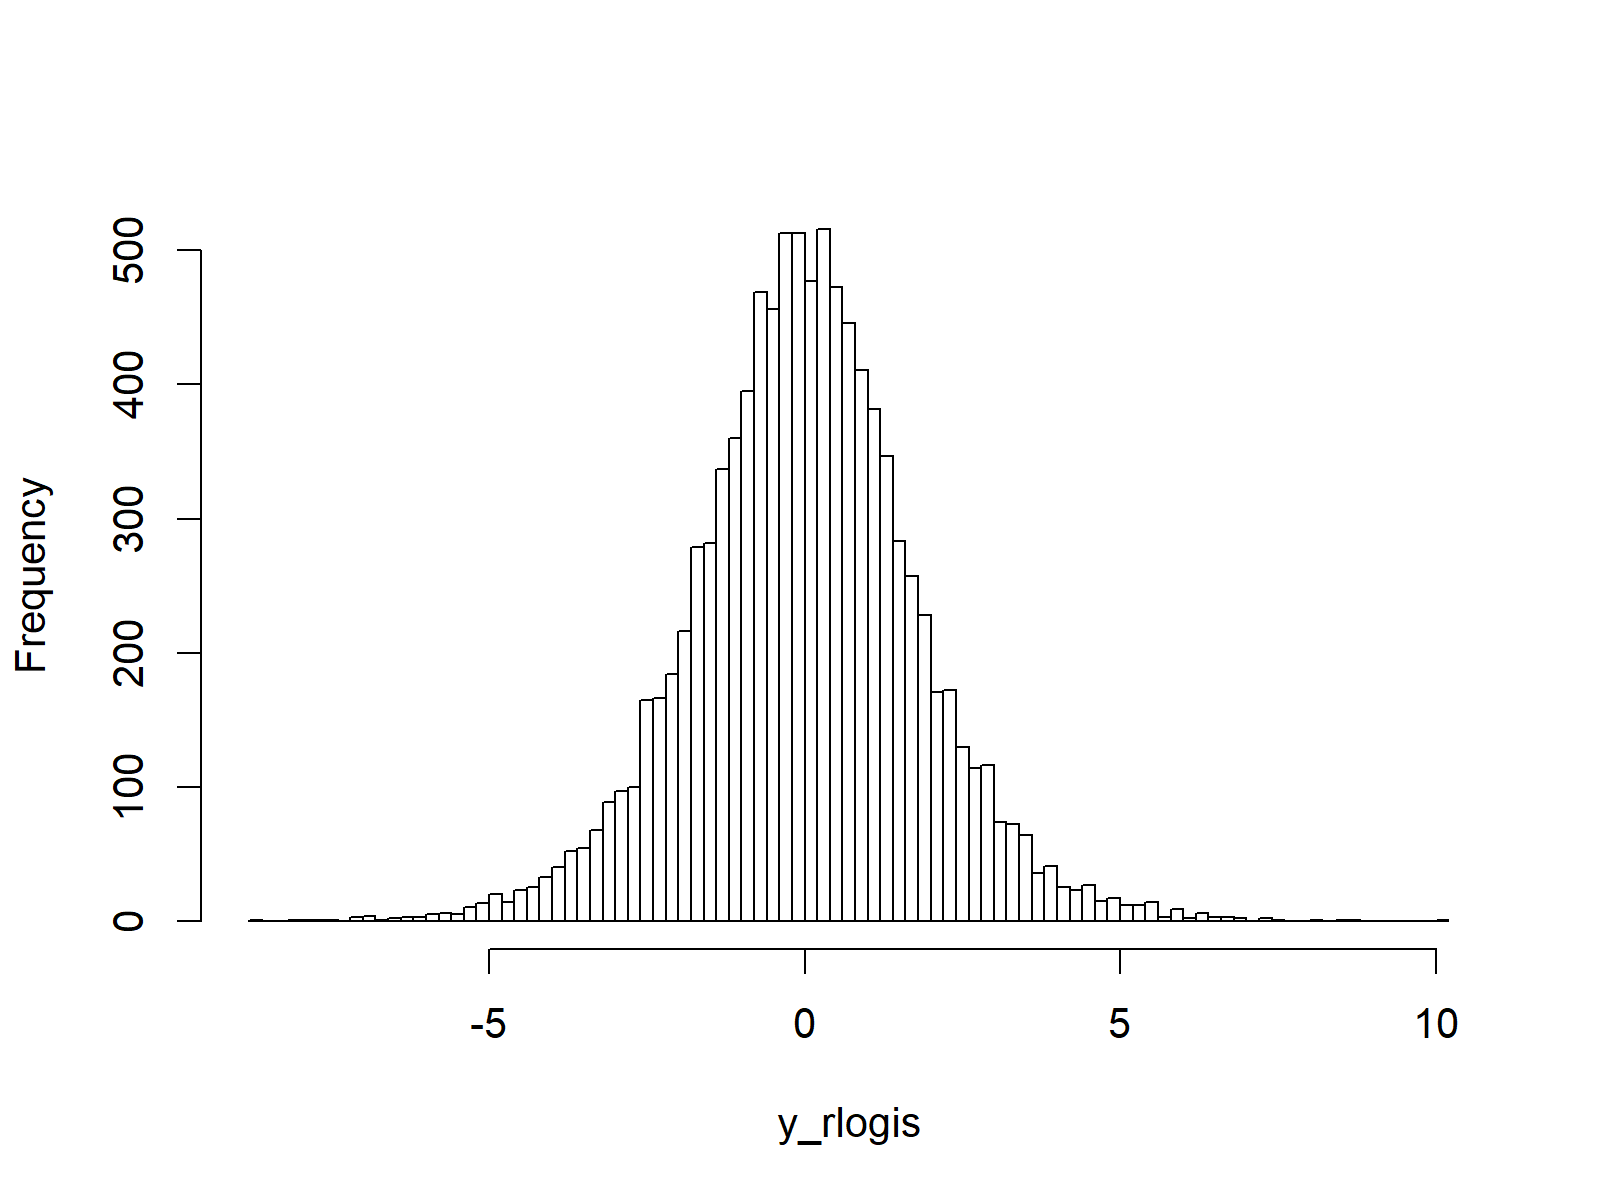
Figure 4: Logistic Random Numbers.
Video, Further Resources & Summary
Would you like to know more about the logistic distribution in R? Then you may want to have a look at the following video of my YouTube channel. In the video instruction, I explain the content of this tutorial in RStudio.
The YouTube video will be added soon.
You could also have a look at the other tutorials on distributions and the simulation of random numbers in R:
- Bernoulli Distribution in R
- Beta Distribution in R
- Binomial Distribution in R
- Bivariate & Multivariate Distributions in R
- Cauchy Distribution in R
- Chi-Squred Distribution in R
- Exponential Distribution in R
- F Distribution in R
- Gamma Distribution in R
- Geometric Distribution in R
- Hypergeometric Distribution in R
- Log Normal Distribution in R
- Logistic Distribution in R
- Negative Binomial Distribution in R
- Normal Distribution in R
- Poisson Distribution in R
- Student t Distribution in R
- Studentized Range Distribution in R
- Uniform Distribution in R
- Weibull Distribution in R
- Wilcoxon Signedank Statistic Distribution in R
- Wilcoxonank Sum Statistic Distribution in R
Besides the video, you could have a look at the related tutorials on this website. A selection of tutorials is listed here:
To summarize: At this point you should know how to draw and simulate a logistic distribution in the R programming language. In case you have further comments and/or questions, tell me about it in the comments section.


