Calculate Skewness & Kurtosis in R (2 Examples)
This article explains how to compute skewness and kurtosis (also called the 3rd and 4th moments) in R programming.
The post consists of the following content:
Here’s the step-by-step process:
Example 1: Compute Skewness & Kurtosis of Normal Distribution
This example shows how to get the skewness and kurtosis of a probability distribution using the R programming language.
As first step, we have to create some example data:
set.seed(3548148)                           # Set seed for reproducibility
x_norm <- rnorm(5000)                       # Generate normally distributed random sample
head(x_norm)                                # Print first six values
# [1] -1.0522698  2.0653529  1.1777100  1.3292764 -0.7542776 -0.4872704
As you can see based on the previous output, our example data is a vector of numeric values.
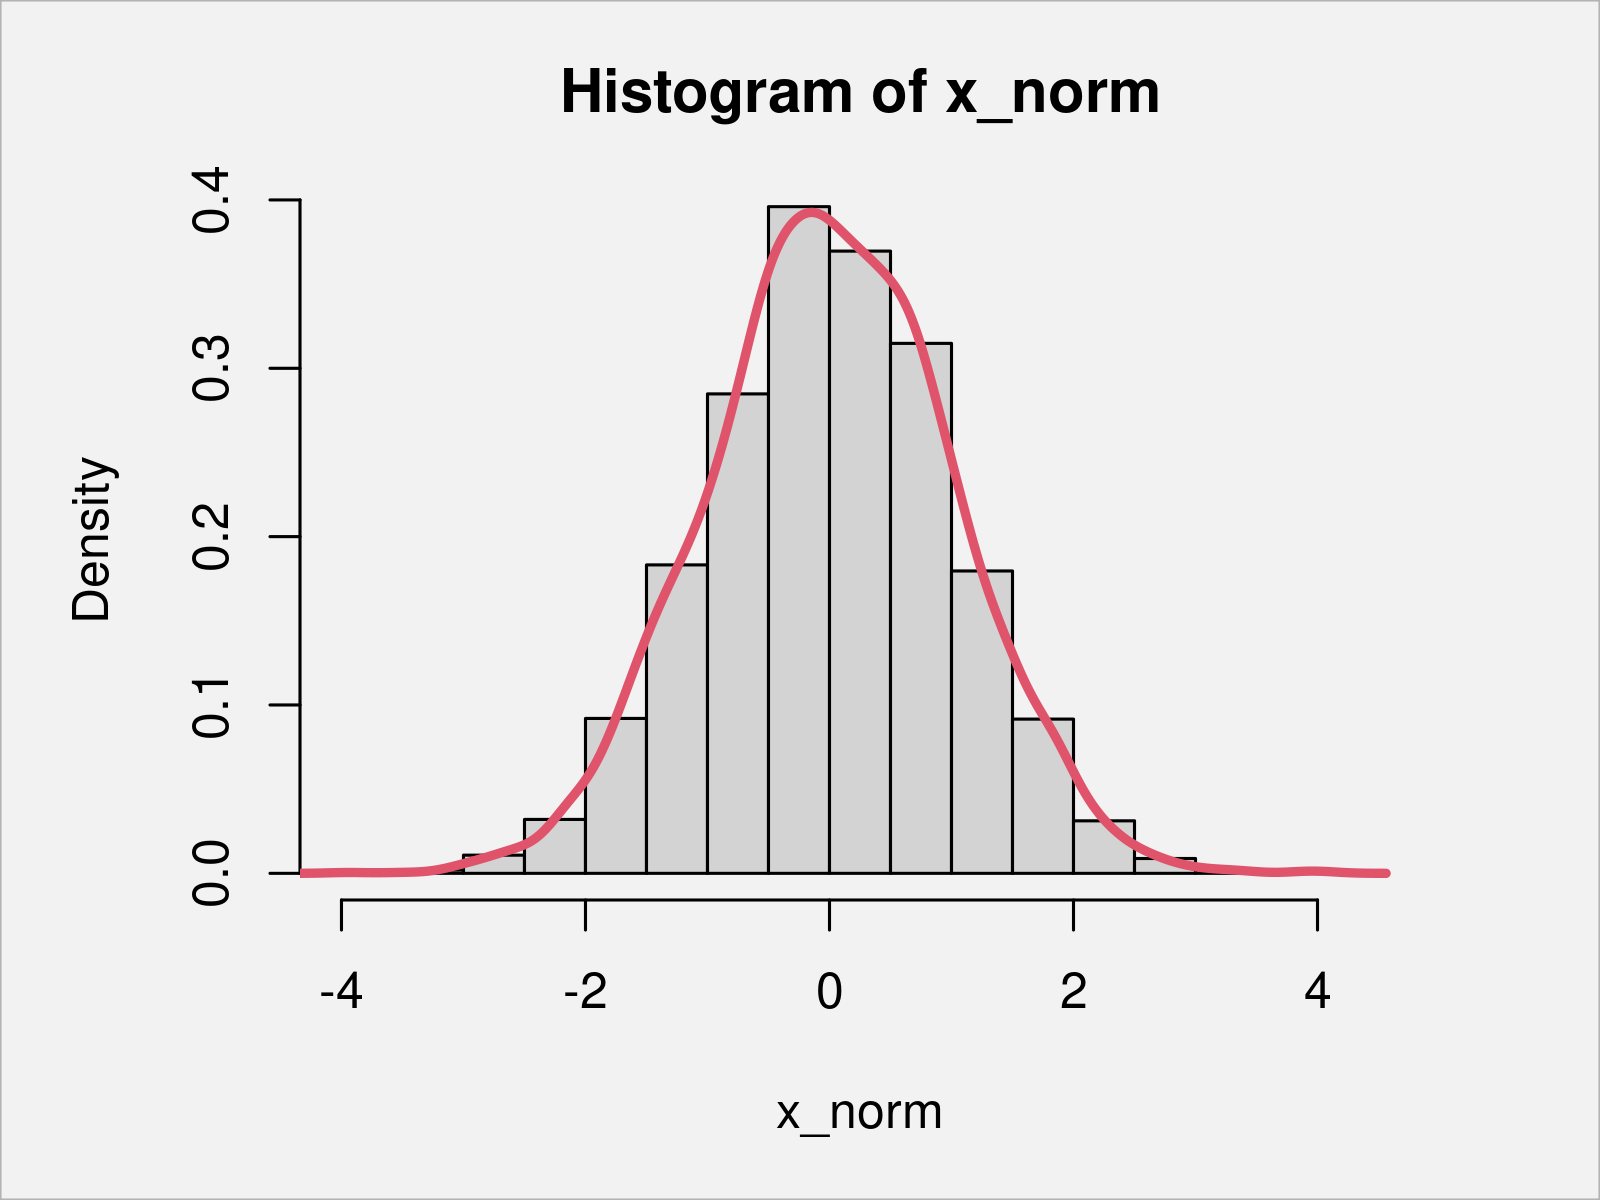
Let’s draw these data in a combined histogram and density plot to see the shape of our distribution:
hist(x_norm, prob = TRUE)                   # Draw histogram with density
lines(density(x_norm), col = 2, lwd = 3)
# [1] 1.120532e+02 3.998455e-03 2.162798e-05 1.364134e-13 2.756435e+05
# [6] 2.627235e-12

As shown in Figure 1, the previous R syntax has plotted a histogram with an overlaid density. Based on this graphic, we can assume that our data is normally distributed – however, this is just a visual representation of our data.
One condition of a normal distribution is that it has certain values for the skewness (i.e. 0) and the kurtosis (i.e. 3).
To measure these metrics, we can use the moments package.
We first need to install and load the moments package, in order to apply the functions that are included in the package:
install.packages("moments")                 # Install moments package
library("moments")                          # Load moments
Next, we can apply the skewness function to measure any asymmetric leaning to the left or to the right…
skewness(x_norm)                            # Calculate skewness
# [1] 0.0009433768
…and the kurtosis function to measure the degree of tailedness of the probability distribution:
kurtosis(x_norm)                            # Calculate kurtosis
# [1] 3.043427
The RStudio console returns our results: Our data vector has a skewness close to zero and a kurtosis close to three. An additional indication that our data is normally distributed.
Example 2: Compute Skewness & Kurtosis of Weibull Distribution
The skewness and kurtosis of a numerical vector can also be measured for data that is not normally distributed at all.
Example 2 explains how to get the second and third moment of a weibull distribution.
First, we have to create some example data:
set.seed(3286764)                           # Set seed for reproducibility
x_weibull <- rweibull(5000, shape = 0.1)    # Generate random weibull distribution
head(x_weibull)                             # Print first six values
# [1] 1.120532e+02 3.998455e-03 2.162798e-05 1.364134e-13 2.756435e+05 2.627235e-12
Then, we can apply the skewness…
skewness(x_weibull)                         # Calculate skewness
# [1] 38.78156
…and kurtosis functions as we already did in Example 1:
kurtosis(x_weibull)                         # Calculate kurtosis
# [1] 1712.528
However, this time the results are clearly indicating that our data is not normally distributed.
Video & Further Resources
Would you like to learn more about the computation of the skewness and kurtosis? Then you could watch the following video instruction on my YouTube channel. I’m explaining the examples of this post in the video:
In addition to the video, you could read some of the related posts that I have published on this website.
To summarize: At this point you should know how to calculate skewness and oblateness in R programming. If you have further questions, let me know in the comments below.


6 Comments. Leave new
Kurtosis does not measure peakedness at all. It only measures tail weight.
Wow, shame on me for this mistake. You are absolutely right, and I have just corrected this mistake in the text!
Thanks a lot for pointing on this Peter!
Regards
Joachim
Excellent work again.
My version is 4.1.3. install. Packages(“moments”) do not work in my rstudio. What version is required to install this package? and how to do it.
Hello Saima,
Thank you for your kind words. It is usually told in the error you get when installing the package. Can you share what is written?
Regards,
Cansu
Dear Cansu,
Thanks for your reply. I installed the package and found skewness and kurtosis.
Hello Saima,
I am glad that it could be fixed.
Regards,
Cansu