Wilcoxon Signedank Statistic Distribution in R (4 Examples) | dsignrank, psignrank, qsignrank & rsignrank Functions
In this tutorial, I’ll show how to use the functions of the Wilcoxon Signedank Statistic in the R programming language.
Table of contents:
- Example 1: Wilcoxon Signedank Statistic Probability Density Function (dsignrank Function)
- Example 2: Wilcoxon Signedank Statistic Cumulative Distribution Function (psignrank Function)
- Example 3: Wilcoxon Signedank Statistic Quantile Function (qsignrank Function)
- Example 4: Generating Random Numbers (rsignrank Function)
- Video, Further Resources & Summary
So without further additions, here’s the step-by-step process…
Example 1: Wilcoxon Signedank Statistic Probability Density Function (dsignrank Function)
This example shows how to draw a plot of the probability density function (PDF) of the Wilcoxon Signedank Statistic:
x_dsignrank <- seq(0, 100, by = 1)                       # Specify x-values for dsignrank function
y_dsignrank <- dsignrank(x_dsignrank, n = 20)            # Apply dsignrank function
plot(y_dsignrank, type = "o")                            # Plot dsignrank values
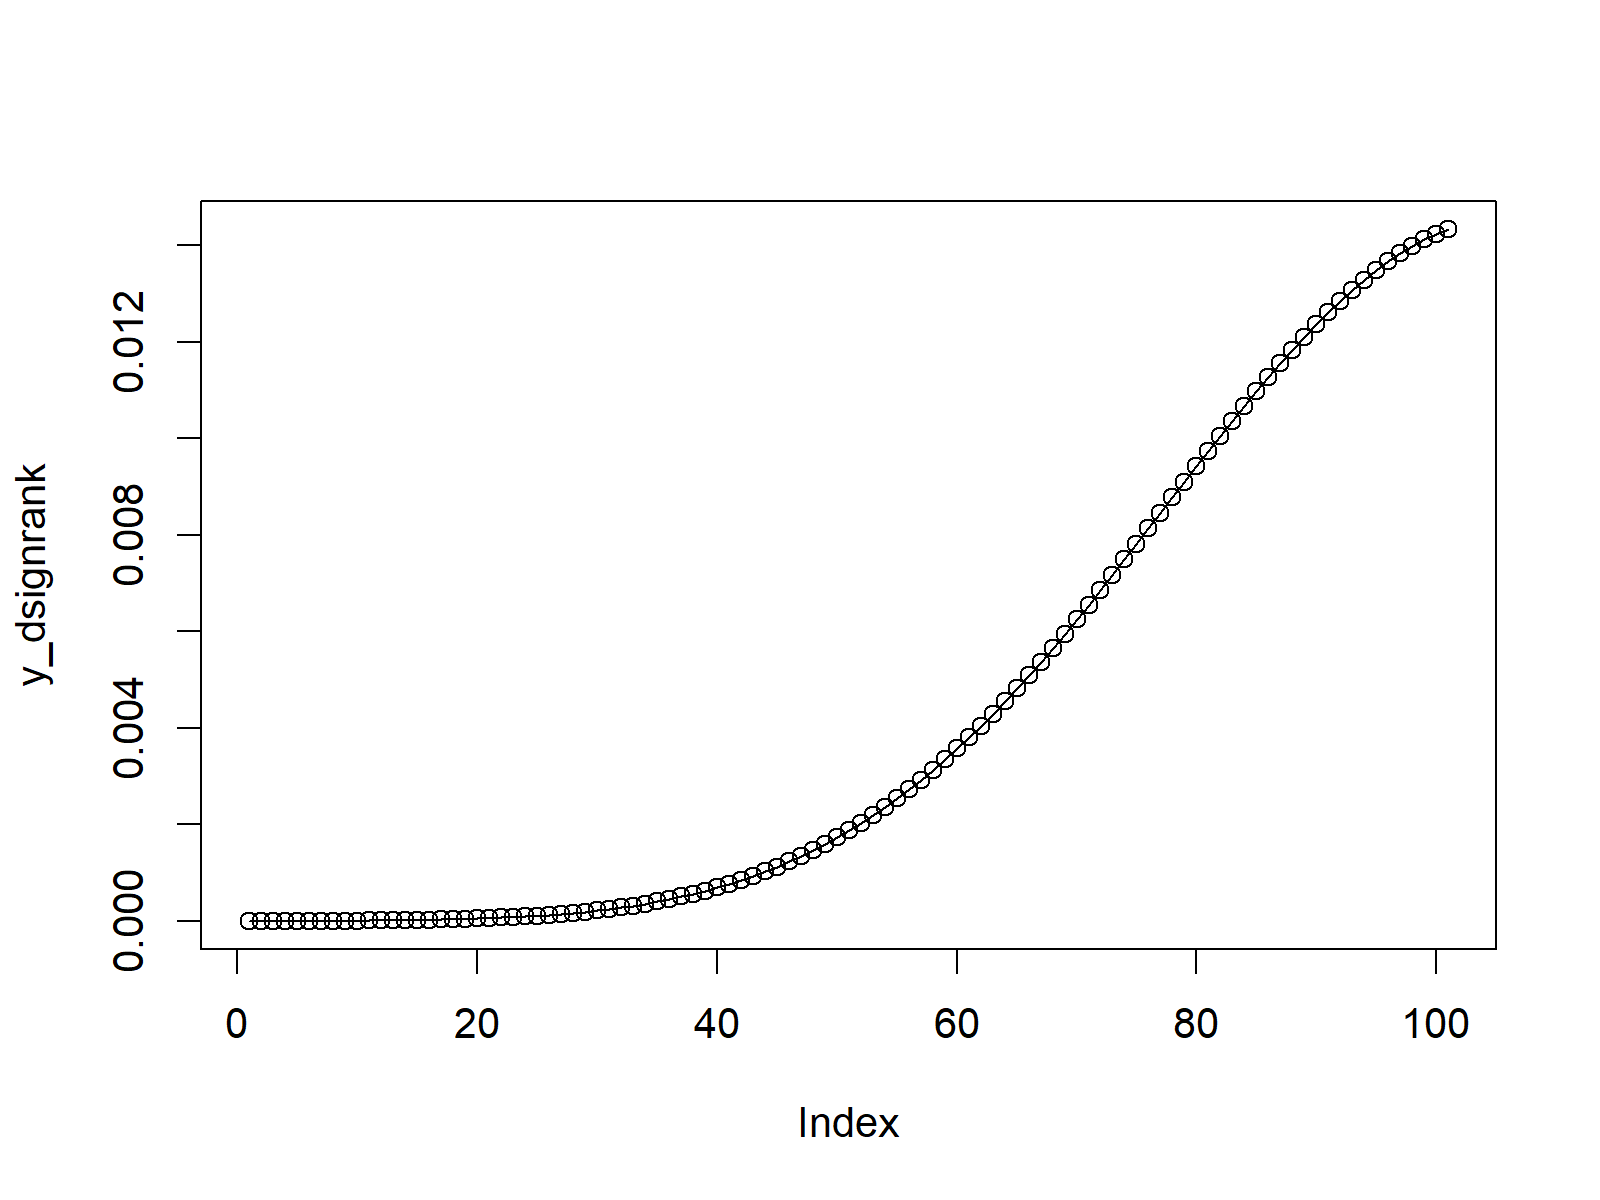
Figure 1: Wilcoxon Signedank Statistic Probability Density Function.
Example 2: Wilcoxon Signedank Statistic Cumulative Distribution Function (psignrank Function)
This example explains how to create a plot of the cumulative distribution function (CDF) of the Wilcoxon Signedank Statistic:
x_psignrank <- seq(0, 100, by = 1)                       # Specify x-values for psignrank function
y_psignrank <- psignrank(x_psignrank, n = 20)            # Apply psignrank function
plot(y_psignrank, type = "o")                            # Plot psignrank values
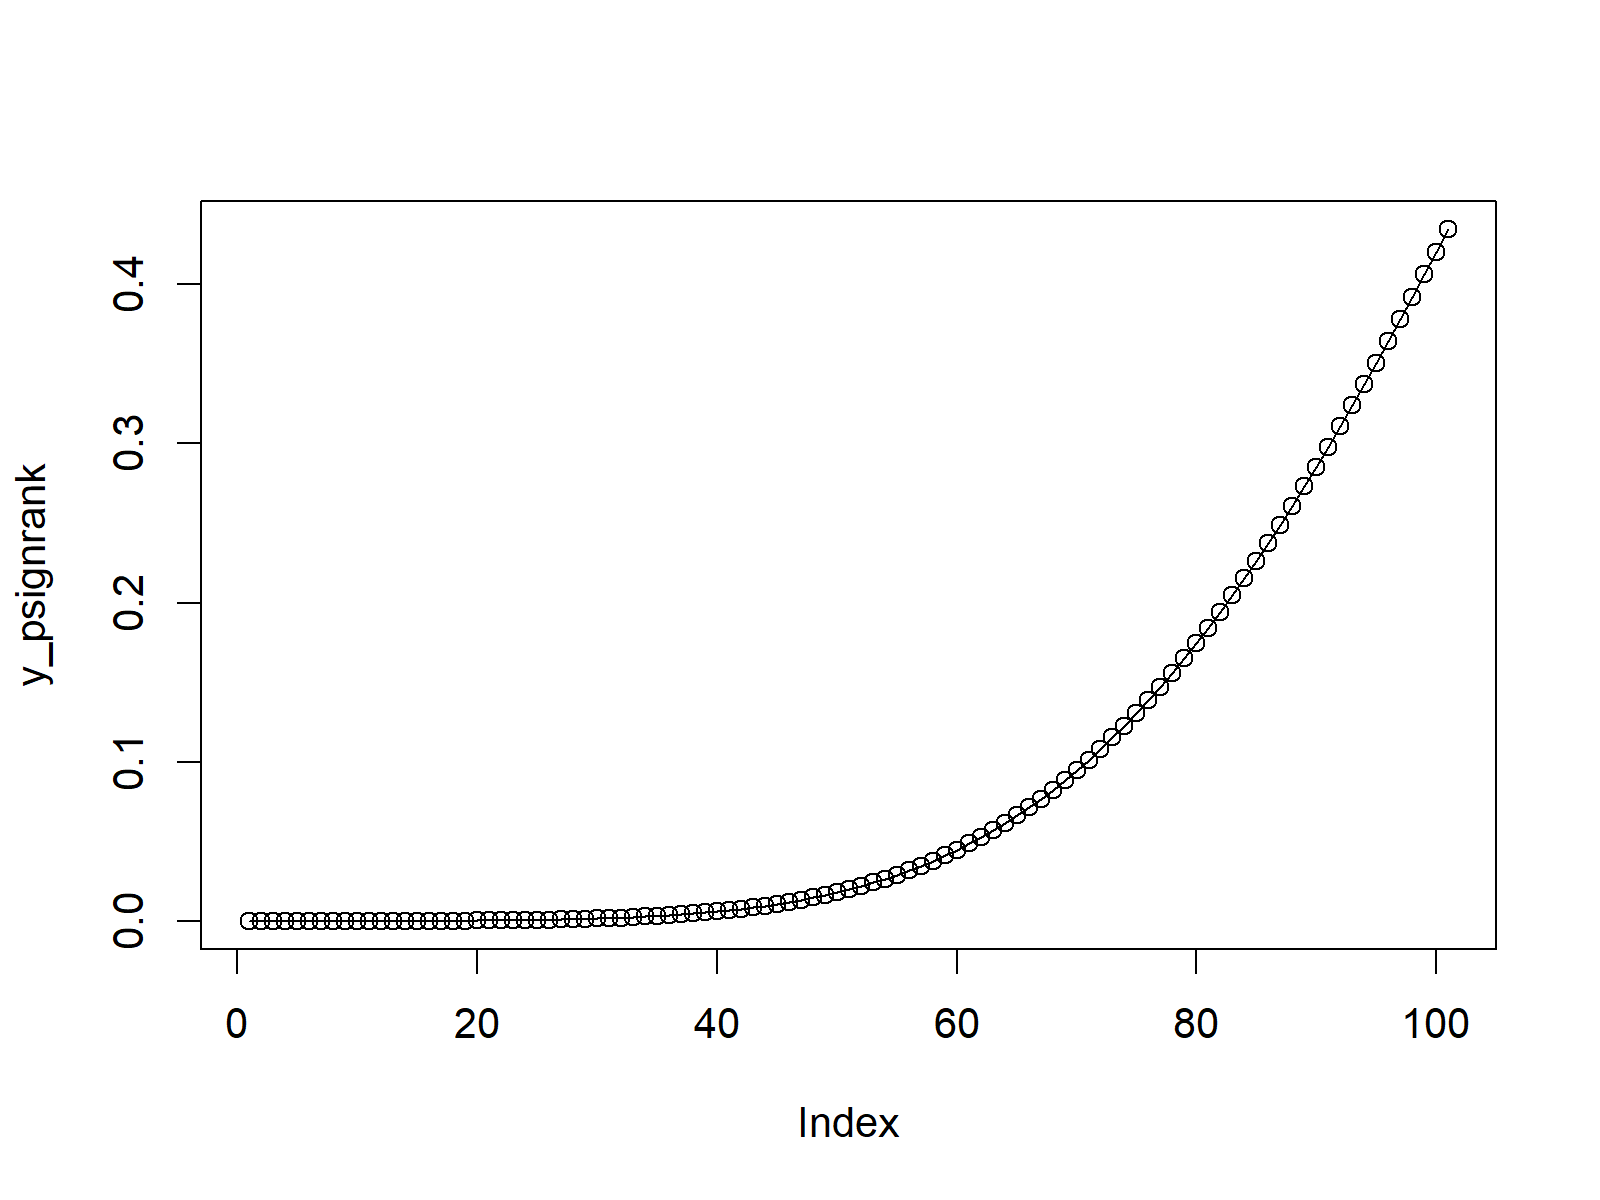
Figure 2: Wilcoxon Signedank Statistic Cumulative Distribution Function.
Example 3: Wilcoxon Signedank Statistic Quantile Function (qsignrank Function)
The third example explains how to plot a graph of the quantile function of the Wilcoxon Signedank Statistic:
x_qsignrank <- seq(0, 1, by = 0.01)                      # Specify x-values for qsignrank function
y_qsignrank <- qsignrank(x_qsignrank, n = 20)            # Apply qsignrank function
plot(y_qsignrank, type = "o")                            # Plot qsignrank values
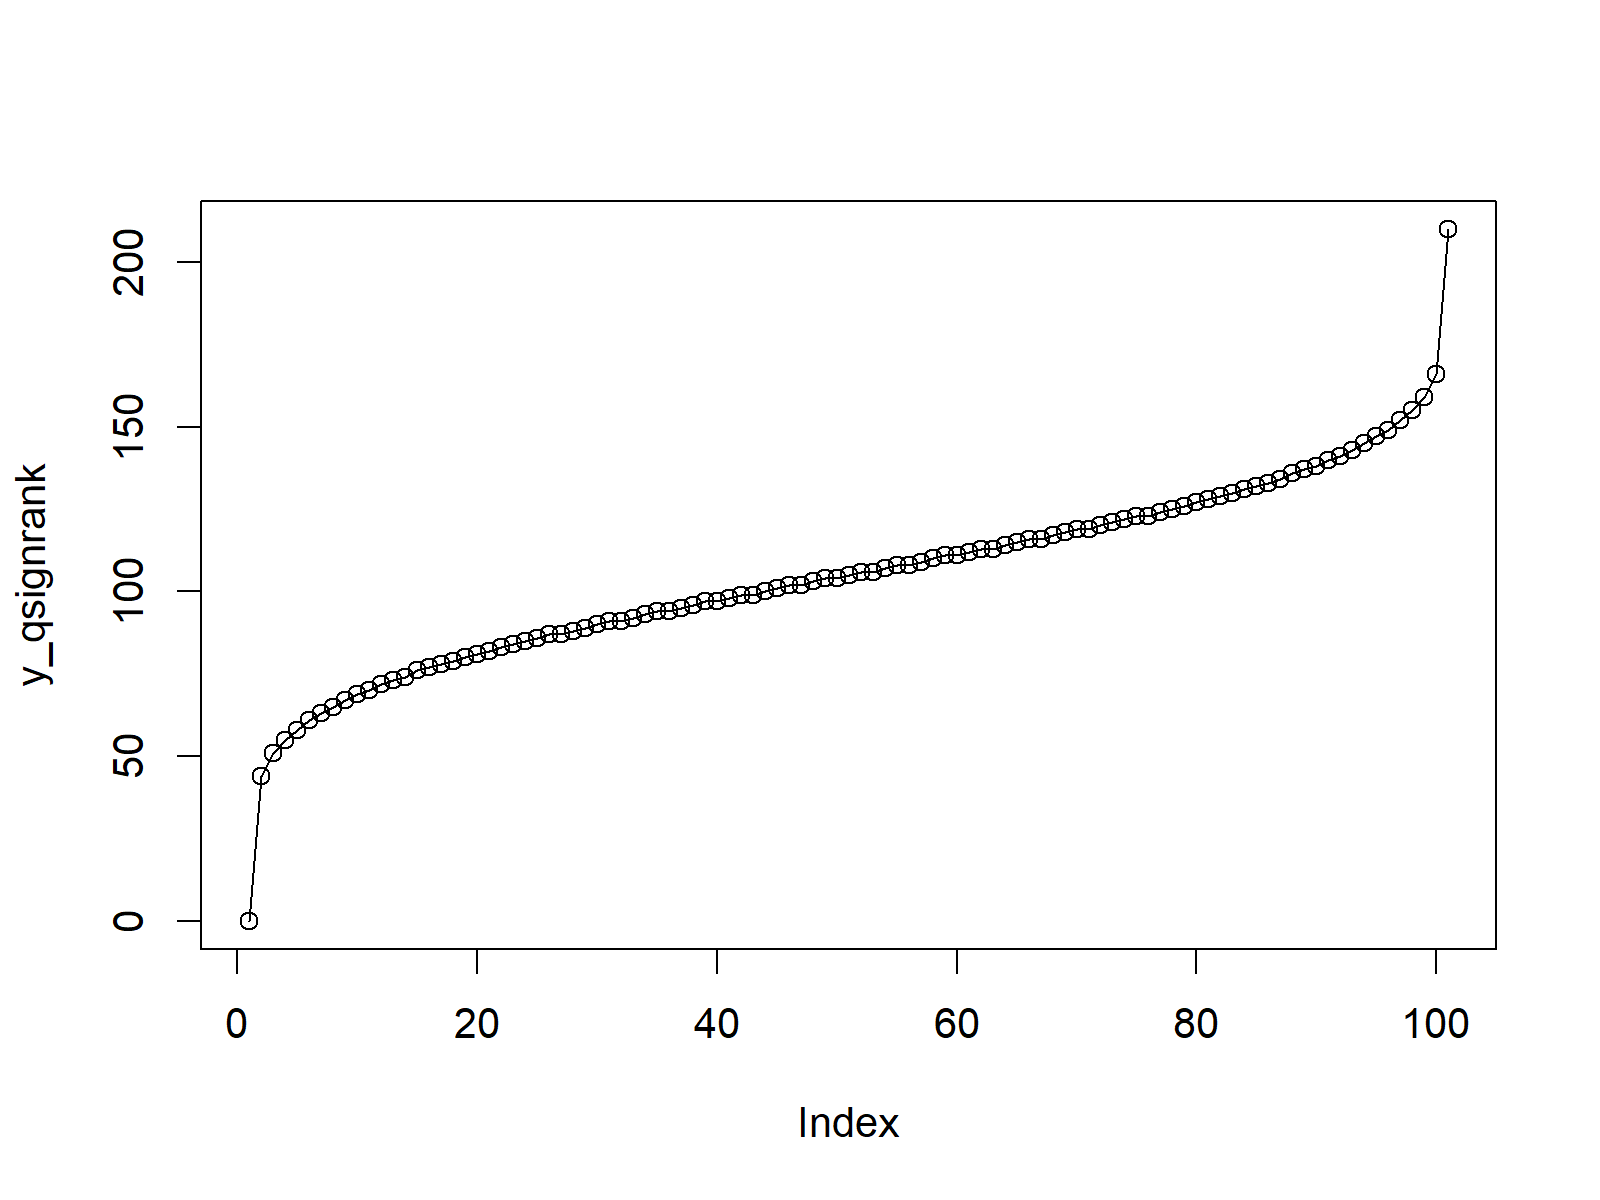
Figure 3: Wilcoxon Signedank Statistic Quantile Function.
Example 4: Generating Random Numbers (rsignrank Function)
Example 4 illustrates how to generate a set of random numbers with the distribution of the Wilcoxon Signedank Statistic:
set.seed(98989)                                          # Set seed for reproducibility
N <- 100000                                              # Specify sample size
y_rsignrank <- rsignrank(N, n = 20)                      # Draw N random values
y_rsignrank                                              # Print values to RStudio console
hist(y_rsignrank,                                        # Plot of randomly drawn density
     breaks = 50,
     main = "")
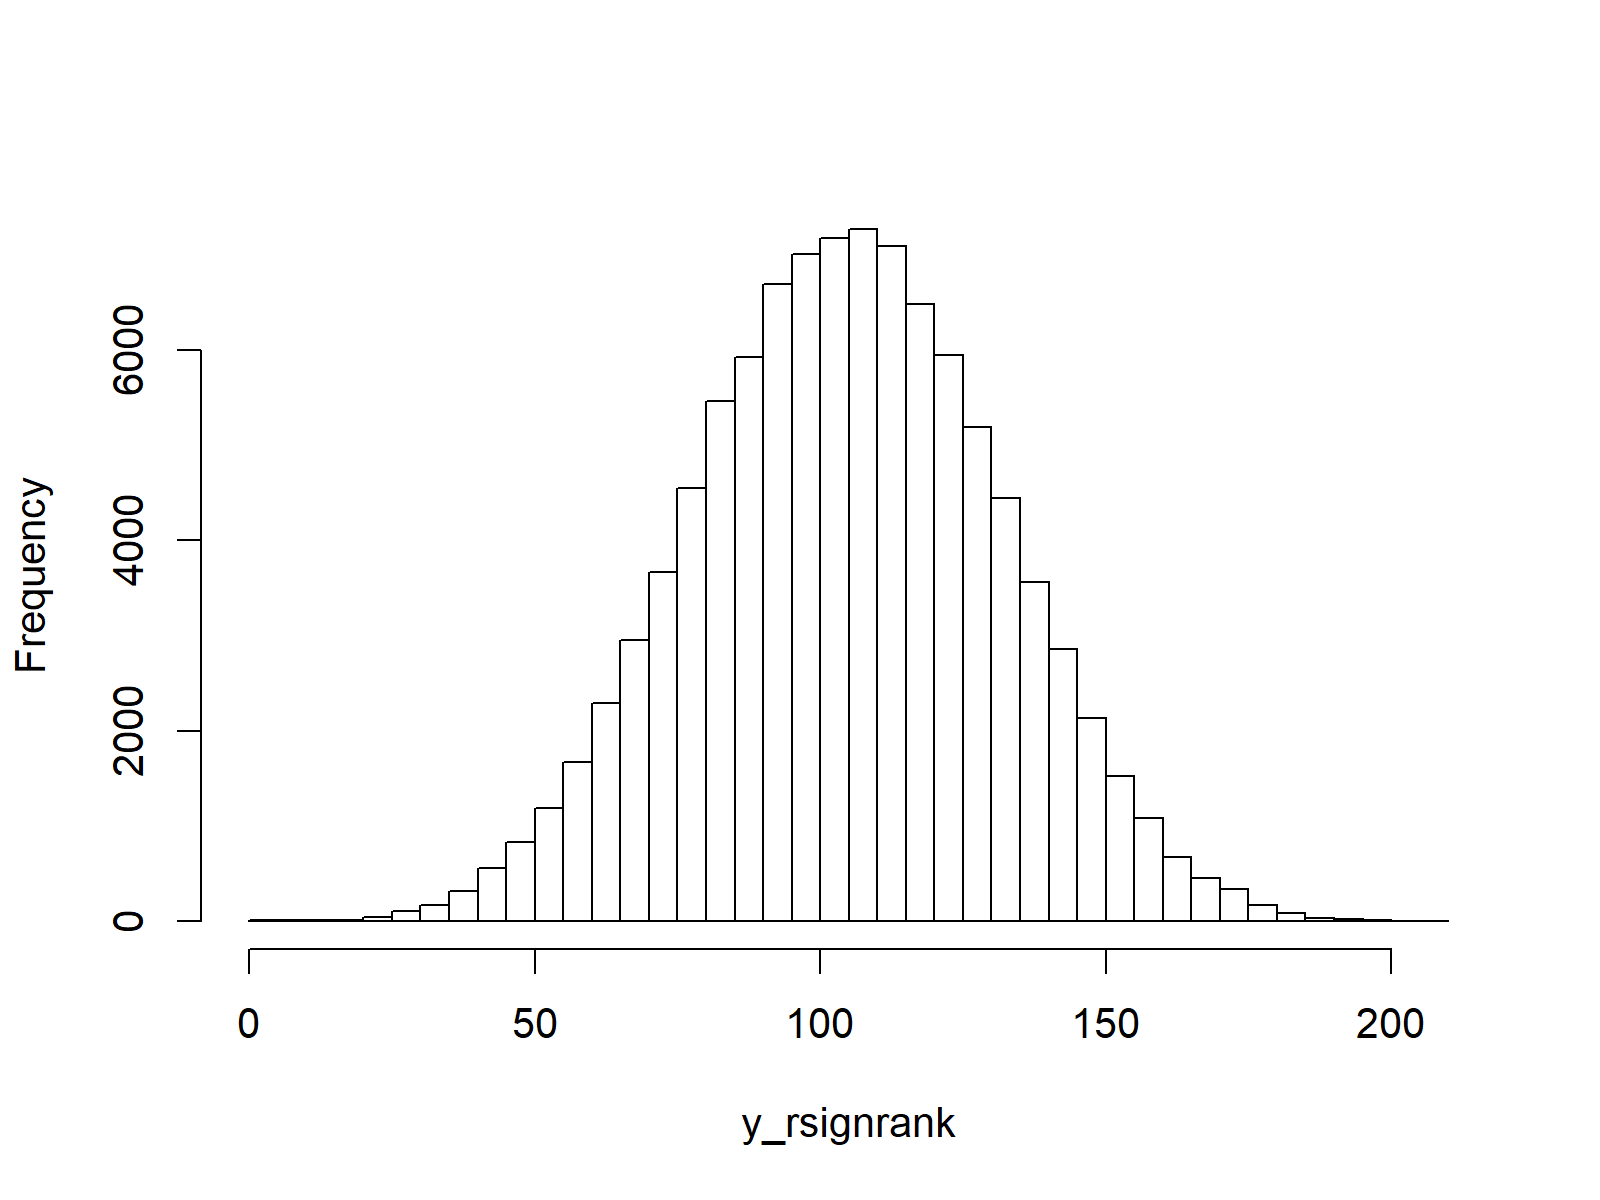
Figure 4: Random Numbers Distributed According to Wilcoxon Signedank Statistic.
Video, Further Resources & Summary
Have a look at the following video of my YouTube channel. I show the R codes of this post in the video:
The YouTube video will be added soon.
You may also have a look at the other articles on probability distributions and the simulation of random numbers in R:
- Bernoulli Distribution in R
- Beta Distribution in R
- Binomial Distribution in R
- Bivariate & Multivariate Distributions in R
- Cauchy Distribution in R
- Chi-Squred Distribution in R
- Exponential Distribution in R
- F Distribution in R
- Gamma Distribution in R
- Geometric Distribution in R
- Hypergeometric Distribution in R
- Log Normal Distribution in R
- Logistic Distribution in R
- Negative Binomial Distribution in R
- Normal Distribution in R
- Poisson Distribution in R
- Student t Distribution in R
- Studentized Range Distribution in R
- Uniform Distribution in R
- Weibull Distribution in R
- Wilcoxon Signedank Statistic Distribution in R
- Wilcoxonank Sum Statistic Distribution in R
In addition, I can recommend to read some of the other R programming articles of this website. I have released numerous related tutorials already.
You learned in this article how to apply the dsignrank, psignrank, qsignrank, and rsignrank commands in the R programming language. Don’t hesitate to let me know in the comments, if you have any additional questions.


