Poisson Distribution in R (4 Examples) | dpois, ppois, qpois & rpois Functions
In this R tutorial you’ll learn how to use the poisson functions.
The content is structured as follows:
- Example 1: Poisson Density in R (dpois Function)
- Example 2: Poisson Distribution Function (ppois Function)
- Example 3: Poisson Quantile Function (qpois Function)
- Example 4: Random Number Generation (rpois Function)
- Video & Further Resources
Let’s get started…
Example 1: Poisson Density in R (dpois Function)
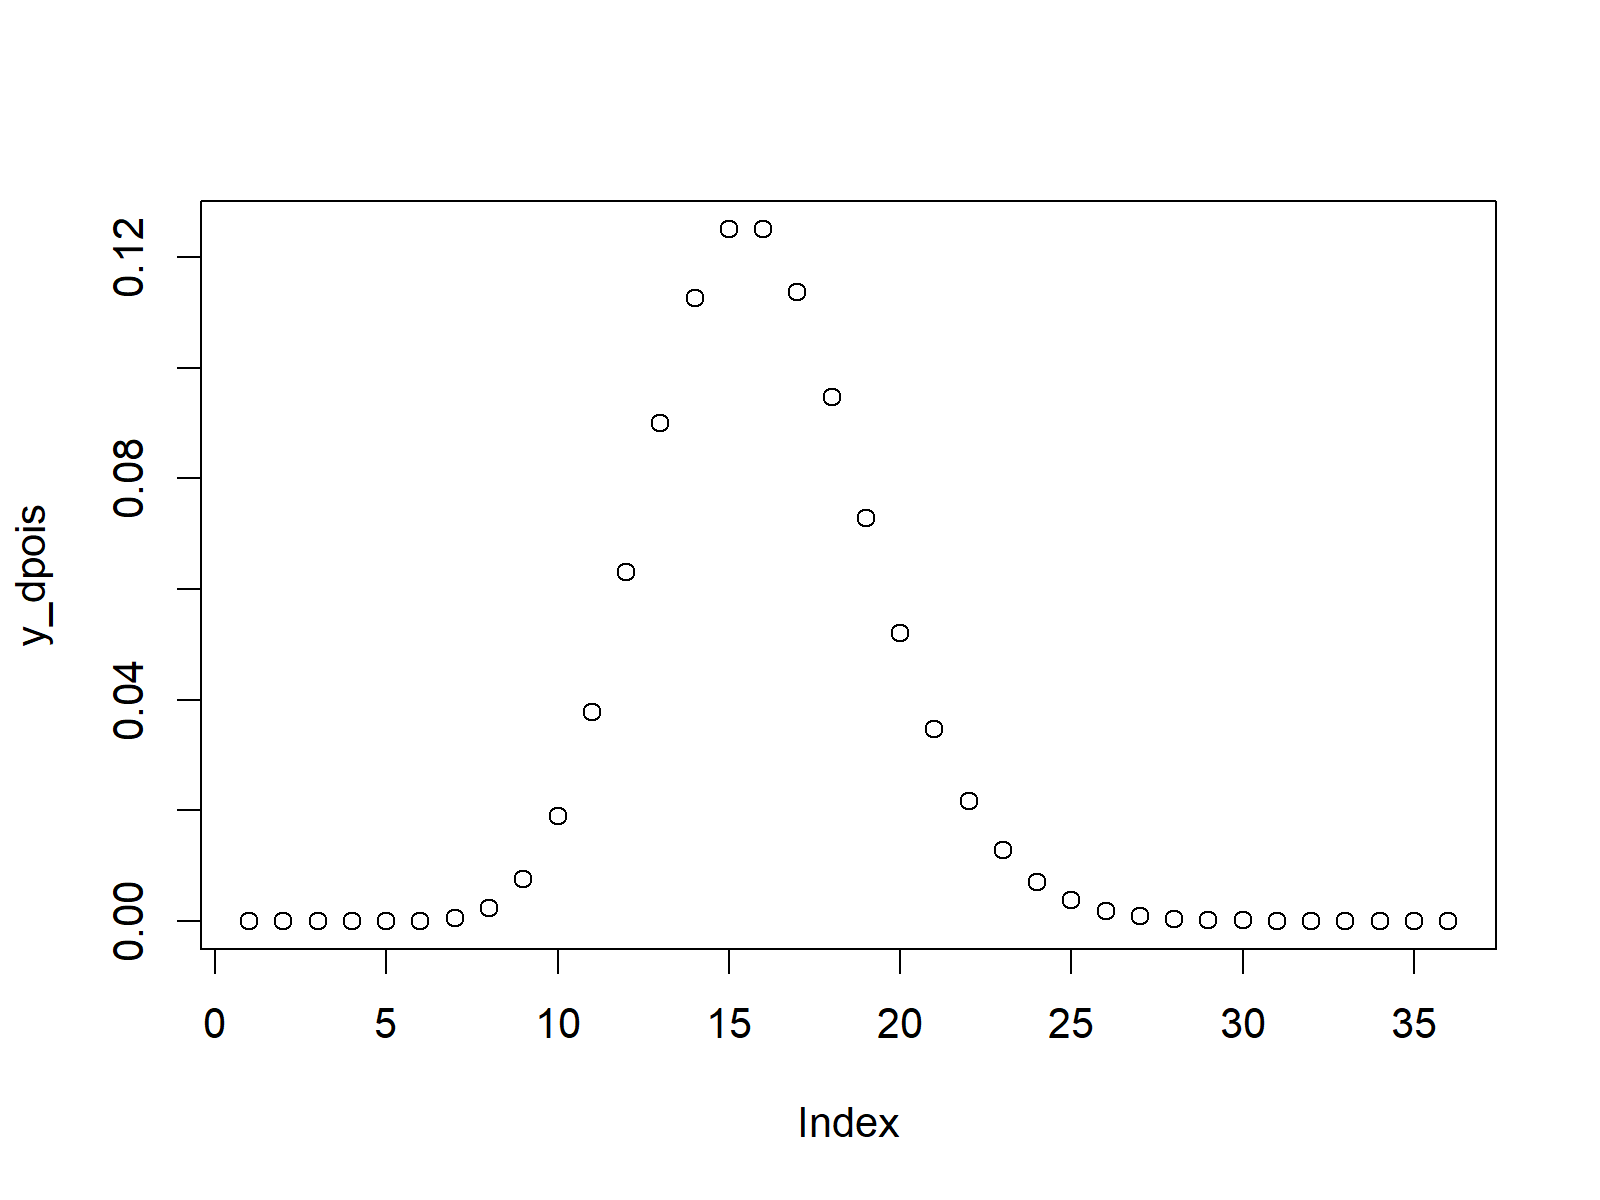
This example shows the poisson density illustrated in an R plot.
In order to create a poisson density in R, we first need to create a sequence of integer values:
x_dpois <- seq(- 5, 30, by = 1) # Specify x-values for dpois function
Now we can return the corresponding values of the poisson density for each of these values. In the example, we use a lambda of 10:
y_dpois <- dpois(x_dpois, lambda = 10) # Apply dpois function
If we want to create a graph showing these probability density values, we can apply the plot function:
plot(y_dpois) # Plot dpois values

Figure 1: Poisson Density in R.
Example 2: Poisson Distribution Function (ppois Function)
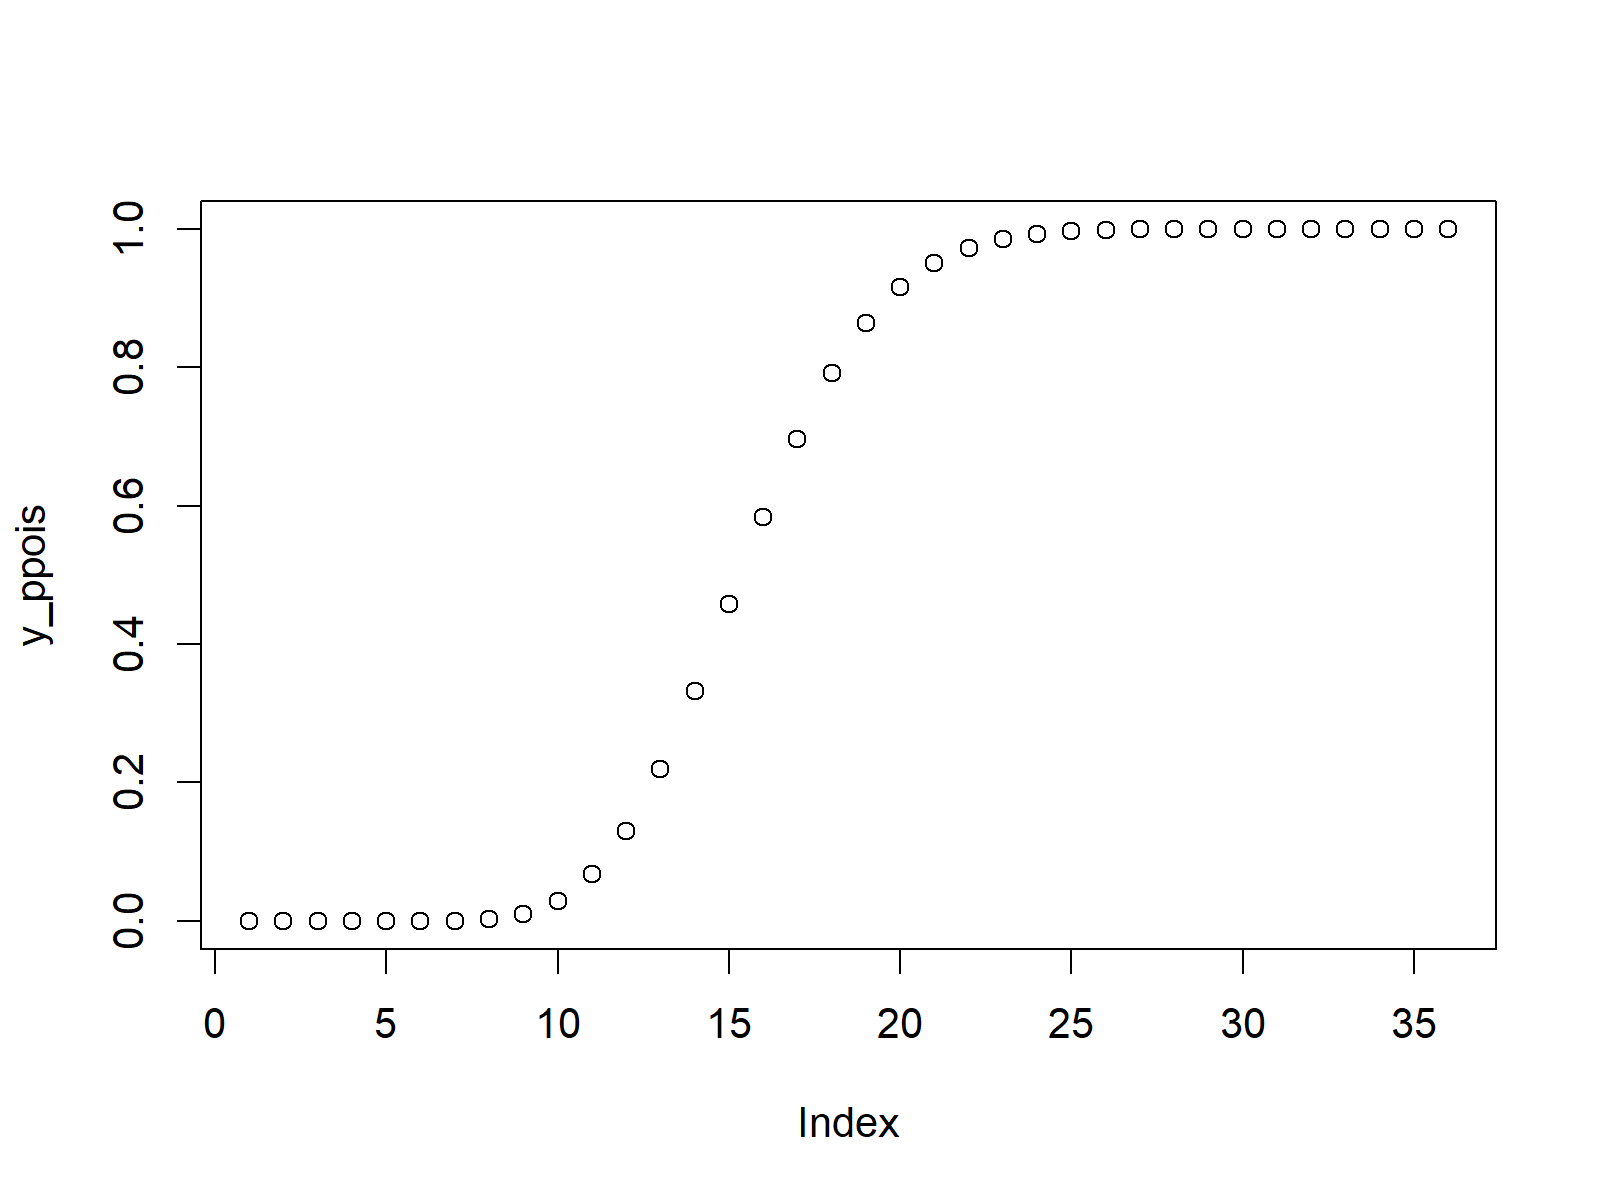
In the second example, we will use the ppois R command to plot the cumulative distribution function (CDF) of the poisson distribution.
Again, we first need to specify a vector of values, for which we want to return the corresponding value of the poisson distribution:
x_ppois <- seq(- 5, 30, by = 1) # Specify x-values for ppois function
We then can apply the ppois function…
y_ppois <- ppois(x_ppois, lambda = 10) # Apply ppois function
…and create an R plot as follows:
plot(y_ppois) # Plot ppois values

Figure 2: Poisson Distribution in R.
Example 3: Poisson Quantile Function (qpois Function)
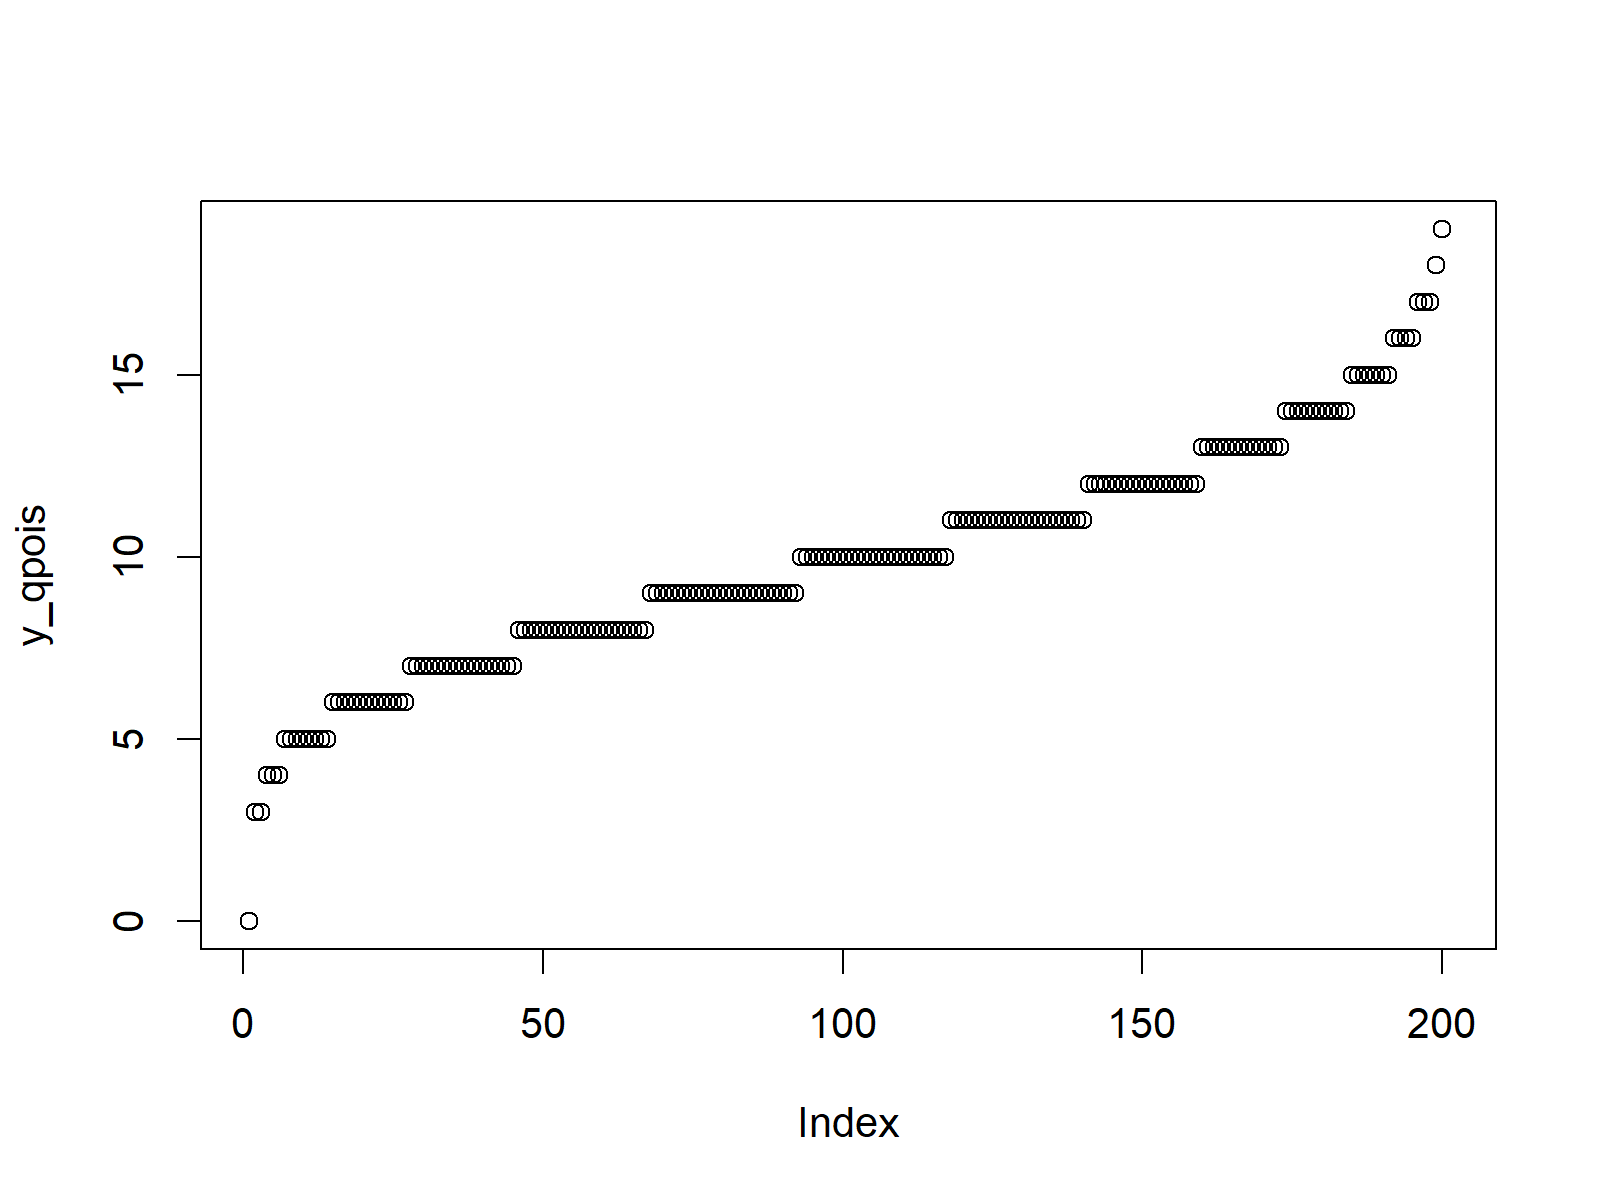
Similar to the previous examples, we can also create a plot of the poisson quantile function. Let’s create a sequence of values to which we can apply the qpois function:
x_qpois <- seq(0, 1, by = 0.005) # Specify x-values for qpois function
Now, we can apply the qpois function with a lambda of 10 as follows:
y_qpois <- qpois(x_qpois, lambda = 10) # Apply qpois function
With the plot function, we can illustrate our output:
plot(y_qpois) # Plot qpois values

Figure 3: Poisson Quantile Function in R Plot.
Example 4: Random Number Generation (rpois Function)
In case we want to draw random numbers according to the poisson distribution, we can use the following R code.
First, we need to specify a seed to ensure reproducibility and a sample size of random numbers that we want to draw:
set.seed(13579)                                    # Set seed for reproducibility
<pre lang="csharp">N <- 10000                                         # Specify sample size
Then, we can apply the rpois functions as shown below:
y_rpois <- rpois(N, lambda = 10)                   # Draw N poisson distributed values
y_rpois                                            # Print values to RStudio console
# 6 14  8 16  6 12 10  6  7 11  7 12 10 16  7  7  7 19 13
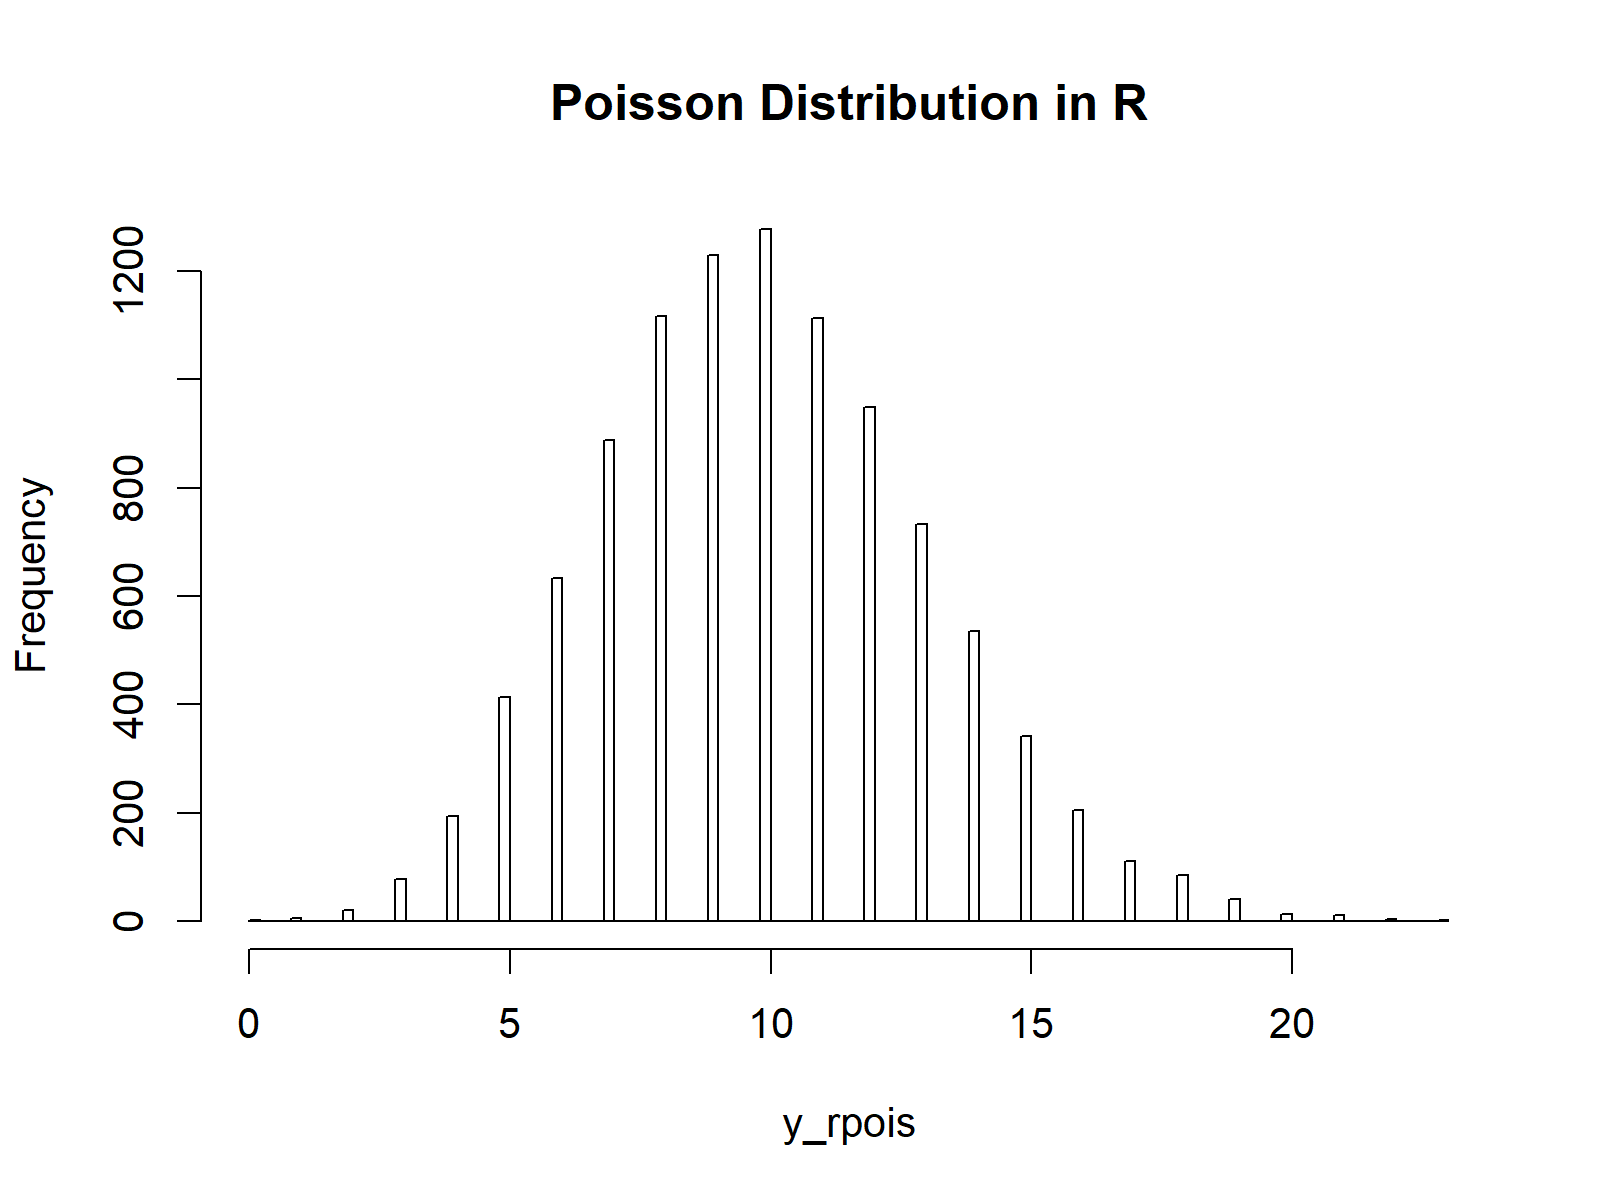
As you can see based on the RStudio output, the rpois function returned a set of random integer numbers. We can show these random numbers in a histogram with the hist function:
hist(y_rpois,
     breaks = 100,
     main = "Poisson Distribution in R")           # Plot histogram of rpois values

Figure 4: Randomly Generated Histogram of Poisson Distribution.
Video & Further Resources
Have a look at the following video of my YouTube channel. In the video, I’m explaining the R syntax of this article:
The YouTube video will be added soon.
You may also read the other posts on distributions and the simulation of random numbers in R:
- Bernoulli Distribution in R
- Beta Distribution in R
- Binomial Distribution in R
- Bivariate & Multivariate Distributions in R
- Cauchy Distribution in R
- Chi-Squred Distribution in R
- Exponential Distribution in R
- F Distribution in R
- Gamma Distribution in R
- Geometric Distribution in R
- Hypergeometric Distribution in R
- Log Normal Distribution in R
- Logistic Distribution in R
- Negative Binomial Distribution in R
- Normal Distribution in R
- Poisson Distribution in R
- Student t Distribution in R
- Studentized Range Distribution in R
- Uniform Distribution in R
- Weibull Distribution in R
- Wilcoxon Signedank Statistic Distribution in R
- Wilcoxonank Sum Statistic Distribution in R
Besides that, you could have a look at the related tutorials of https://statisticsglobe.com/. Some tutorials about different types of distributions can be found here:
In this article you learned how to draw and simulate a poisson distribution in the R programming language. Let me know in the comments, in case you have any further questions.


