Cumulative Frequency & Probability Table in R (2 Examples)
In this R tutorial you’ll learn how to compute cumulative frequencies and probabilities.
The content of the article is structured as follows:
With that, let’s start right away:
Example Data
Have a look at the example data below.
set.seed(346597)                                     # Create example data
x <- sample(LETTERS[1:4], 100, TRUE)
head(x)                                              # First six values of example data
# [1] "A" "A" "D" "D" "D" "B"
As you can see based on the previous output of the RStudio console, our example data is a vector containing a random sequence of letters.
Example 1: Calculate Cumulative Frequency Using table() & cumsum() Functions
In this example, I’ll explain how to apply the table and cumsum functions to calculate cumulative frequencies in R.
We can use the table function to create a cross-tabulation table showing the count (or frequency) of each value in our vector:
table_x <- table(x)                                  # Create frequency table
table_x                                              # Print frequency table
# x
#  A  B  C  D
# 29 25 20 26
Next, we can apply the cumsum function to this table to return the cumulative frequencies:
cumsum_table_x <- cumsum(table_x)                    # Create cumulative frequency table
cumsum_table_x                                       # Print cumulative frequency table
#   A   B   C   D
#  29  54  74 100
Have a look at the previous output of the RStudio console. We have created a cumulative frequency table.
Example 2: Create Table with Frequency Counts & (Relative) Cumulative Frequencies
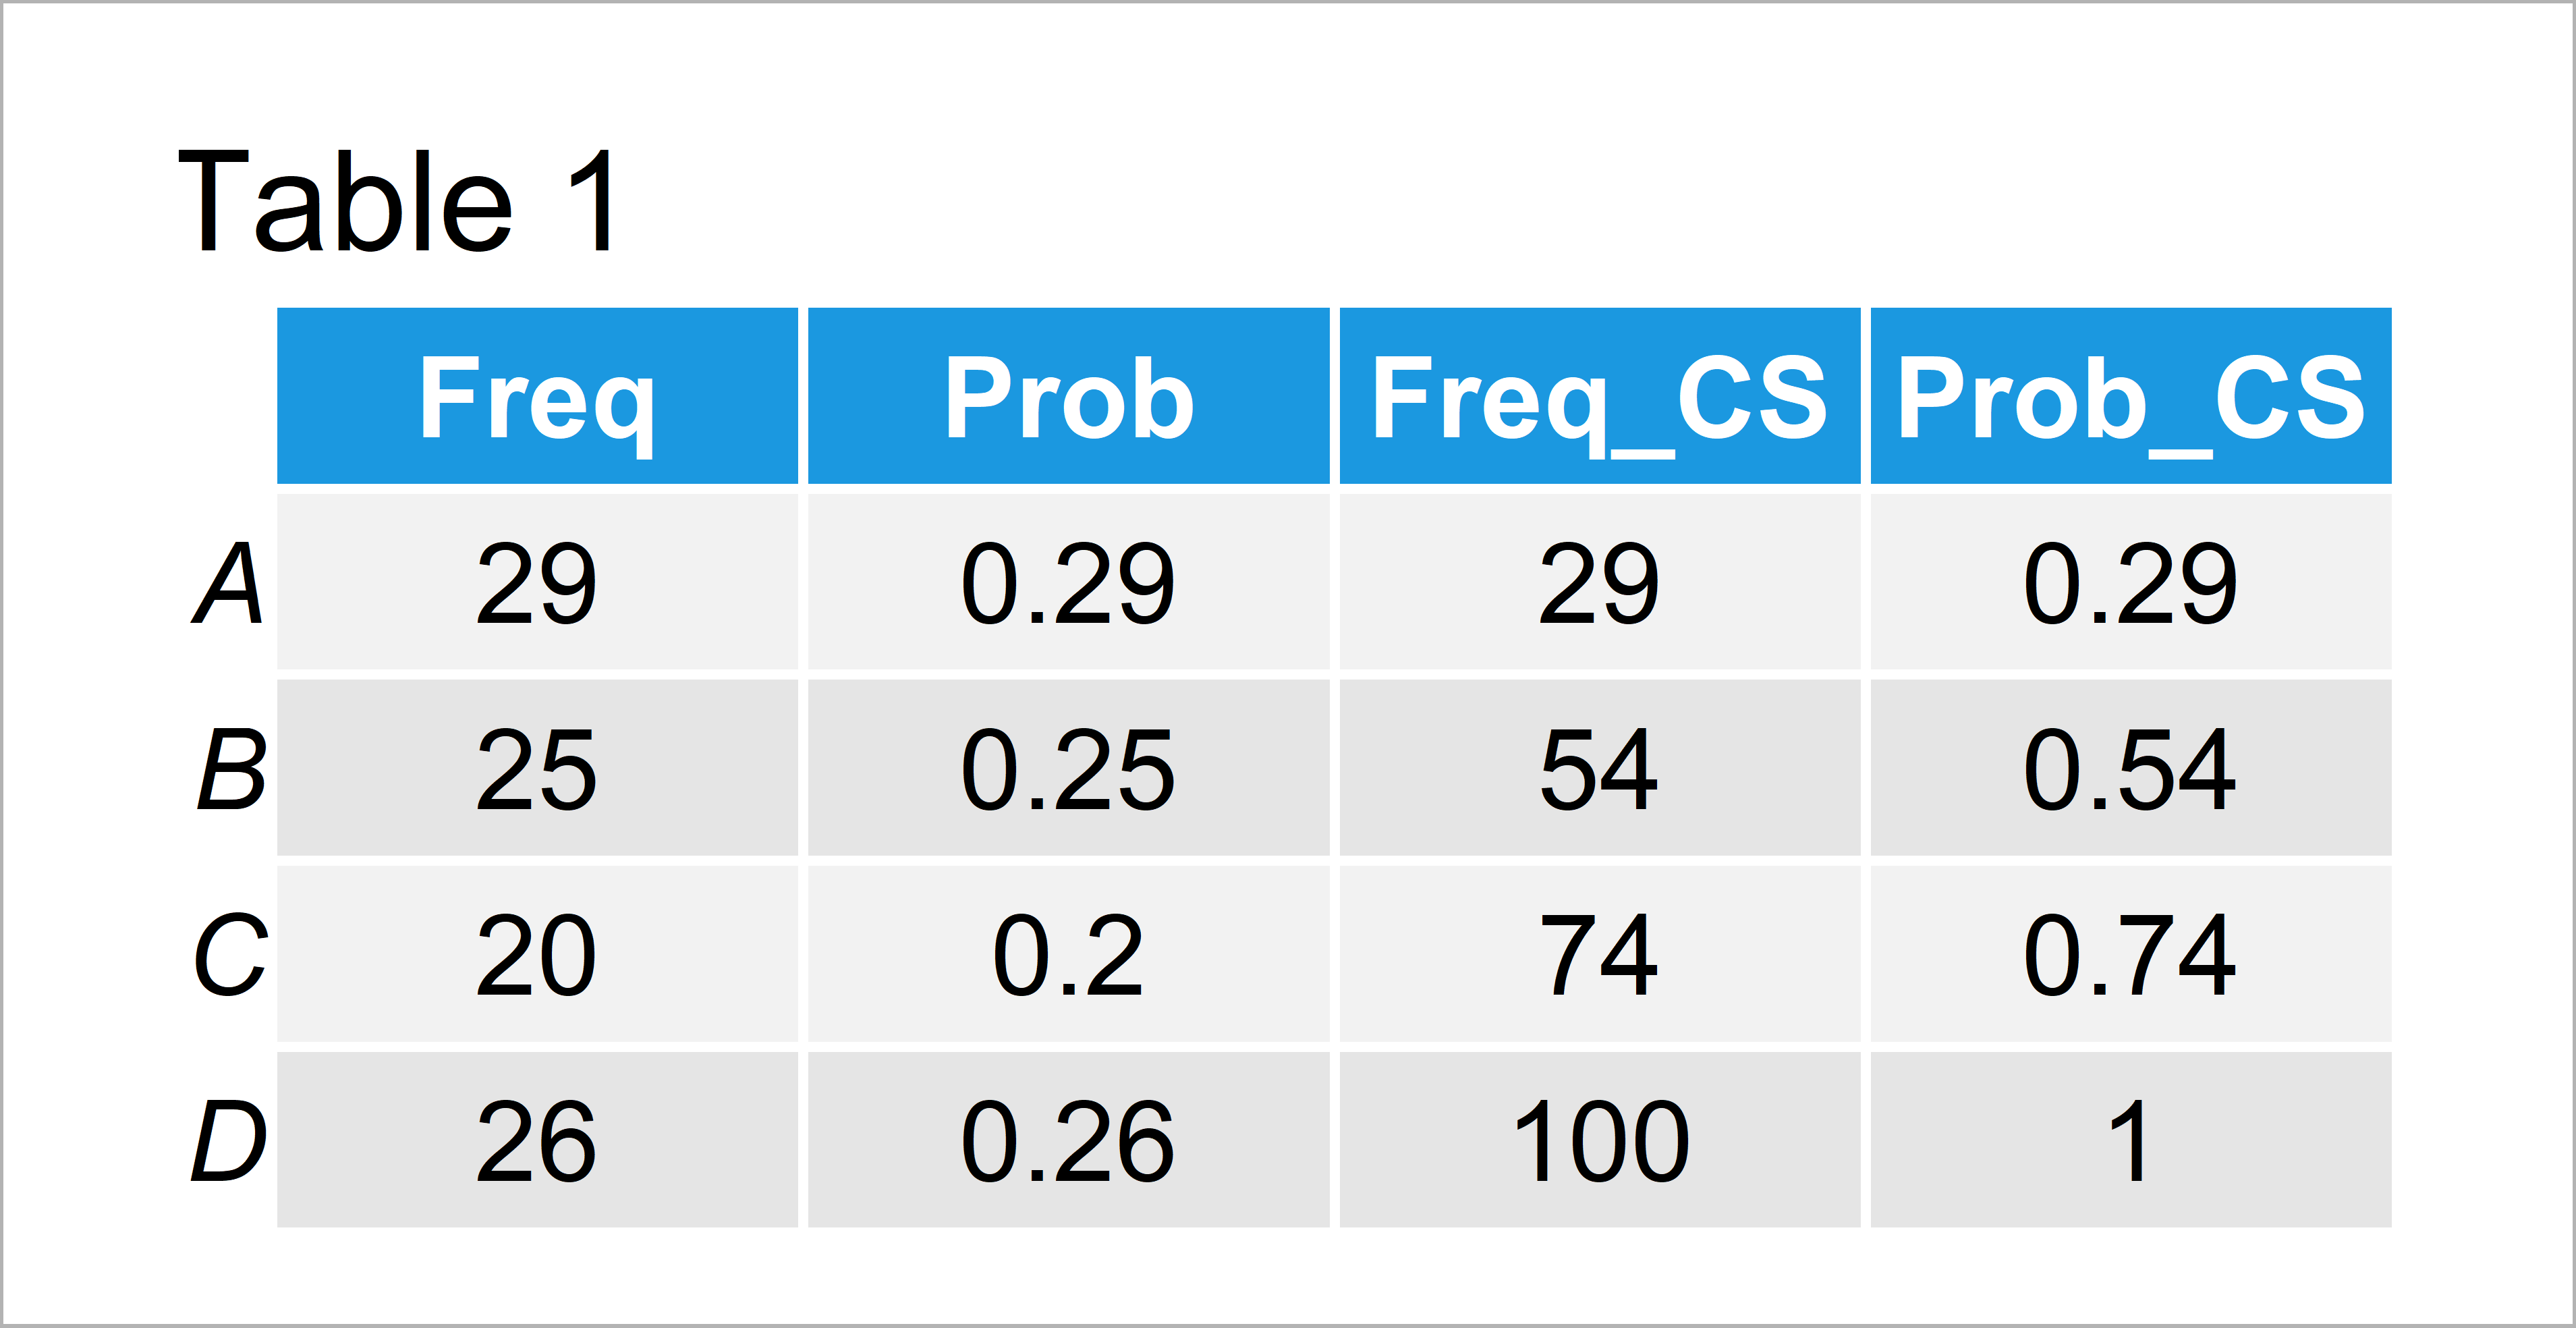
Example 2 explains how to create a data frame different important values such as frequencies, probabilities, cumulative frequencies, and cumulative probabilities.
Have a look at the following R syntax:
data_freq <- data.frame(Freq = as.numeric(table_x),  # Create data frame with relevant values
                        Prob = as.numeric(table_x / 100),
                        Freq_CS = as.numeric(cumsum_table_x),
                        Prob_CS = as.numeric(cumsum_table_x / 100))
rownames(data_freq) <- LETTERS[1:4]
data_freq                                            # Print data frame with relevant values

Table 1 shows our final table with all relevant values, i.e. frequency distribution, proportions, cumulative frequencies, and relative cumulative frequencies.
Video, Further Resources & Summary
If you need more explanations on the R code of this tutorial, I recommend watching the following video of my YouTube channel. In the video instruction, I illustrate the R codes of this tutorial in R:
Furthermore, you might want to have a look at the other tutorials of this website.
- Extend Contingency Table with Proportions & Percentages
- Proportions with dplyr Package in R
- Get Frequency of Elements with Certain Value in Vector
- Count Unique Values in R
- Count Observations by Factor Level in R
- R Programming Overview
At this point you should know how to get the cumulative frequency and percentage of a vector in R. Don’t hesitate to let me know in the comments section, if you have any further questions.


