Legends of ggplot2 Themes in R (Example & Gallery)
This tutorial shows how to change the legend layouts in ggplot2 plots using different themes in the R programming language.
The table of content is structured as follows:
Let’s dive right into the example.
Example Data & Packages
As the first step, let’s create some example data:
set.seed(2967536)                                    # Create example data
data <- data.frame(x = rnorm(100),
                   y = rnorm(100),
                   group = paste0("group_", LETTERS[1:4]))
head(data)                                           # Print head of example data
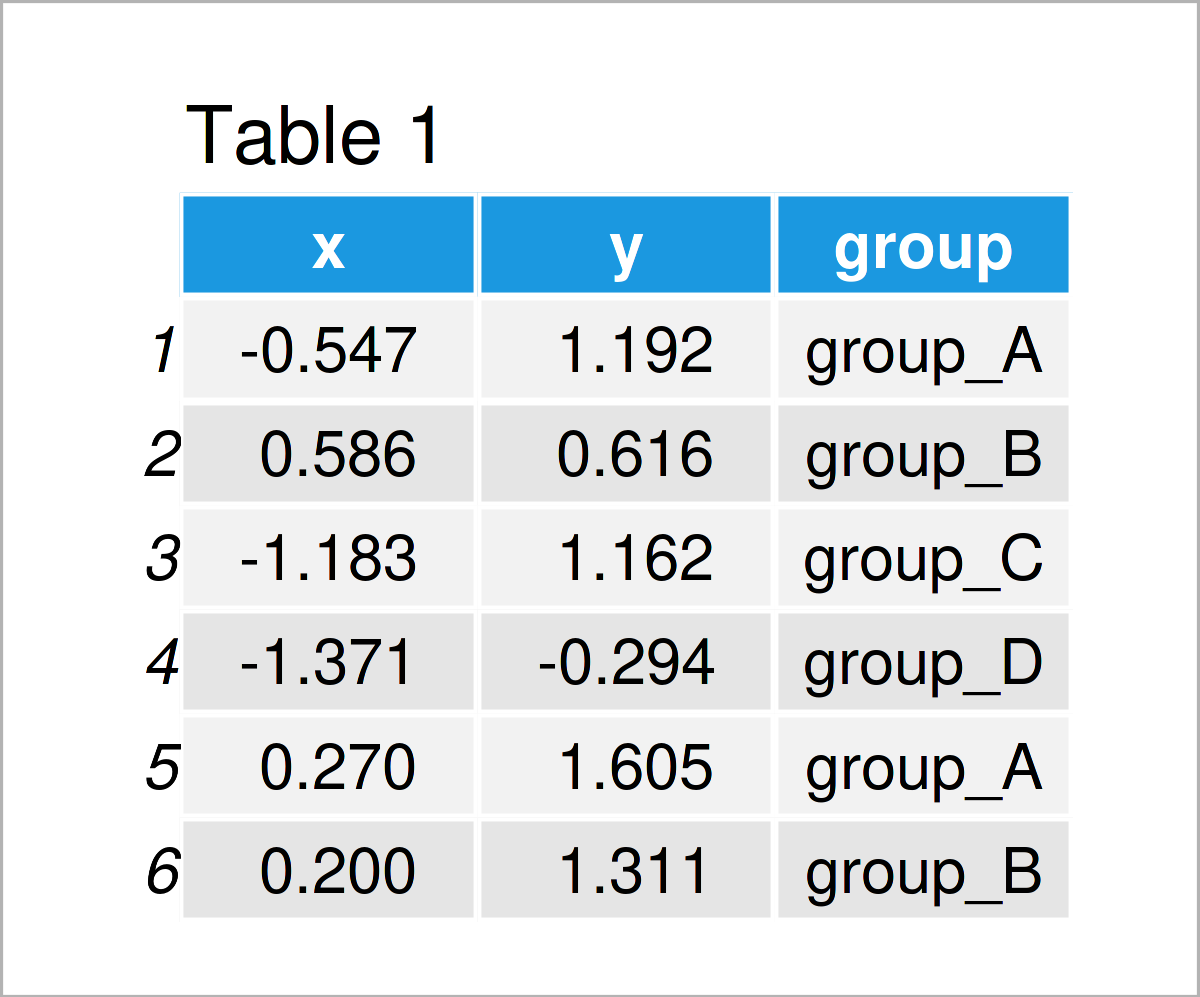
Table 1 shows that our example data has three columns, two numeric columns and a group indicator.
In order to create a plot of our data with the ggplot2 package, we also need to install and load ggplot2:
install.packages("ggplot2")                          # Install ggplot2 package
library("ggplot2")                                   # Load ggplot2
Next, we can draw a ggplot2 scatterplot with default legend specifications as shown below:
ggp <- ggplot(data, aes(x, y, col = group)) +        # Create ggplot2 plot with default legend
  geom_point()
ggp
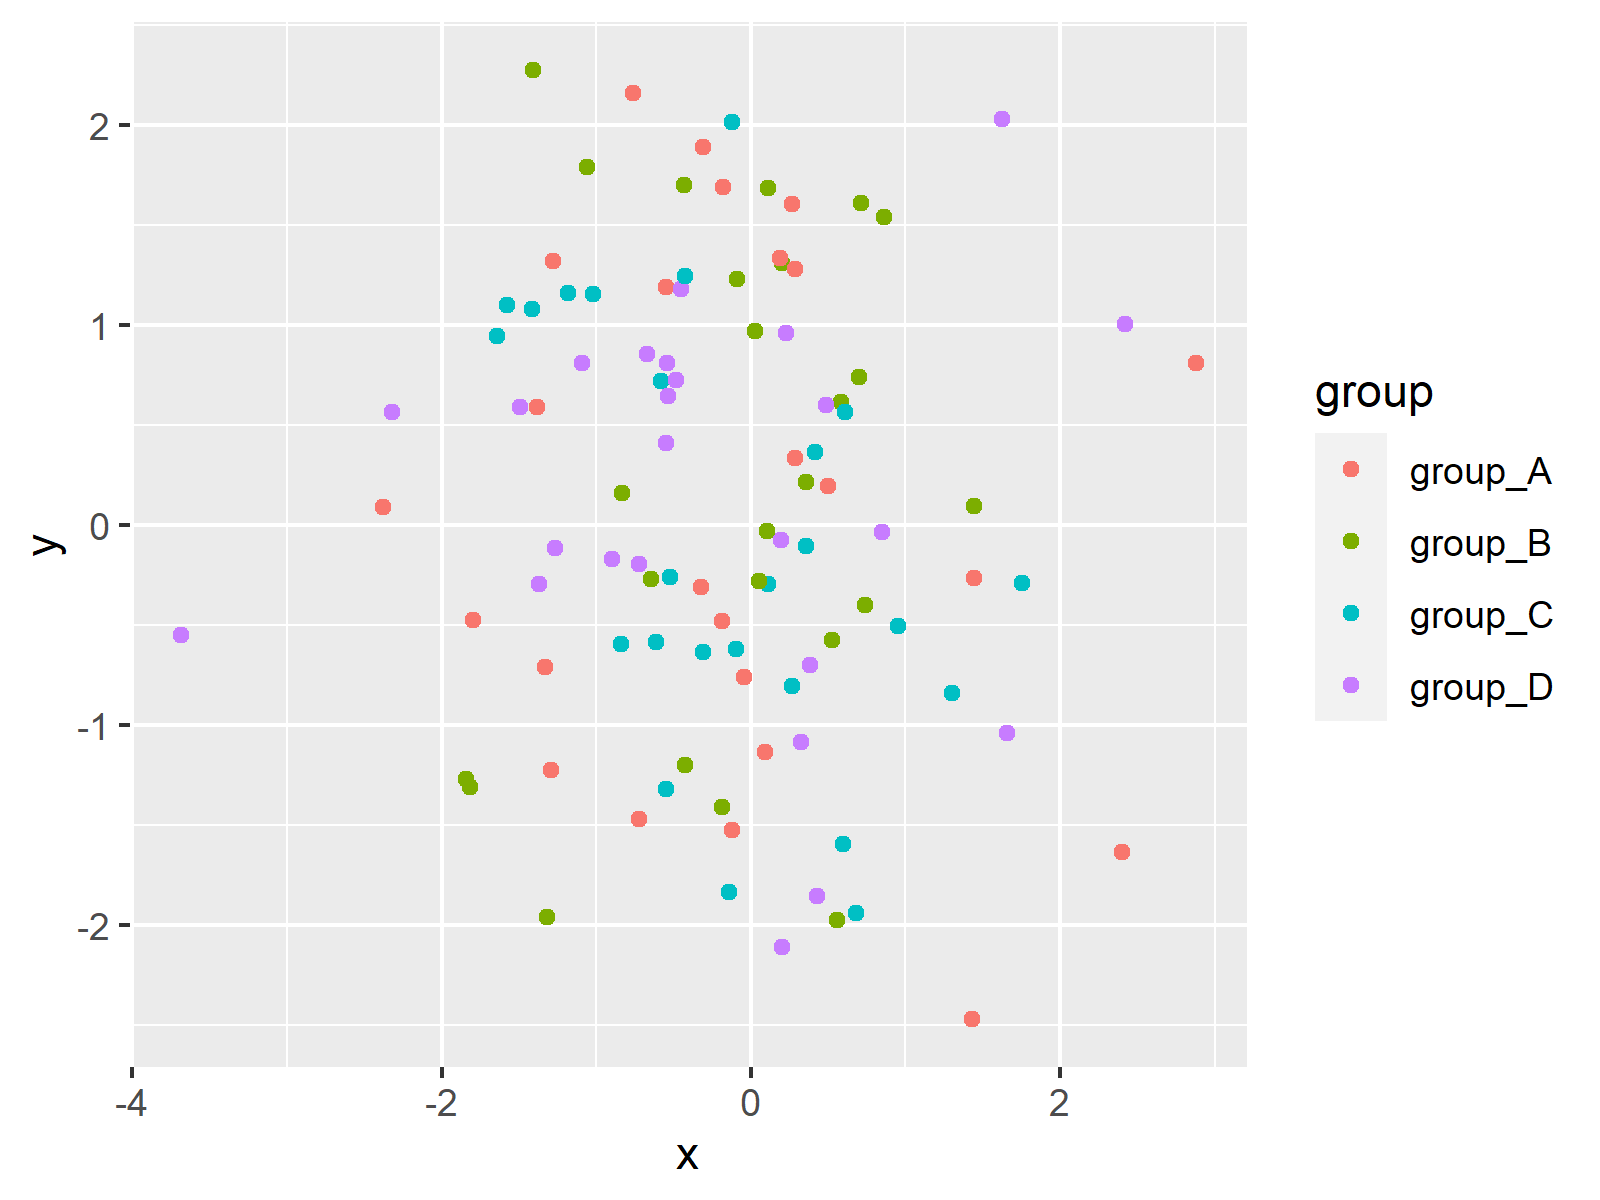
As visualized in Figure 1, we have created a ggplot2 graphic with a default legend on the right side of the plot by executing the previous code.
Example: Change Theme & Legend of ggplot2 Plot
This example demonstrates how to switch the theme and the legend of a ggplot2 graphic in R.
The ggplot2 package provides nine different default themes that can be accessed by adding the corresponding theme names to a ggplot2 object:
ggp_bw <- ggp + theme_bw() + ggtitle("theme_bw()")   # Switch ggplot2 themes
ggp_classic <- ggp + theme_classic() + ggtitle("theme_classic()")
ggp_dark <- ggp + theme_dark() + ggtitle("theme_dark()")
ggp_gray <- ggp + theme_gray() + ggtitle("theme_gray()")
ggp_linedraw <- ggp + theme_linedraw() + ggtitle("theme_linedraw()")
ggp_light <- ggp + theme_light() + ggtitle("theme_light()")
ggp_minimal <- ggp + theme_minimal() + ggtitle("theme_minimal()")
ggp_test <- ggp + theme_test() + ggtitle("theme_test()")
ggp_void <- ggp + theme_void() + ggtitle("theme_void()")
The previous syntax has created nine different ggplot2 objects with different themes and legend layouts.
For comparison, we can visualize all of these graphs in a plot layout using the patchwork package:
library("patchwork")
Next, we can create a grid layout of our nine plots as shown below:
(ggp_bw + ggp_classic + ggp_dark) /                  # Draw layout of ggplot2 plots
  (ggp_gray + ggp_linedraw + ggp_light) /
  (ggp_minimal + ggp_test + ggp_void)
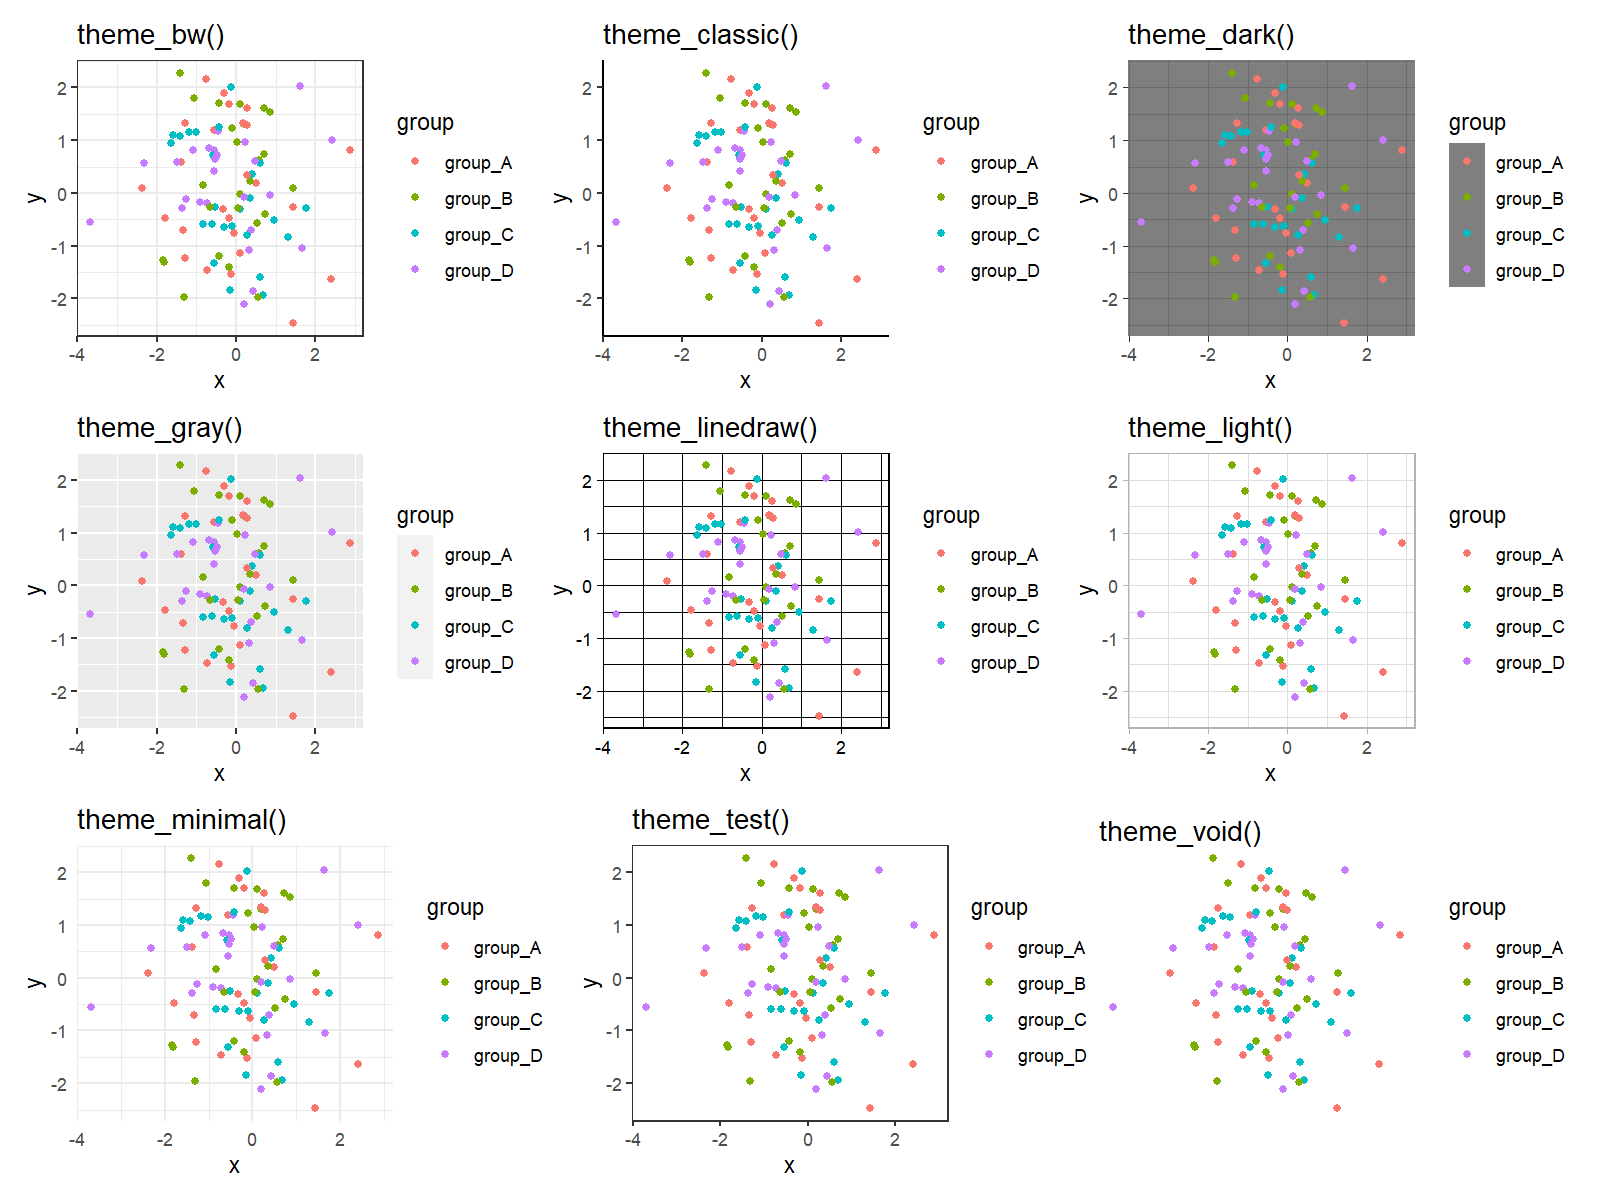
Have a look at Figure 2. As you can see, the legends are the same for seven of the default ggplot2 themes. However, in case of theme_gray and theme_dark, the legend colors are different.
Note that it’s also possible to customize ggplot2 themes manually. This way, you may specify all legend and plot options such as colors, legend titles, legend positions, and so on as you want.
Video, Further Resources & Summary
If you are interested in data visualization in R and the functions of the ggplot2 package, you have to watch the following video, where I explain the ggplot2 package in much more detail (beginners & advanced users).
On Statistics Globe, you can also find tutorials on how to create different kinds of graphics such as scatterplots, density plots, barcharts, boxplots, histograms, and line plots using different ggplot2 themes:
- theme_bw
- theme_classic
- theme_dark
- theme_economist [ggthemes Package]
- theme_gray
- theme_light
- theme_linedraw
- theme_minimal
- theme_test
- theme_void
Furthermore, you may have a look at the introductions to other add-on packages that provide extra themes for ggplot2 plots:
Furthermore, you might want to have a look at some of the other tutorials on this homepage. You can find some related tutorials about topics such as plot legends, colors, and graphics in R below.
- Remove Legend Title from ggplot2 Plot in R
- Change Display Order of ggplot2 Plot Legend
- Change Legend Labels of ggplot2 Plot in R
- Create Legend in ggplot2 Plot
- Control Line Color & Type in ggplot2 Plot Legend
- Creating Plots in R
- The R Programming Language
To summarize: In this tutorial you have learned how to modify the legend layouts in ggplot2 plots using different themes in R programming. In case you have additional questions, don’t hesitate to let me know in the comments section below.


