Introduction to the patchwork Package in R (Example Code)
Recently, I have discovered the patchwork package of Thomas Lin Pedersen, and I was impressed how easy it is to combine multiple ggplot2 plots in a plot composition using this package.
In this tutorial, I want to explain the basics of the patchwork package and some of its most important functions.
Before we dive into the examples…
- Here you can find the documentation of the patchwork package.
- Here you can find the CRAN page of the patchwork package.
- Here you can find the homepage of the patchwork package.
Make sure to check out the previous links for detailed instructions on how to use the patchwork package in R.
In the following, however, I’ll give an introduction to the basic functionality of the package. So keep on reading!
Example Data, Add-On Packages & ggplot2 Plots
First, let’s load some example data to R:
data(iris)                         # Load iris flower data set
head(iris)                         # Head of iris flower data set
#   Sepal.Length Sepal.Width Petal.Length Petal.Width Species
# 1          5.1         3.5          1.4         0.2  setosa
# 2          4.9         3.0          1.4         0.2  setosa
# 3          4.7         3.2          1.3         0.2  setosa
# 4          4.6         3.1          1.5         0.2  setosa
# 5          5.0         3.6          1.4         0.2  setosa
# 6          5.4         3.9          1.7         0.4  setosa
In this tutorial, we’ll use the iris flower data set as a basis.
The previous output of the RStudio console shows the structure of our example data. It consists of four numeric columns and a factor variable containing three different flower species.
If we want to use the functions of the patchwork package, we also have to install and load patchwork:
install.packages("patchwork")      # Install & load patchwork package
library("patchwork")
The patchwork package is used to combine plots created by the ggplot2 package. For that reason, we also have to install and load the ggplot2 package:
install.packages("ggplot2")        # Install & load ggplot2 package
library("ggplot2")
Now, we can plot our data in different types of ggplot2 plots as follows:
ggp1 <- ggplot(iris,               # Create ggplot2 scatterplot
               aes(x = Sepal.Length,
                   y = Sepal.Width,
                   col = Species)) +
  geom_point()
ggp1                               # Draw ggplot2 scatterplot
ggp2 <- ggplot(iris,               # Create ggplot2 barchart
               aes(x = Species,
                   y = Sepal.Width,
                   fill = Species)) +
  geom_bar(stat = "identity")
ggp2                               # Draw ggplot2 barchart
ggp3 <- ggplot(iris,               # Create ggplot2 boxplot
               aes(x = Species,
                   y = Sepal.Width,
                   col = Species)) +
  geom_boxplot()
ggp3                               # Draw ggplot2 boxplot
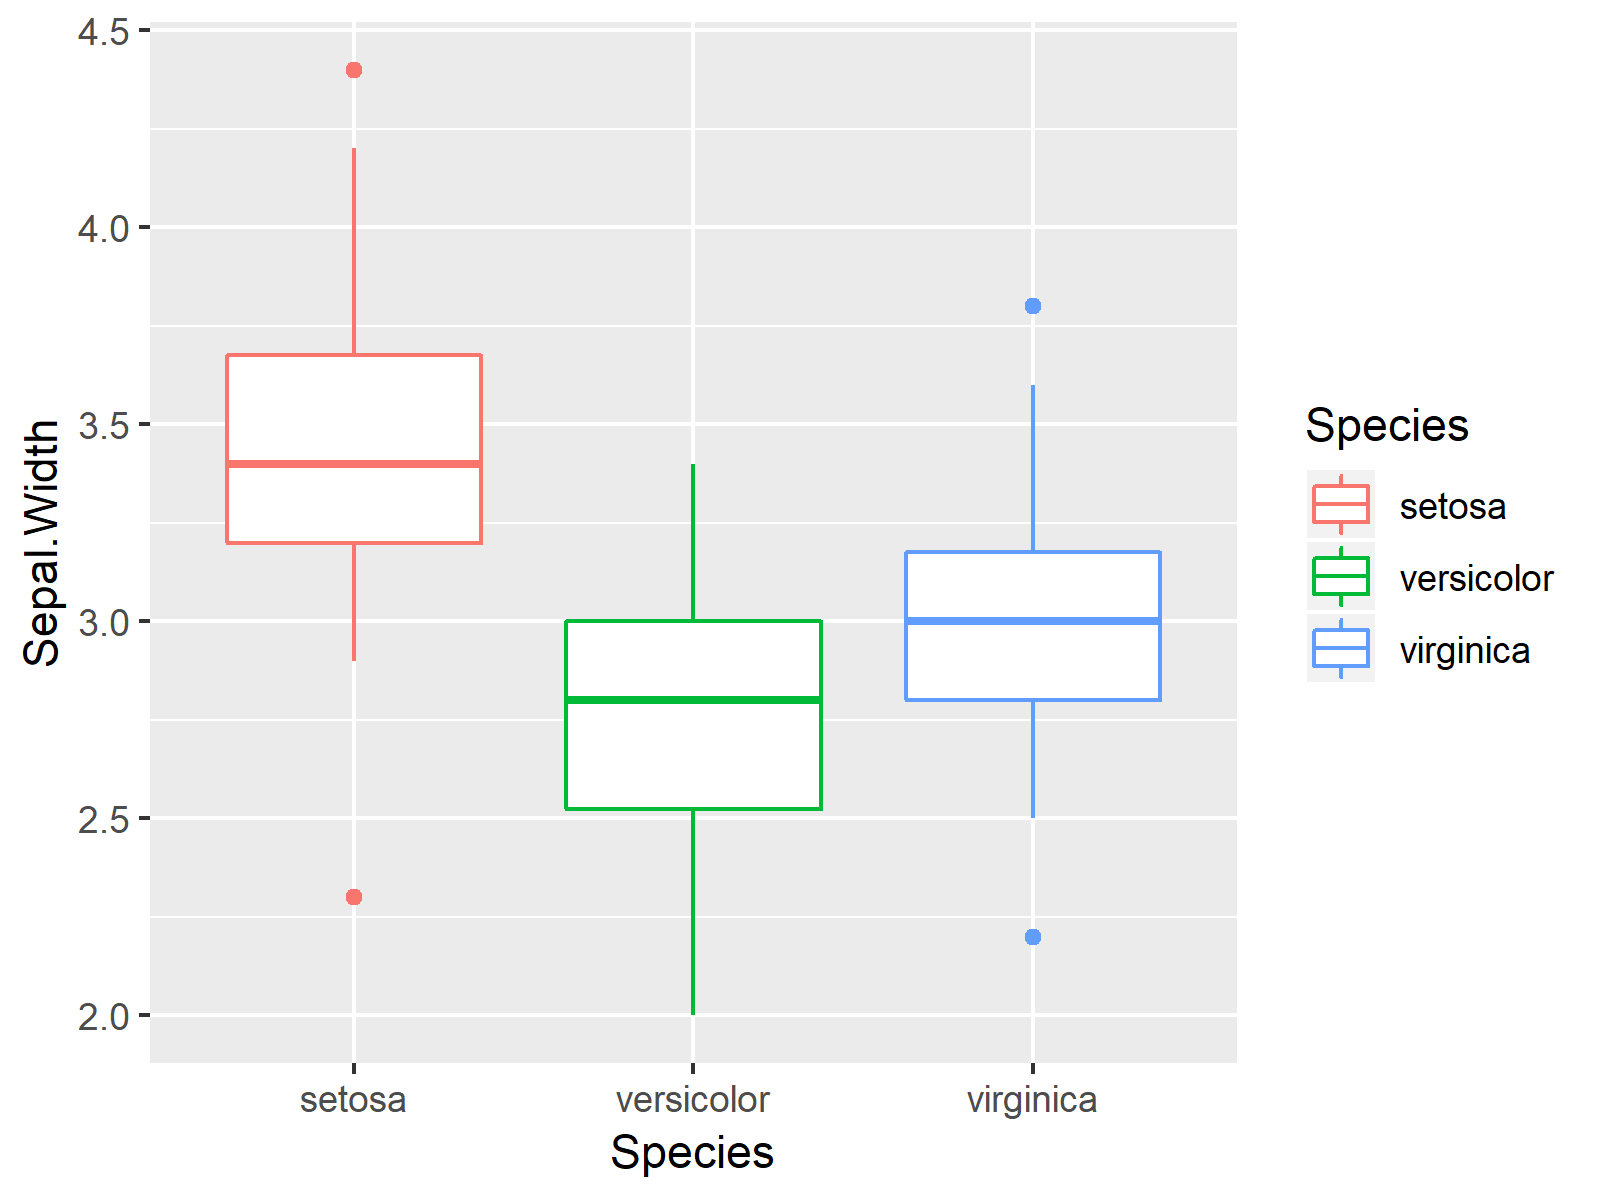
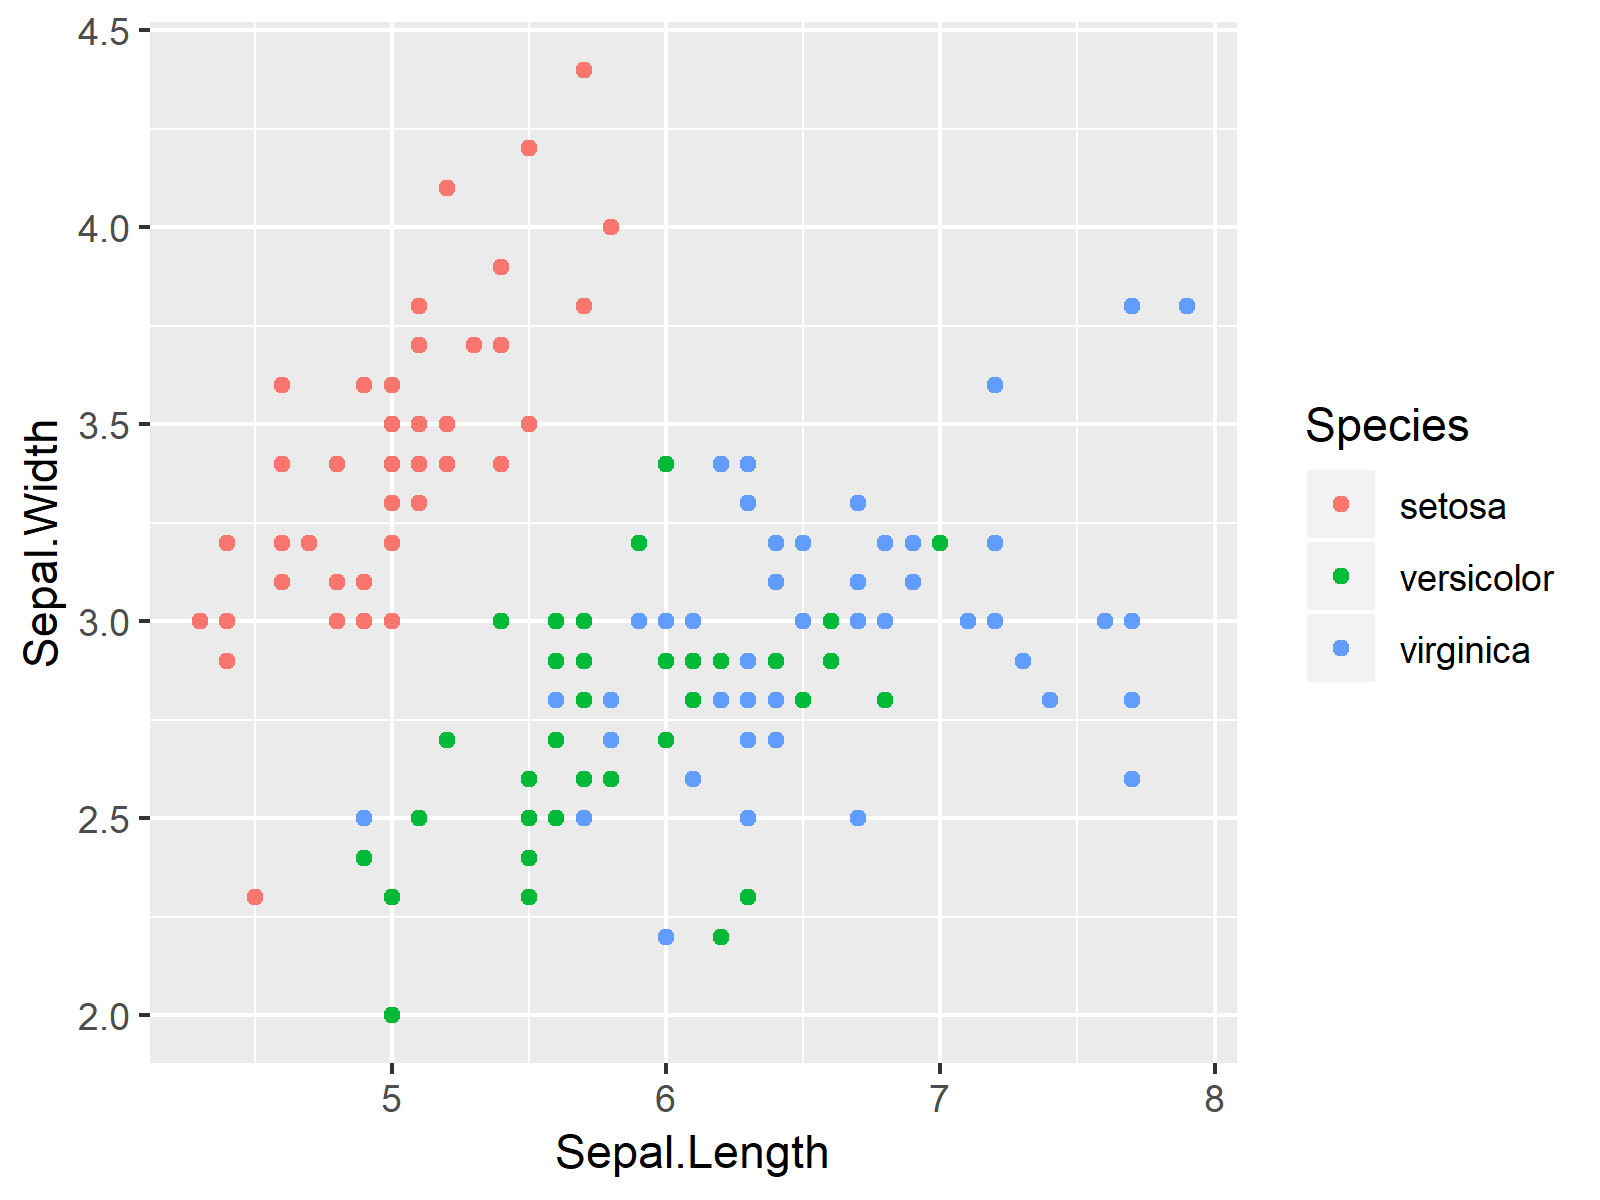
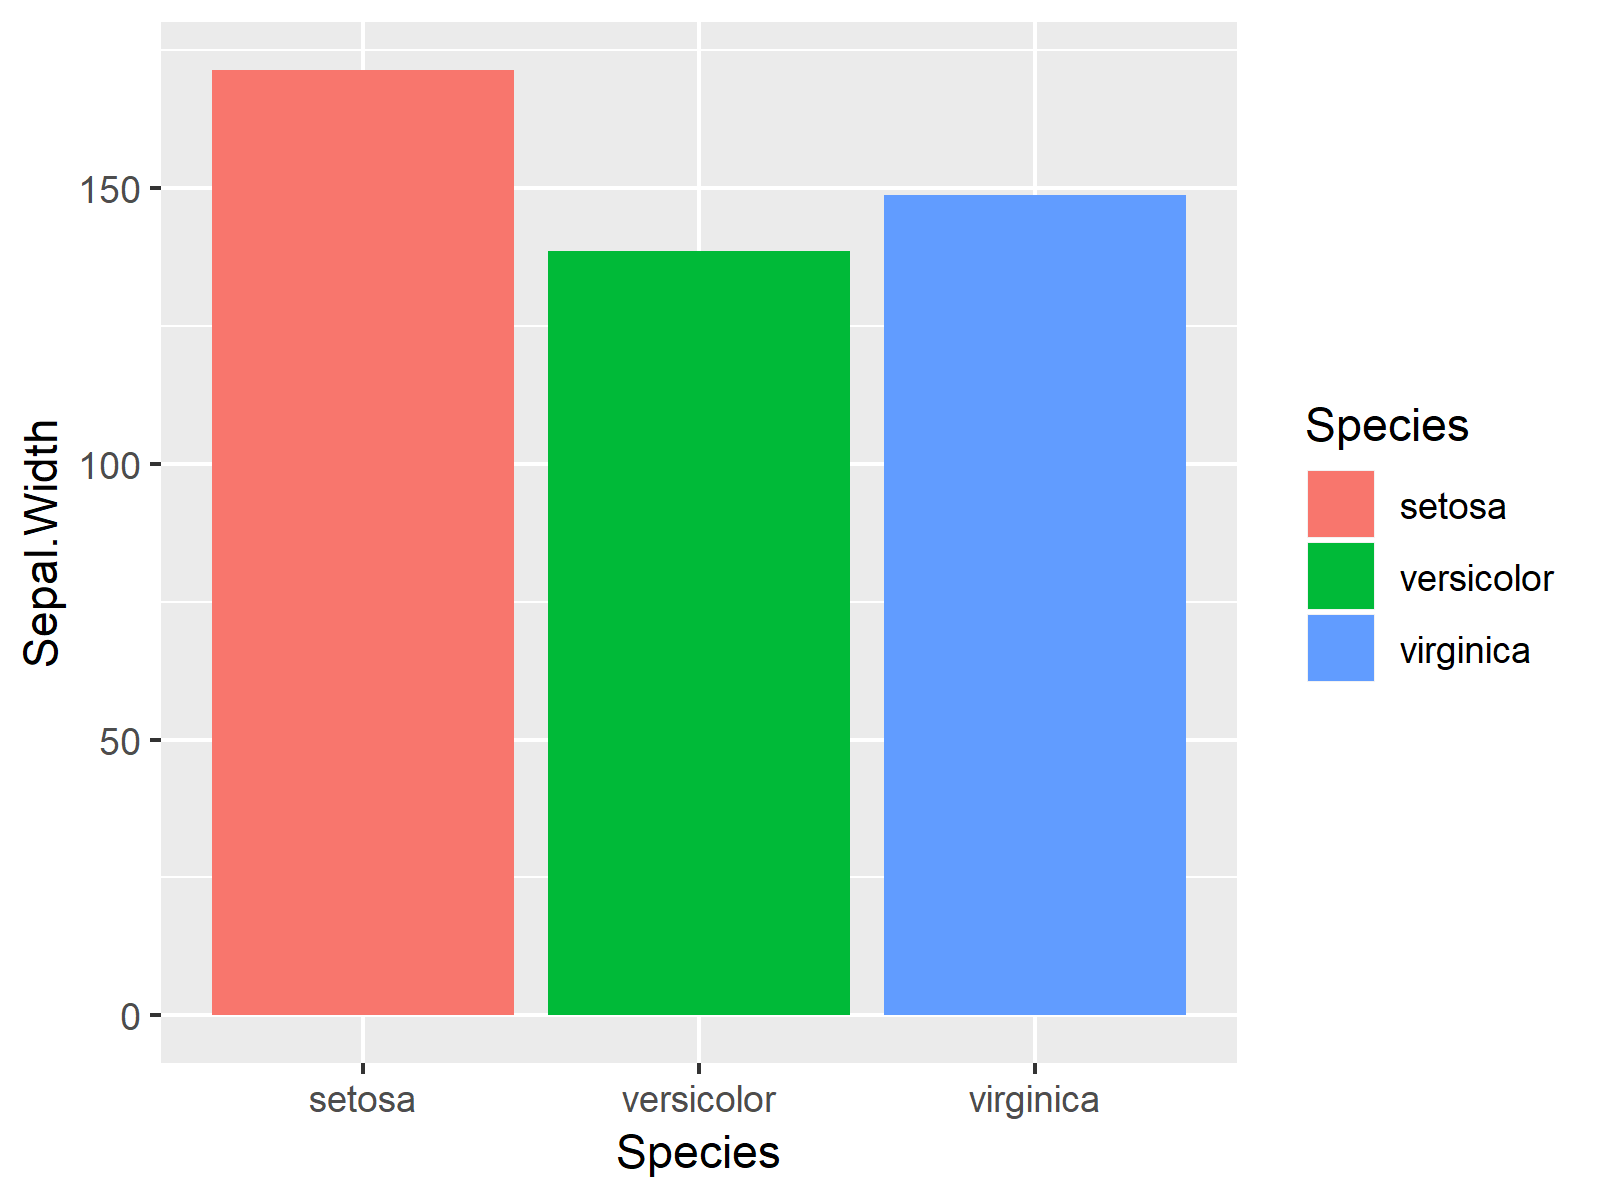
As shown in Figures 1, 2, and 3, we have created a scatterplot, a barplot, and a boxplot of the iris flower data set with the previously shown R code.
Example 1: Draw Composition of ggplot2 Plots Using patchwork Package
In this example, I’ll show how to draw a grid of plots using the patchwork package. Have a look at the following R code and the resulting graphic:
ggp_sbs <- (ggp1 + ggp2) / ggp3    # Create plot composition
ggp_sbs                            # Draw plot composition
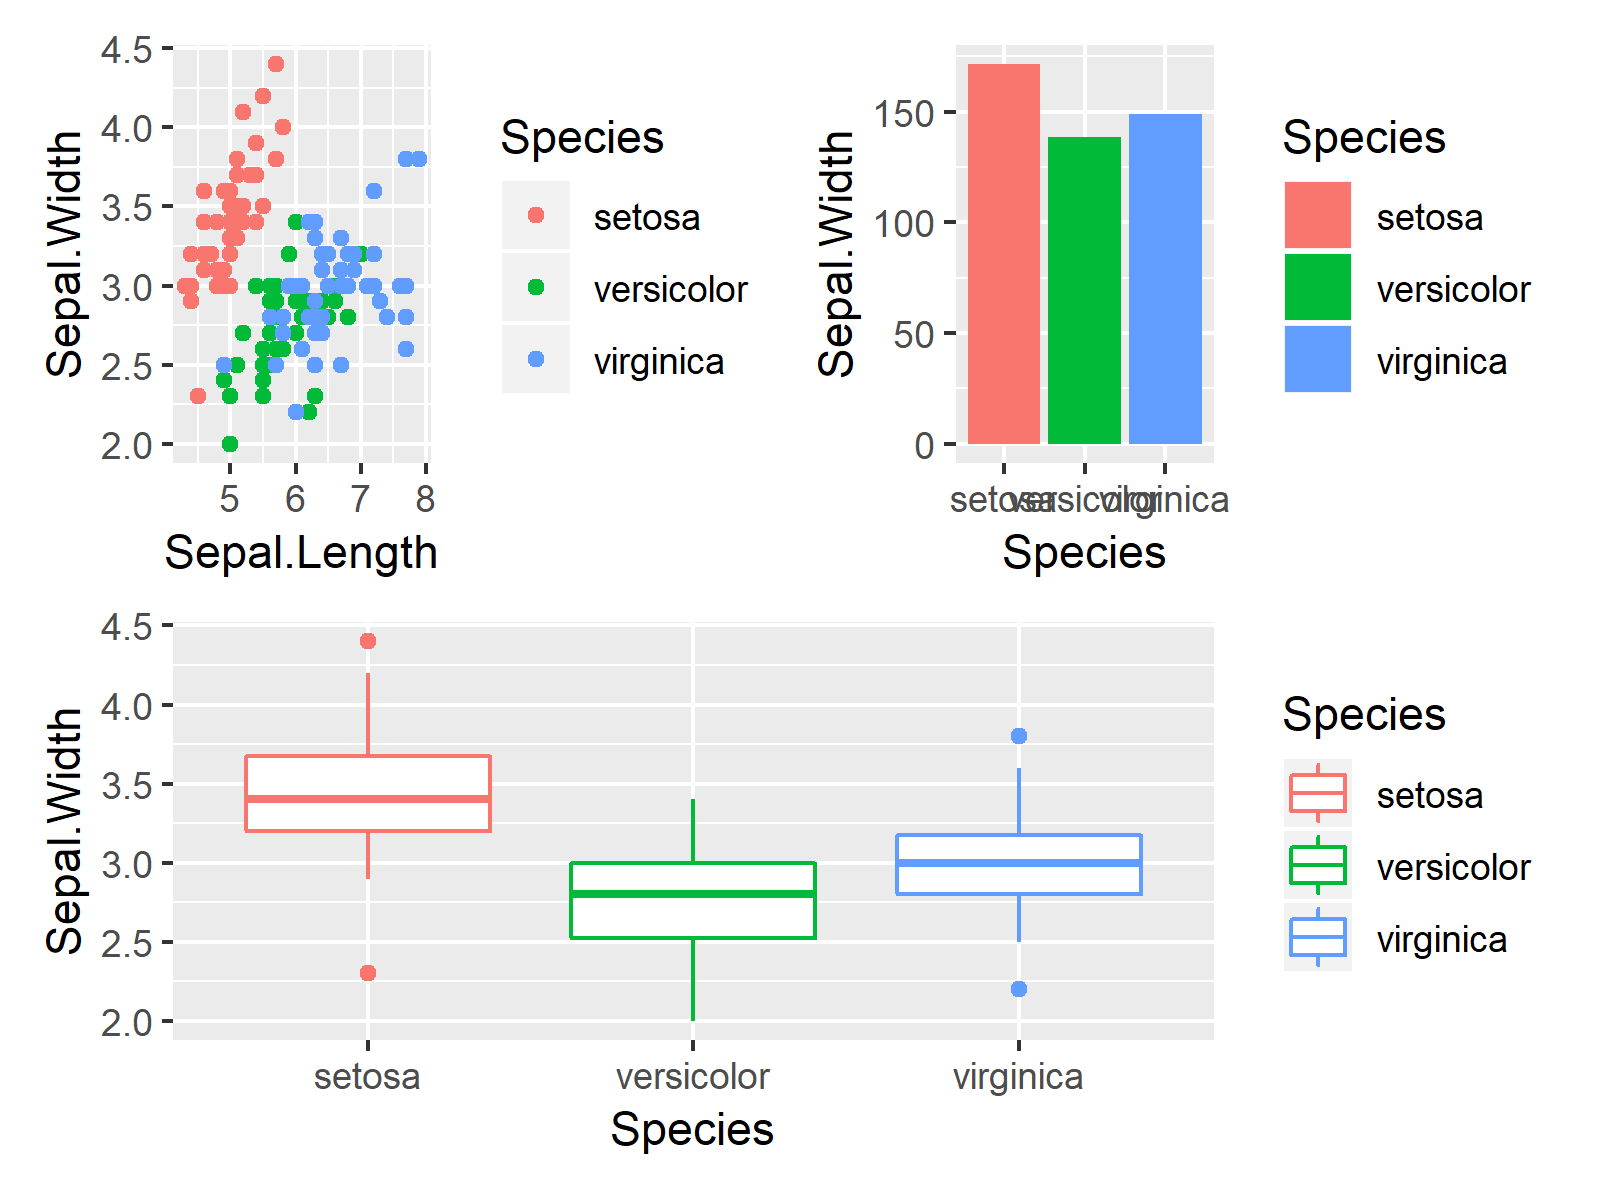
As shown in Figure 4, the previous R syntax created a plot composition of multiple ggplot2 graphs. The plot composition consists of several rows and columns.
If you want to learn more about how to arrange multiple ggplot2 plots using the patchwork package, you can have a look at this tutorial or at the following video on my YouTube channel:
Example 2: Print ggplot2 Plots On Top of Each Other Using patchwork Package
The following R programming syntax shows how to use the inset_element function of the patchwork package to draw different plots on top of each other. Consider the following R syntax:
ggp_top <- ggp1 +                  # Add plots on top of each other
  inset_element(ggp2, 0.01, 0.01, 0.7, 0.5) +
  inset_element(ggp3, 0.4, 0.6, 0.99, 0.99)
ggp_top                            # Draw combined plots
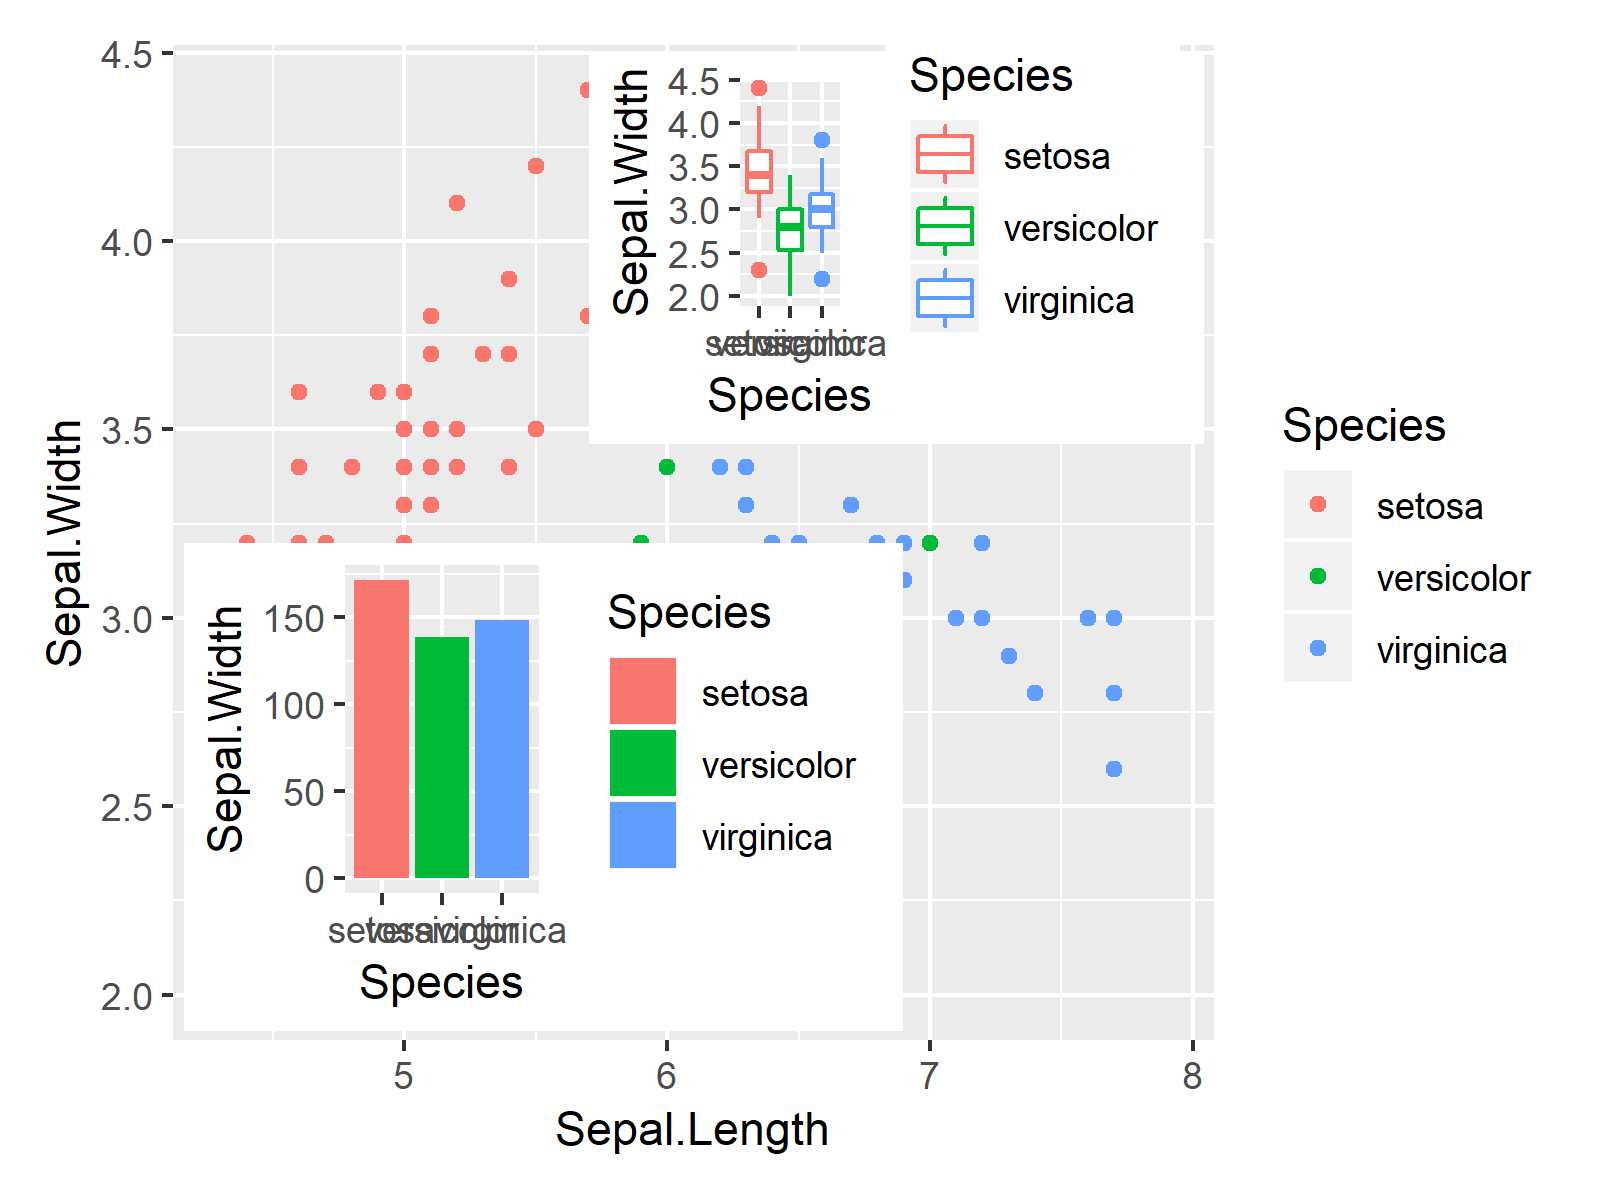
As shown in Figure 5, the previous R programming code created a graphic containing three different plots. Our example plot ggp1 was used as background and the two plots ggp2 and ggp3 were added as inset to this plot.
If you want to learn more on how to add an inset to a plot, you may have a look here, or you may check out the following YouTube tutorial:
If you want to know how to add an image on top of a ggplot2 graph using the inset_element function, you might check out this tutorial or the following video:
In summary: You learned in this tutorial how to apply the functions of the patchwork package in R. Please let me know in the comments, if you have any additional questions.



10 Comments. Leave new
Very flexible and it increases the presentation capabilities a lot. Thank you for sharing, Joachim..
Thanks a lot for the positive feedback Petros! I definitely agree, it’s a great package 🙂
This is definately one of the best blog on R Data visualization, I have also liked this video on YouTube which has helped me alot
Thanks a lot Rutuja, it’s great to hear that you like my content! 🙂
Hello Joachim,
this is very nice
You can also use alternatively the cowplot package
cowplot::plot_grid()
Hey Cyrus,
Thanks a lot for the kind words!
Indeed, the cowplot package provides nice solutions for this as well. Another package to consider is the gridExtra package.
Regards
Joachim
Very import things, thank you
Thanks a lot Mhamdi, glad you like my content! 🙂
Really helpful. Great job, as always!!
Thank you very much for the wonderful feedback Christian! 🙂