R ggplot2 Warning: Scale for ‘fill’ is already present – Replace existing
In this tutorial you’ll learn how to handle the ggplot2 warning message “Scale for ‘fill’ is already present. Adding another scale for ‘fill’, which will replace the existing scale.” in R.
The table of content looks as follows:
Let’s get started.
Example Data, Packages & Basic Graph
I’ll use the following data as basement for this R tutorial:
data <- data.frame(group = LETTERS[1:3],    # Create example data
                   value = 1:9)
data                                        # Print example data
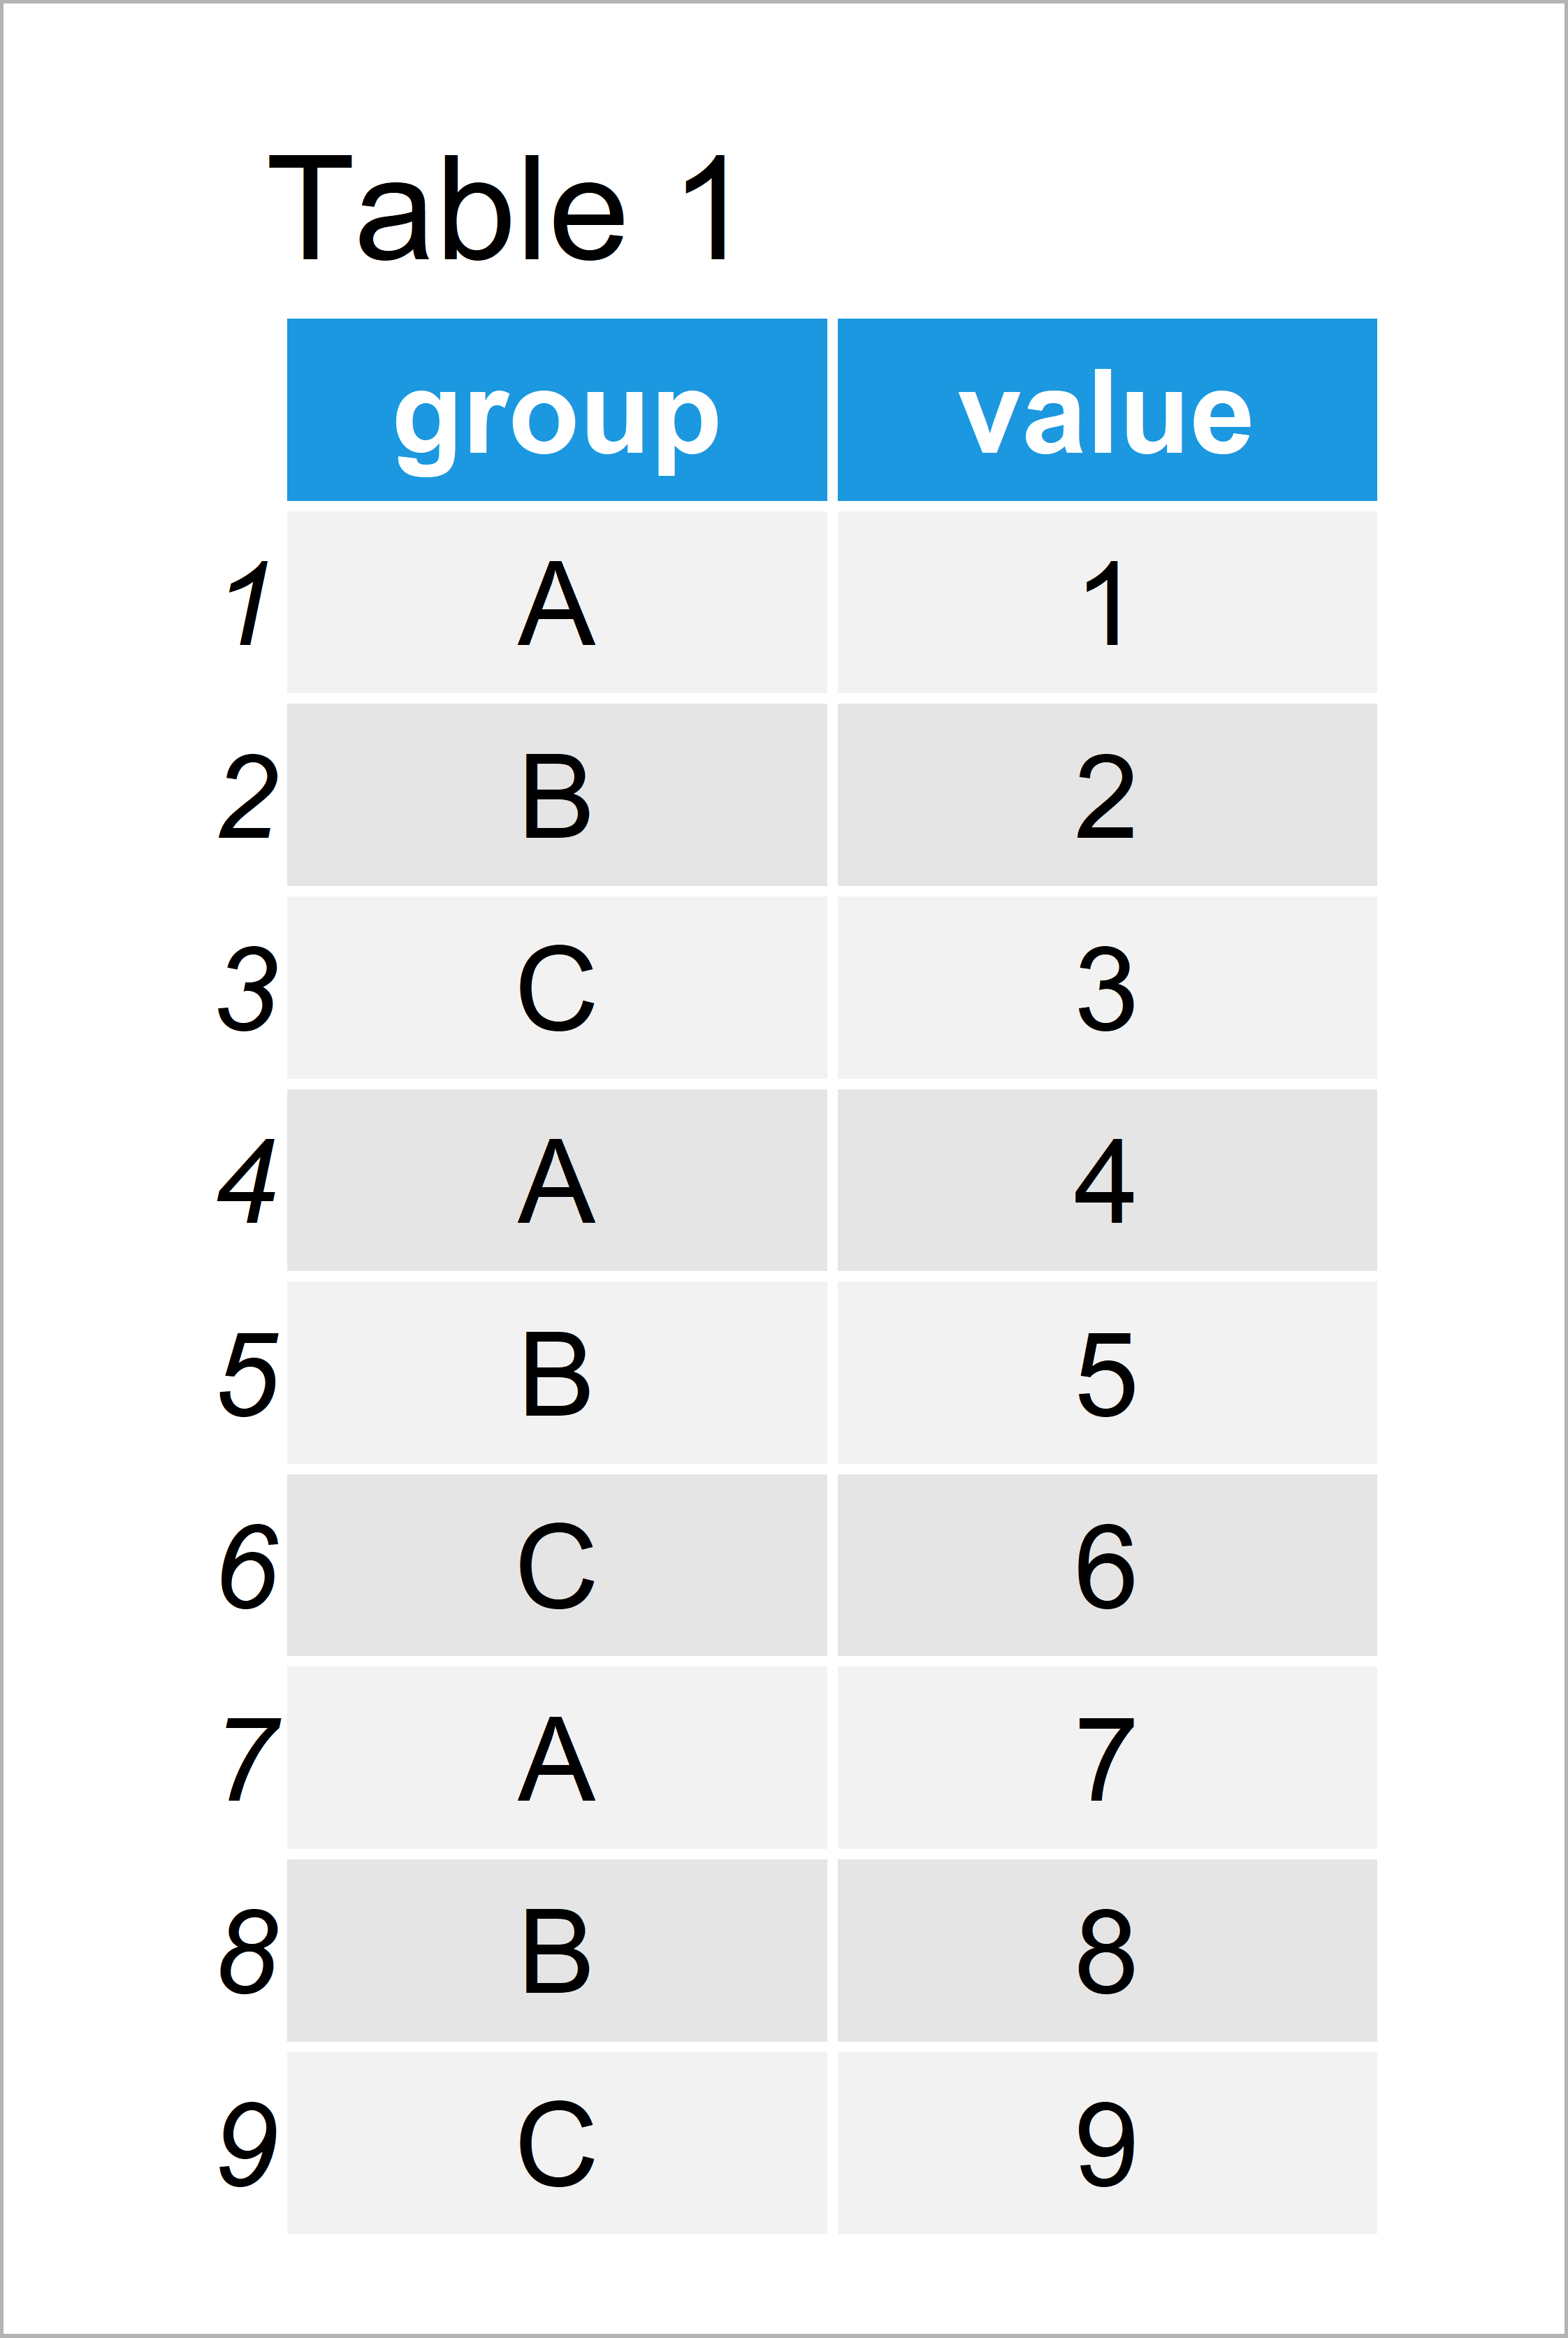
Table 1 illustrates the output of the RStudio console and shows that our example data is constructed of nine rows and two variables.
We also have to install and load the ggplot2 package to R, if we want to use the corresponding functions:
install.packages("ggplot2")                 # Install ggplot2 package
library("ggplot2")                          # Load ggplot2
Now, we can draw a plot (i.e. a boxplot) of the data as shown below:
ggp <- ggplot(data, aes(x = group,          # Create default ggplot2 graph
                        y = value,
                        fill = group)) +
  geom_boxplot()
ggp                                         # Draw default ggplot2 graph
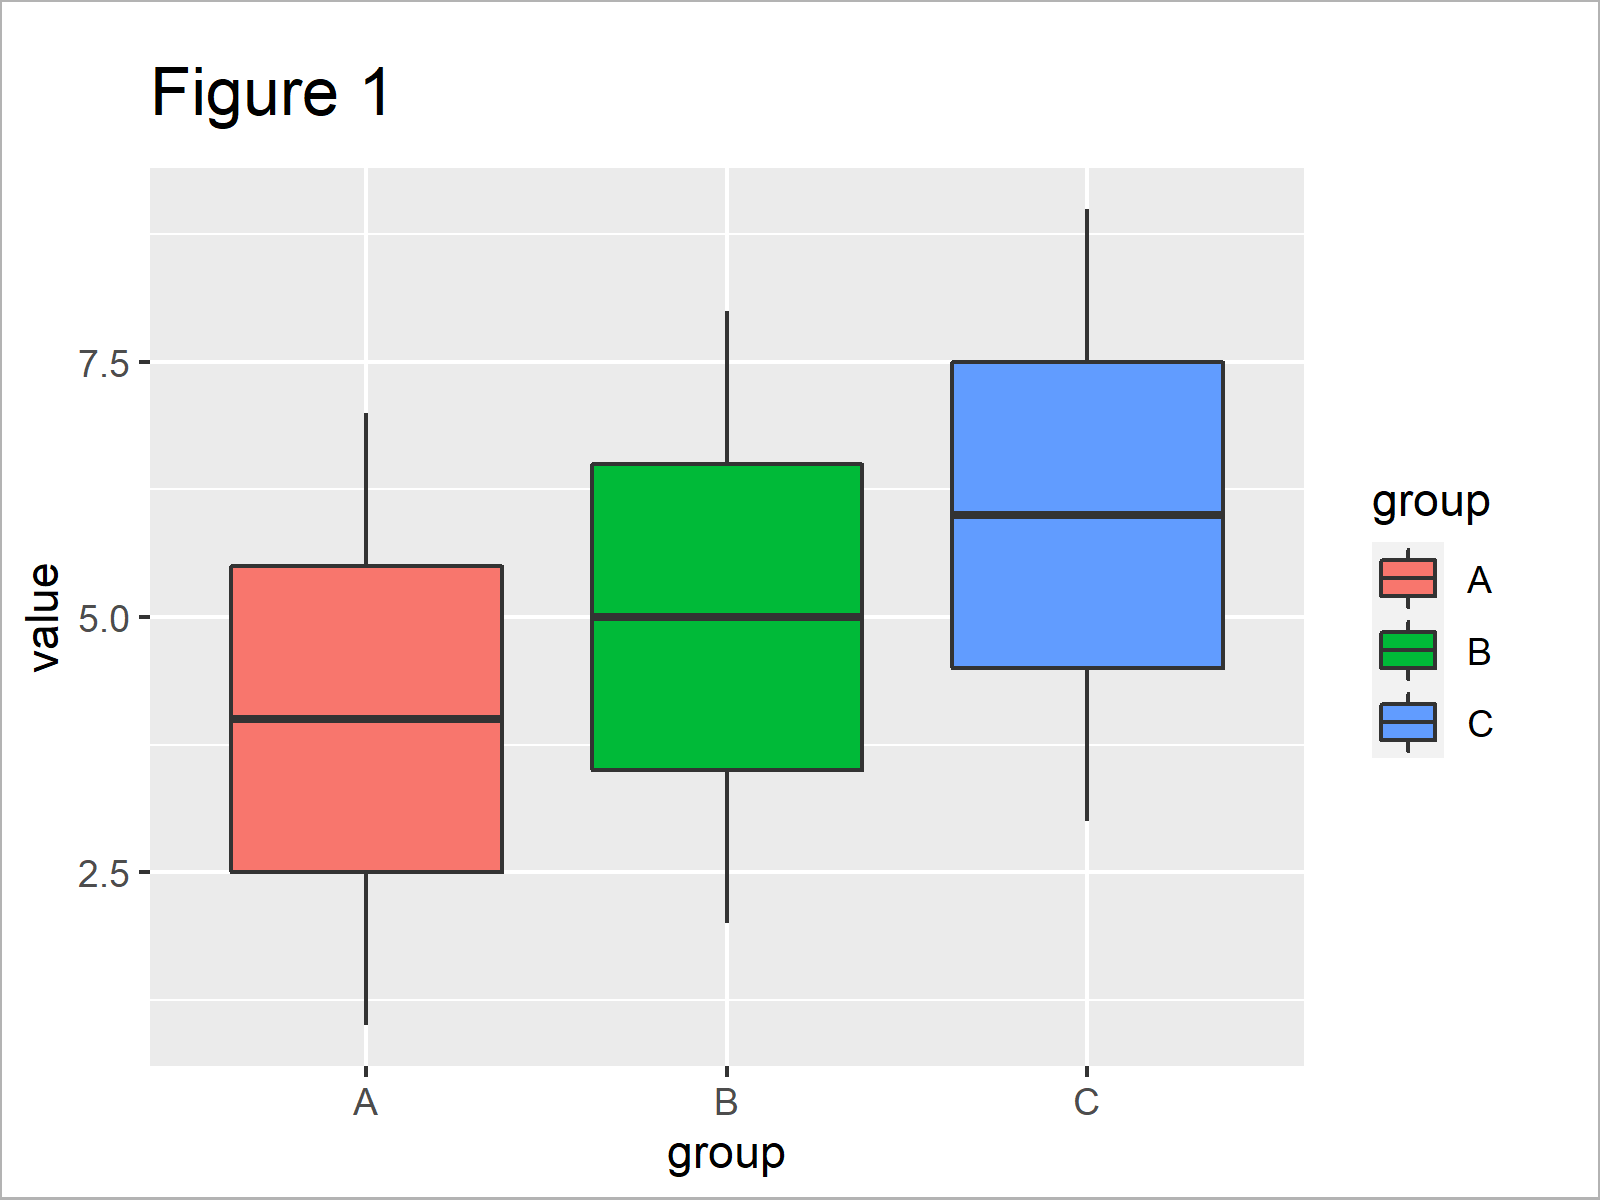
In Figure 1 you can see that we have created a ggplot2 box-and-whisker plot by executing the previous syntax.
Example 1: Reproduce the Warning Message: Scale for ‘fill’ is already present
In this example, I’ll explain how to replicate the ggplot2 warning “Scale for ‘fill’ is already present. Adding another scale for ‘fill’, which will replace the existing scale.” in the R programming language.
Let’s assume that we want to change the filling color and the ordering of the legend of our ggplot2 plot. Then, we might try to apply the scale_fill_manual and scale_fill_discrete functions as shown below:
ggp +                                       # Applying two fill functions
  scale_fill_manual(values = c("#1b98e0", "yellow", "#353436")) +
  scale_fill_discrete(guide = guide_legend(reverse = TRUE))
# Scale for 'fill' is already present. Adding another scale for 'fill', which will replace the existing scale.
Unfortunately, the RStudio console has returned the warning “Scale for ‘fill’ is already present. Adding another scale for ‘fill’, which will replace the existing scale.” after executing the previous R syntax.
Let’s have a look at the ggplot2 graphic that we have created:
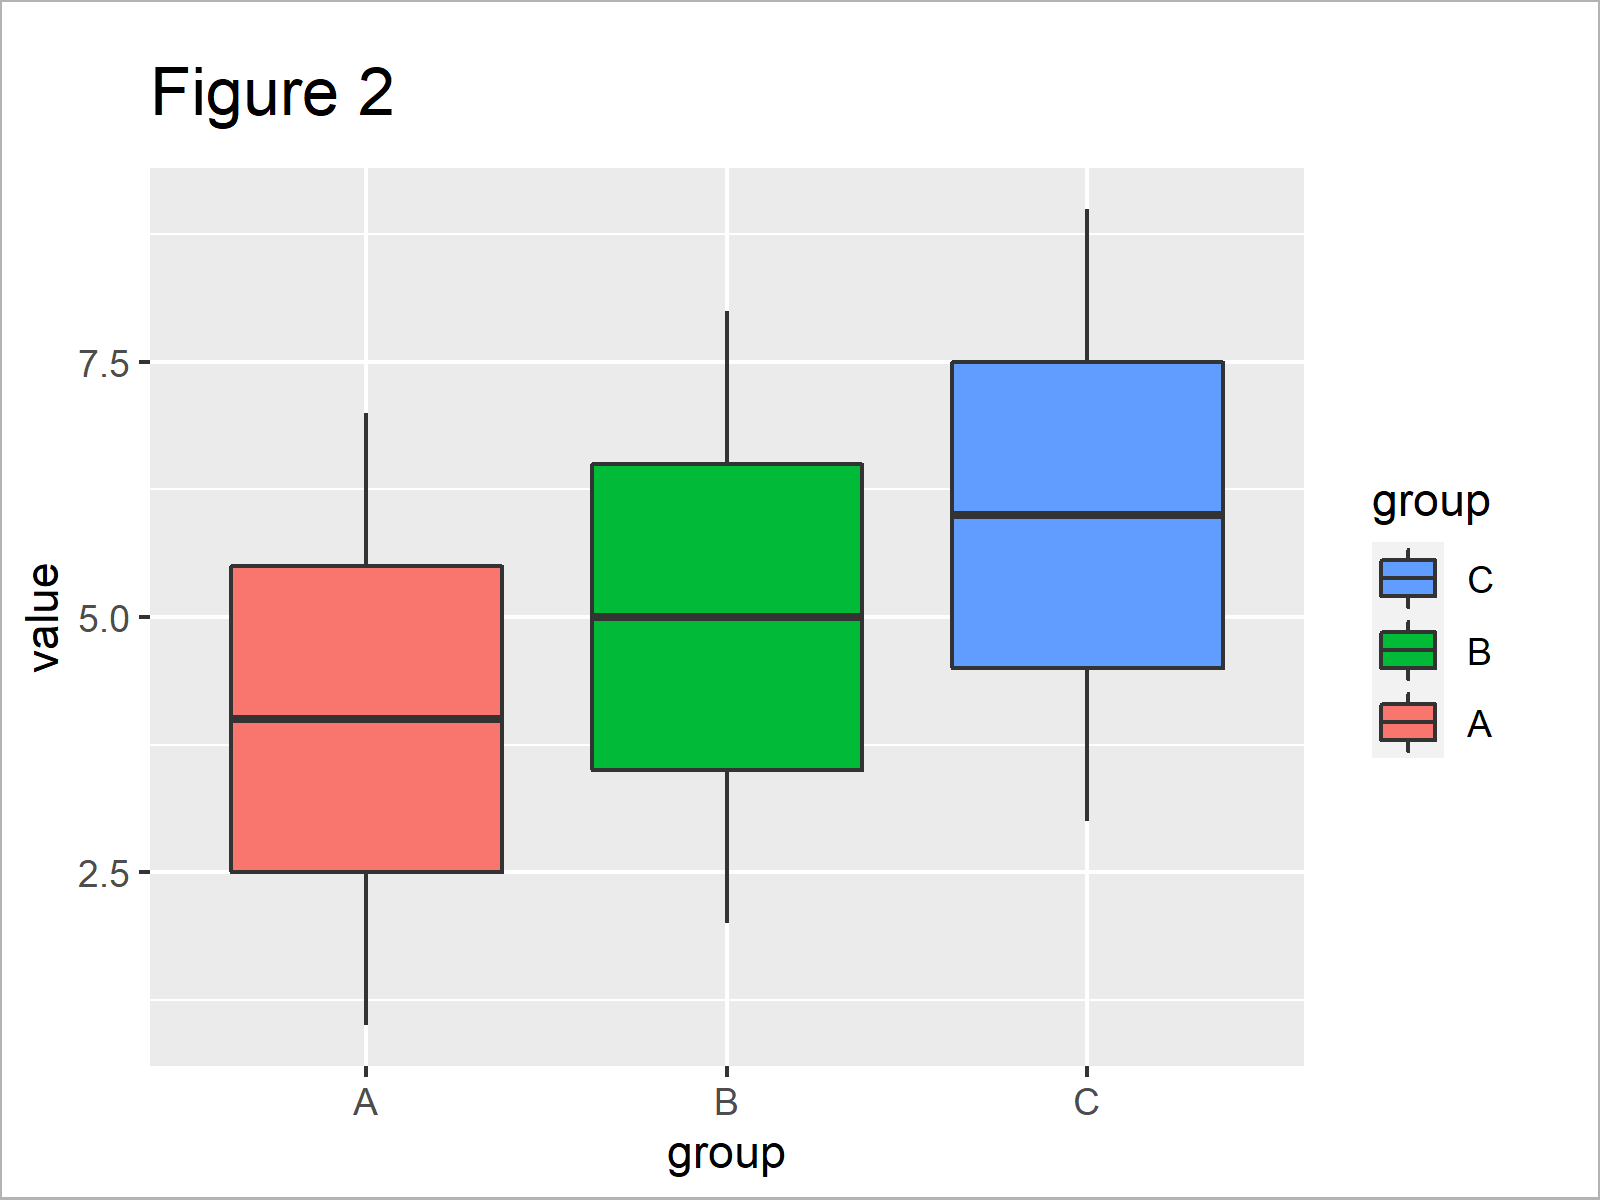
The output of the previous R syntax is shown in Figure 2 – The ordering of the ggplot2 legend was changed, but the color of the boxes were kept the same. Why did this happen?
The reason for this problem is that we have used multiple “fill” functions simultaneously. The ggplot2 package specifies all colors at the same time. So if we add multiple functions of the same type, ggplot2 gets confused.
But how can we debug this? Keep on reading!
Example 2: Fix the Warning Message: Scale for ‘fill’ is already present
This example shows how to avoid the warning message “Scale for ‘fill’ is already present. Adding another scale for ‘fill’, which will replace the existing scale.”.
For this task, we have to specify all fill options within the same function, i.e. scale_fill_manual:
ggp +                                       # Applying only one fill function
  scale_fill_manual(values = c("#1b98e0", "yellow", "#353436"),
                    guide = guide_legend(reverse = TRUE))
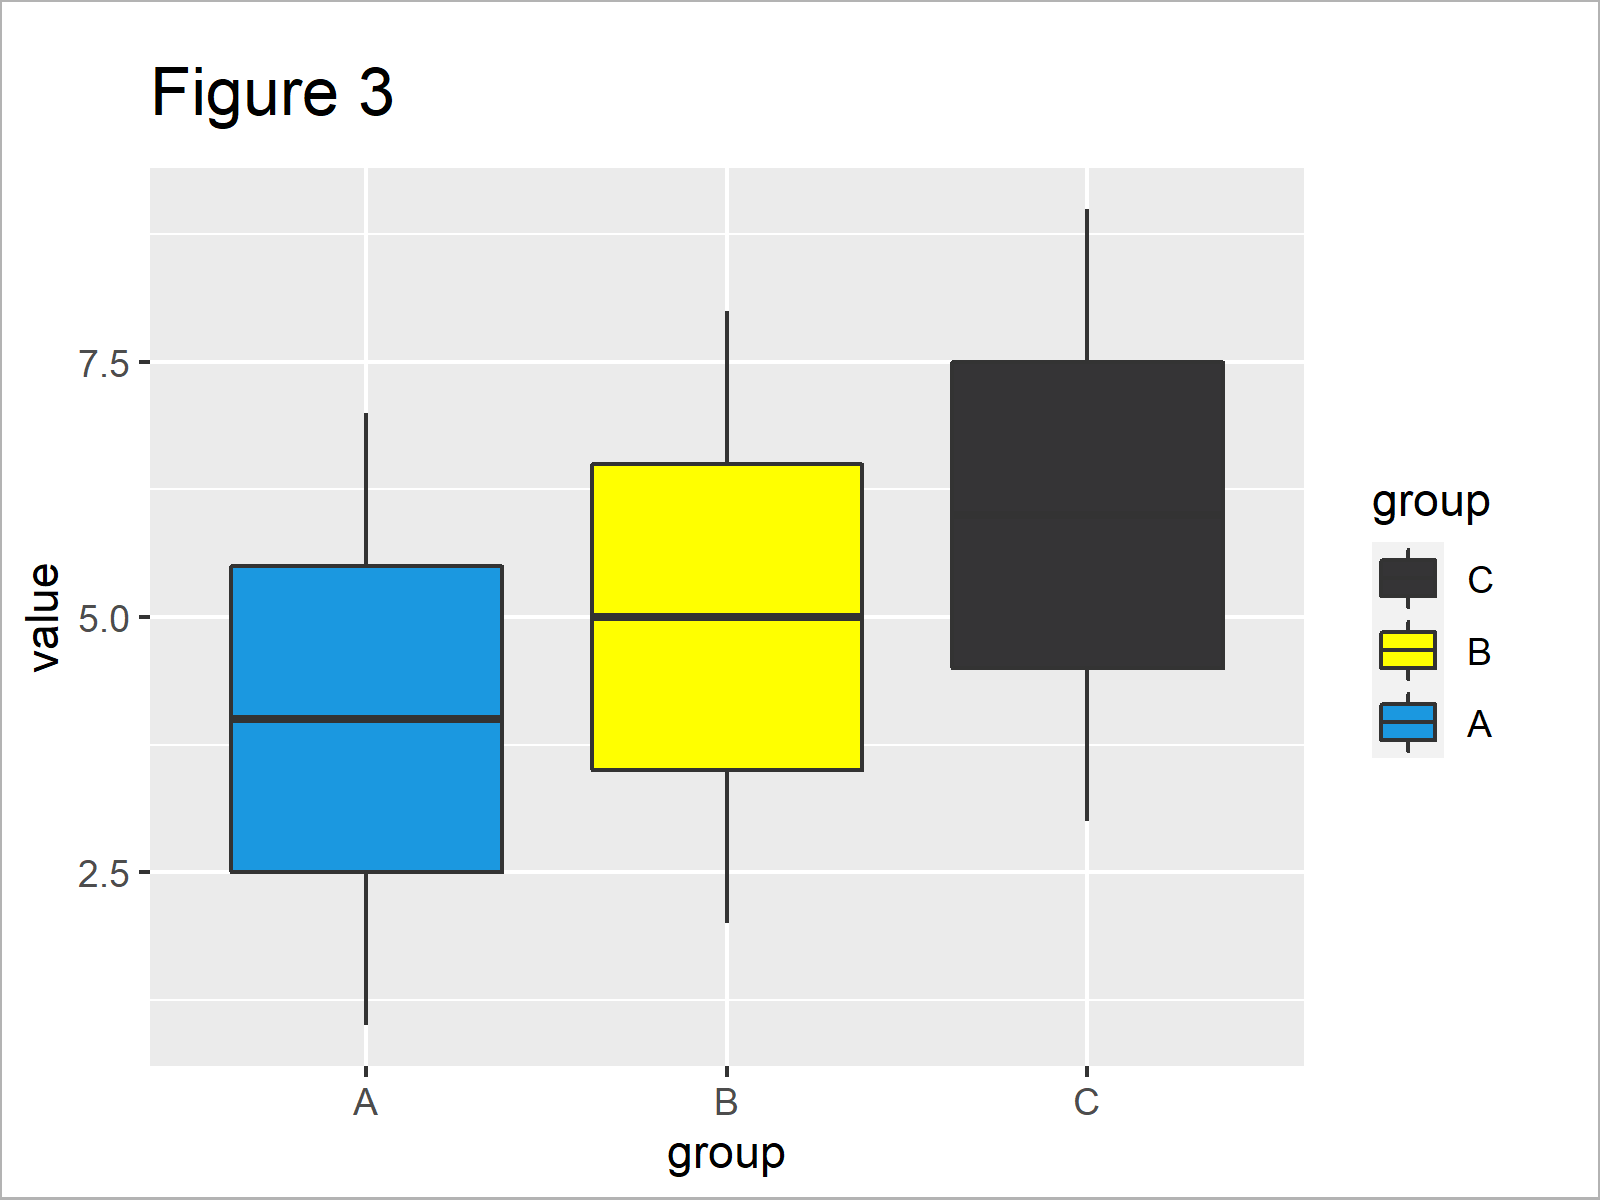
After executing the previous syntax the ggplot2 boxplot shown in Figure 3 has been created. As you can see, both the fill color and the ordering of the legend were changed.
Video & Further Resources
If you are interested in data visualization in R and the functions of the ggplot2 package, you have to watch the following video, where I explain the ggplot2 package in much more detail (beginners & advanced users).
In addition, you could have a look at the other tutorials on this website.
- ggplot2 Error: Discrete Value Supplied to Continuous Scale
- Draw ggplot2 Plot with Two Y-Axes
- Transform ggplot2 Plot Axis to log10 Scale
- Dealing with Errors & Warnings in R (Overview)
- Graphics in R
- R Programming Examples
This tutorial has explained how to deal with “Scale for ‘fill’ is already present. Adding another scale for ‘fill’, which will replace the existing scale.” in the R programming language.
Please note that similar warning messages can appear for other ggplot2 settings (e.g. color). Furthermore, please note that this warning message can also occur when drawing other types of graphics using the ggplot2 package (e.g. barcharts).
If you have further questions, let me know in the comments section.


2 Comments. Leave new
Can anyone help me with the following message:
“Scale for ‘fill’ is already present. Adding another scale for ‘fill’, which will replace the existing
scale”.
Basically, my code is:
mylevelsq11=c(“Muito satisfeito”,”Satisfeito”,”Nem um nem outro”,”Insatisfeito”,
“Muito insatisfeito”)
resultq11=likert(df1.reverse[,1,drop=FALSE], grouping = df1.reverse[,3])
Fig11=plot(resultq11, centered=TRUE,text.color = “black”,text.size=2,
wrap = ifelse(is.null(df1$grouping), 55, 120),
group.order=c(“Menor que 1 salário mínimo (R$ 1.100,00)”,
“De 1 a 3 salários mínimos (R$ 1.100,01 a 3.300,00)”,
“De 3 a 5 salários mínimos (R$ 3.300,01 a 5.500,00)”,
“De 5 a 7 salários mínimos (R$ 5.500,01 a 7.700,00)”,
“Maior que 7 salários mínimos (R$ 7.700,01)”),legend.position=”right”)+
theme(axis.text=element_text(size=8))+
scale_fill_manual(values = brewer.pal(n=5,”RdYlBu”), breaks = mylevelsq11,
guide_legend(title=”Responses:”, reverse = FALSE))
Thanks a lot.
Hey Marcus,
It seems like you are trying to mix Base R and the ggplot2 package, i.e. the plot() function from Base R and theme(), scale_fill_manual(), as well as guide_legend() from ggplot2.
You would have to decide if you want to draw a Base R graph or a ggplot2 graph and then modify your code accordingly.
I hope that helps!
Joachim