theme_light ggplot2 Theme in R (6 Examples)
On this page, I’ll illustrate how to change the ggplot2 theme to the theme_light in the R programming language.
The article will contain these contents:
If you want to know more about these topics, keep reading!
Example Data & Software Packages
Consider the following example data:
set.seed(7721236)                          # Set random seed
data <- data.frame(x = rnorm(100),         # Create example data frame
                   y = rnorm(100),
                   group = LETTERS[1:5])
head(data)                                 # Print head of example data frame
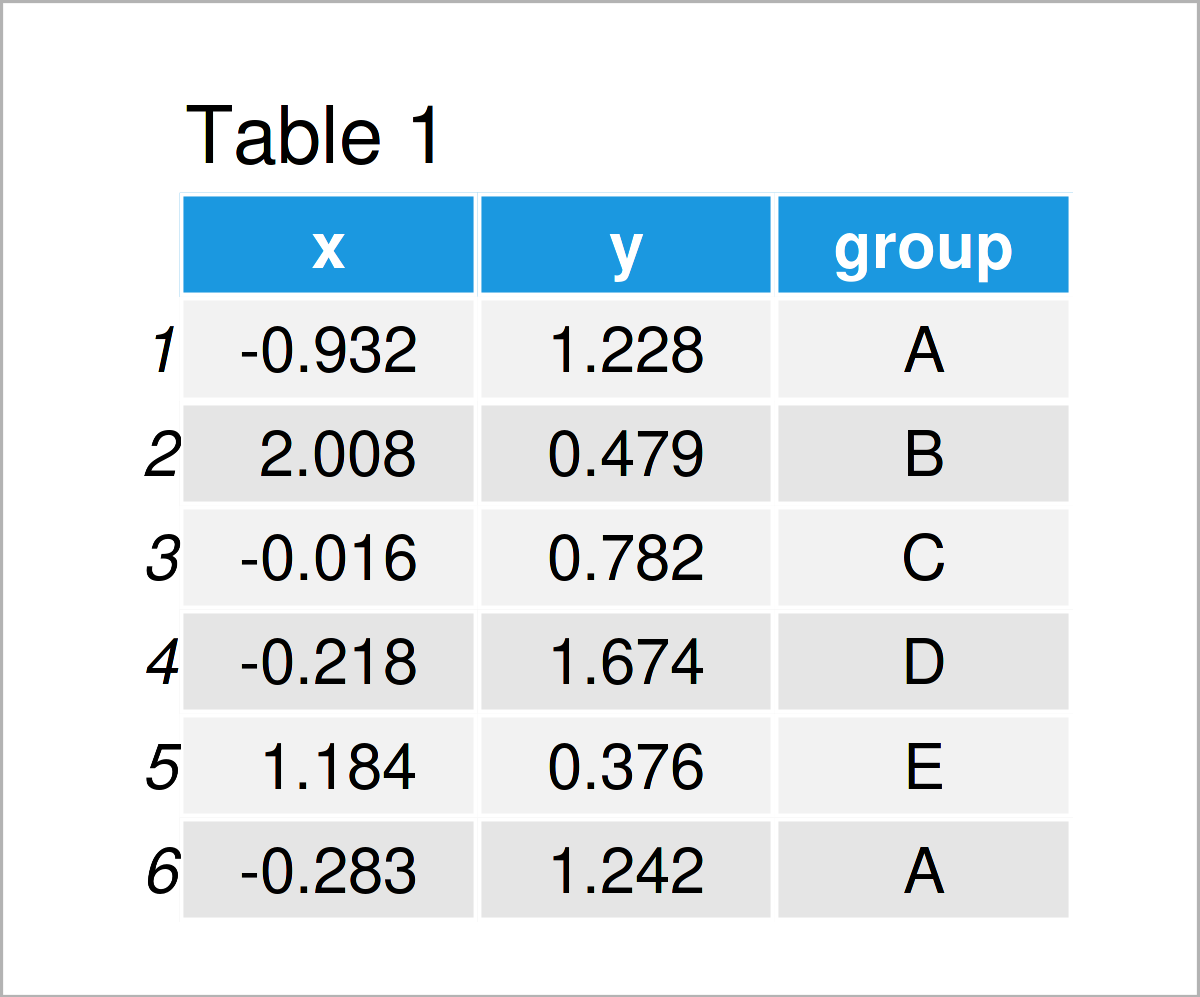
As you can see based on Table 1, our example data is a data frame containing three columns.
In order to use the functions of the ggplot2 software package, we also need to install and load ggplot2:
install.packages("ggplot2")                # Install ggplot2 package
library("ggplot2")                         # Load ggplot2 package
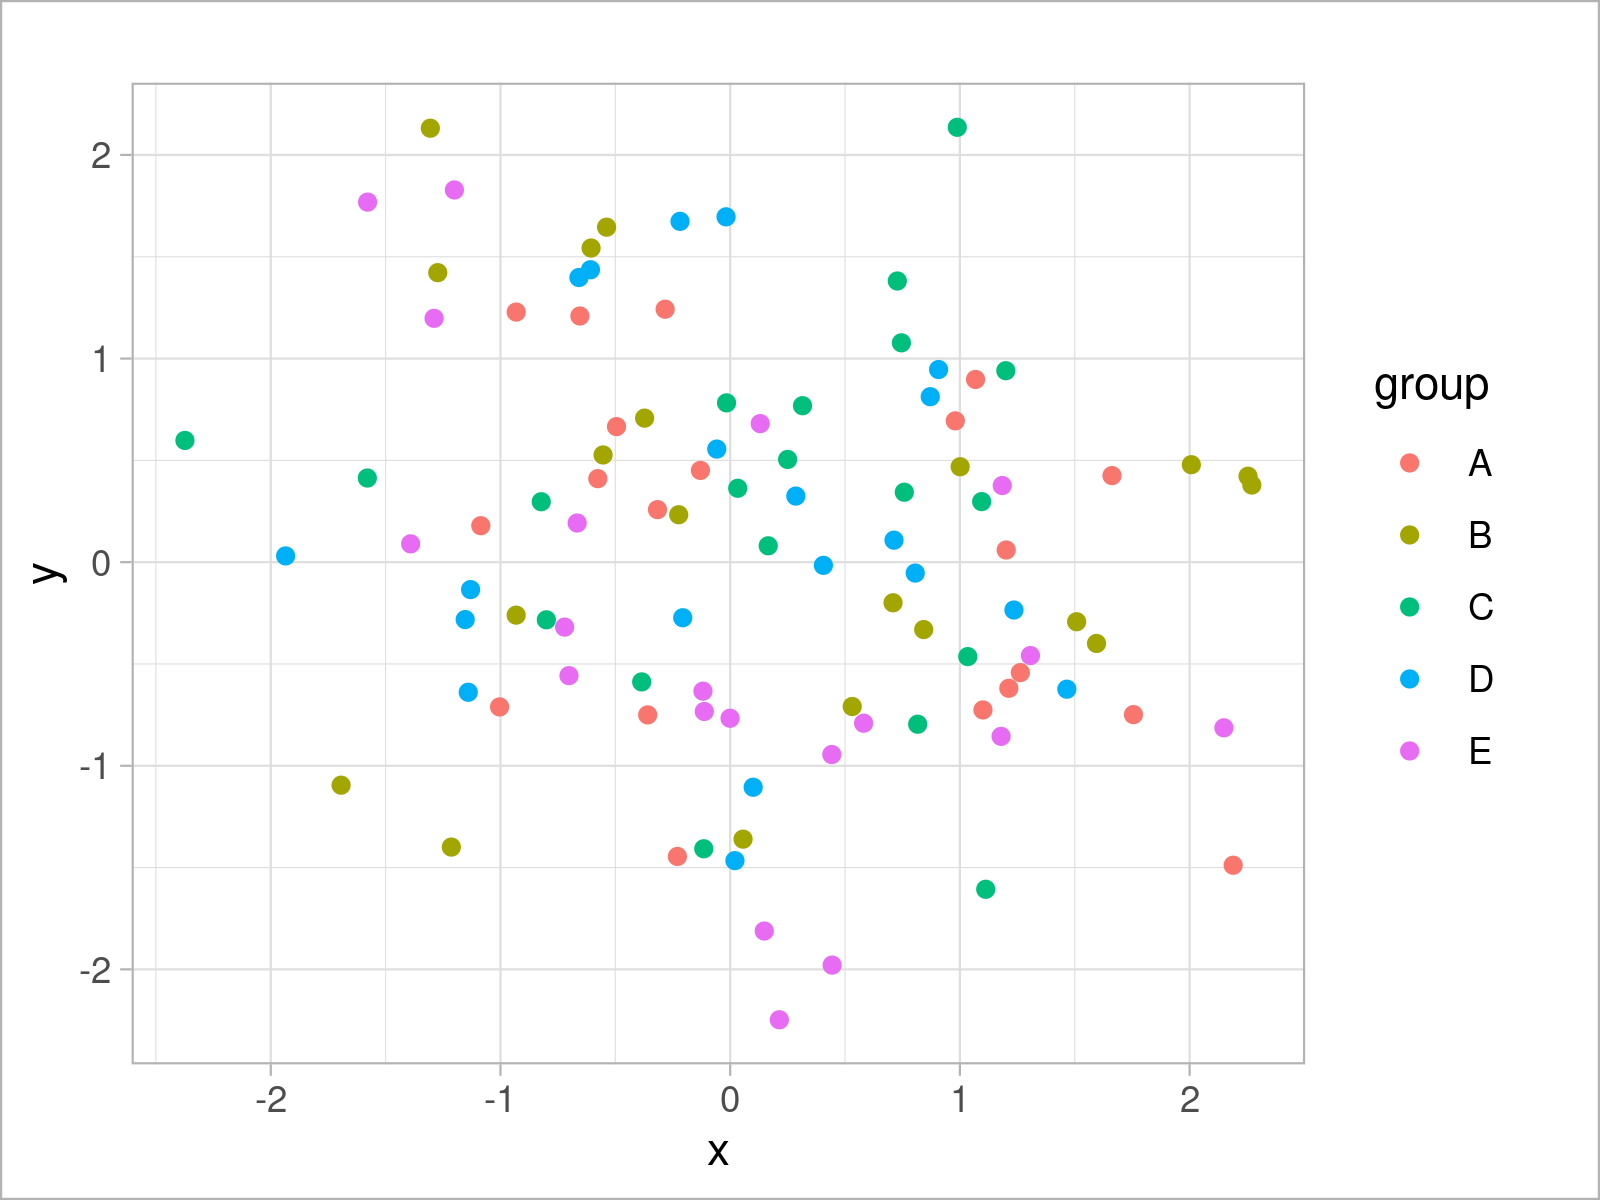
Example 1: Draw ggplot2 Scatterplot Using theme_light()
ggplot(data,                               # theme_light scatterplot
       aes(x = x,
           y = y,
           col = group)) +
  geom_point() +
  theme_light()
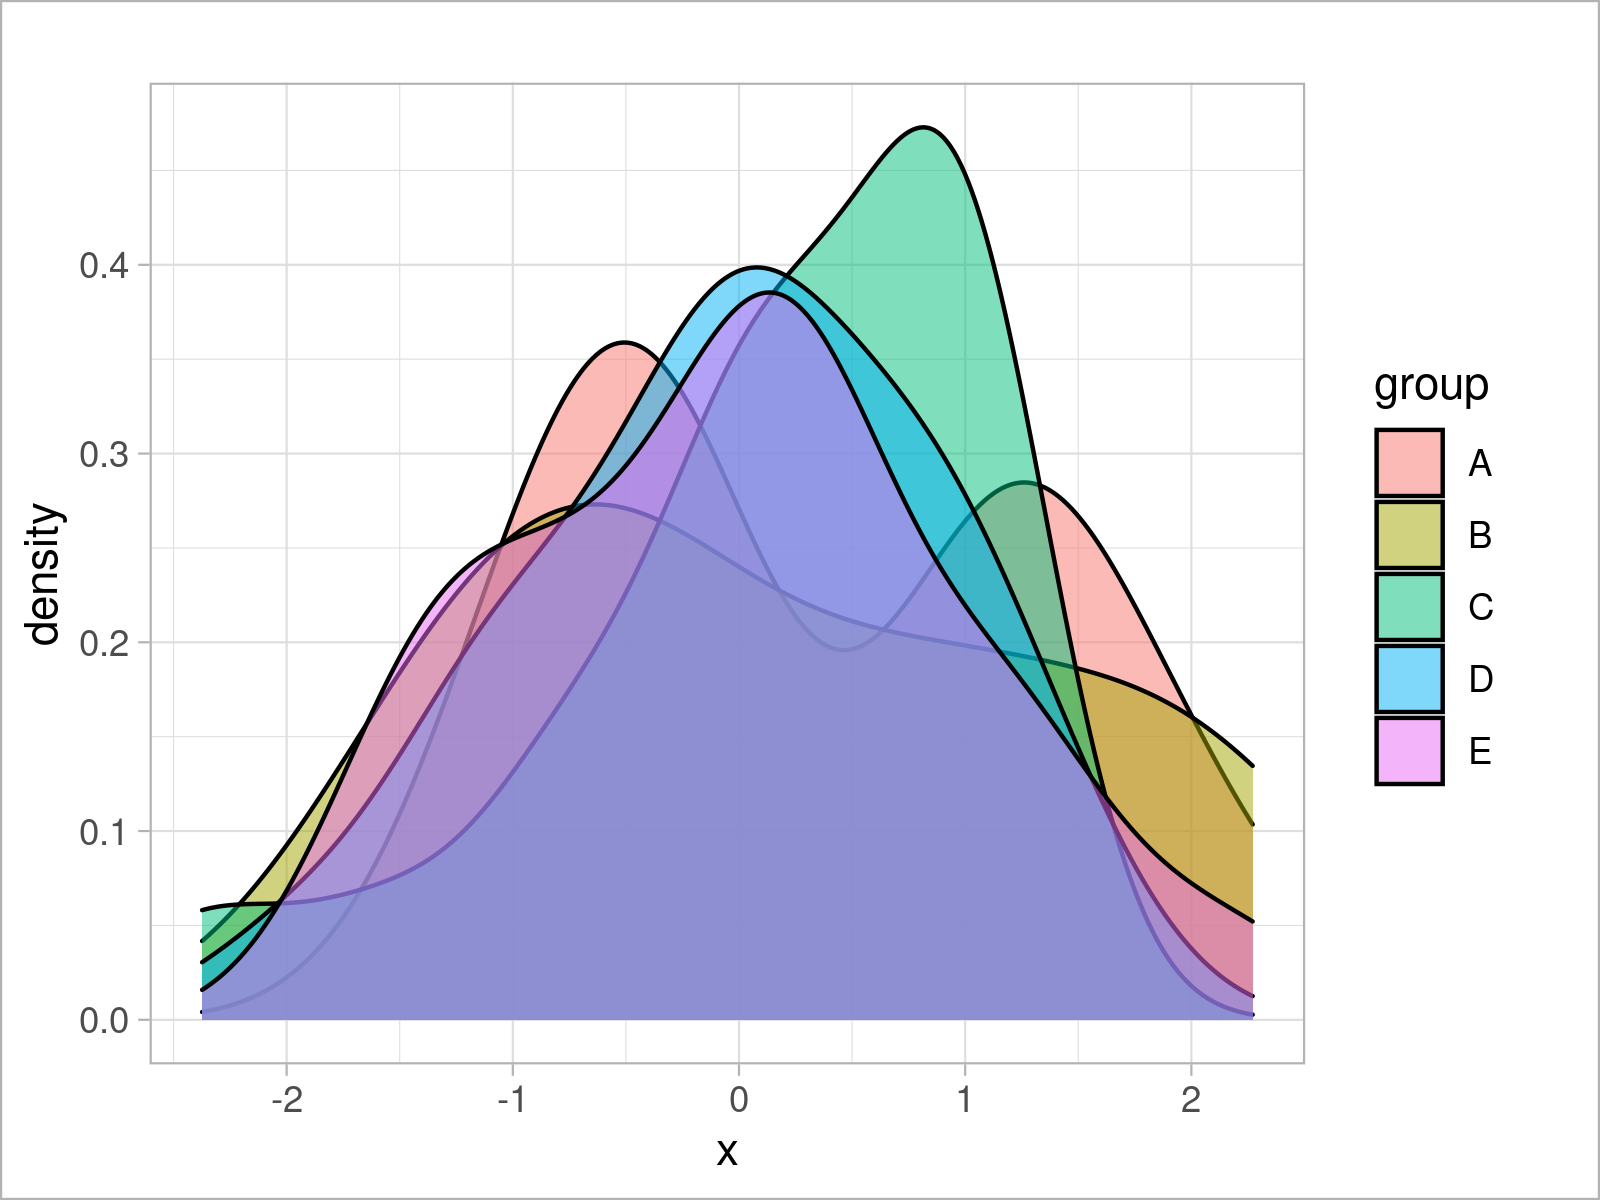
Example 2: Draw ggplot2 Density Plot Using theme_light()
ggplot(data,                               # theme_light density plot
       aes(x = x,
           fill = group)) +
  geom_density(alpha = 0.5) +
  theme_light()
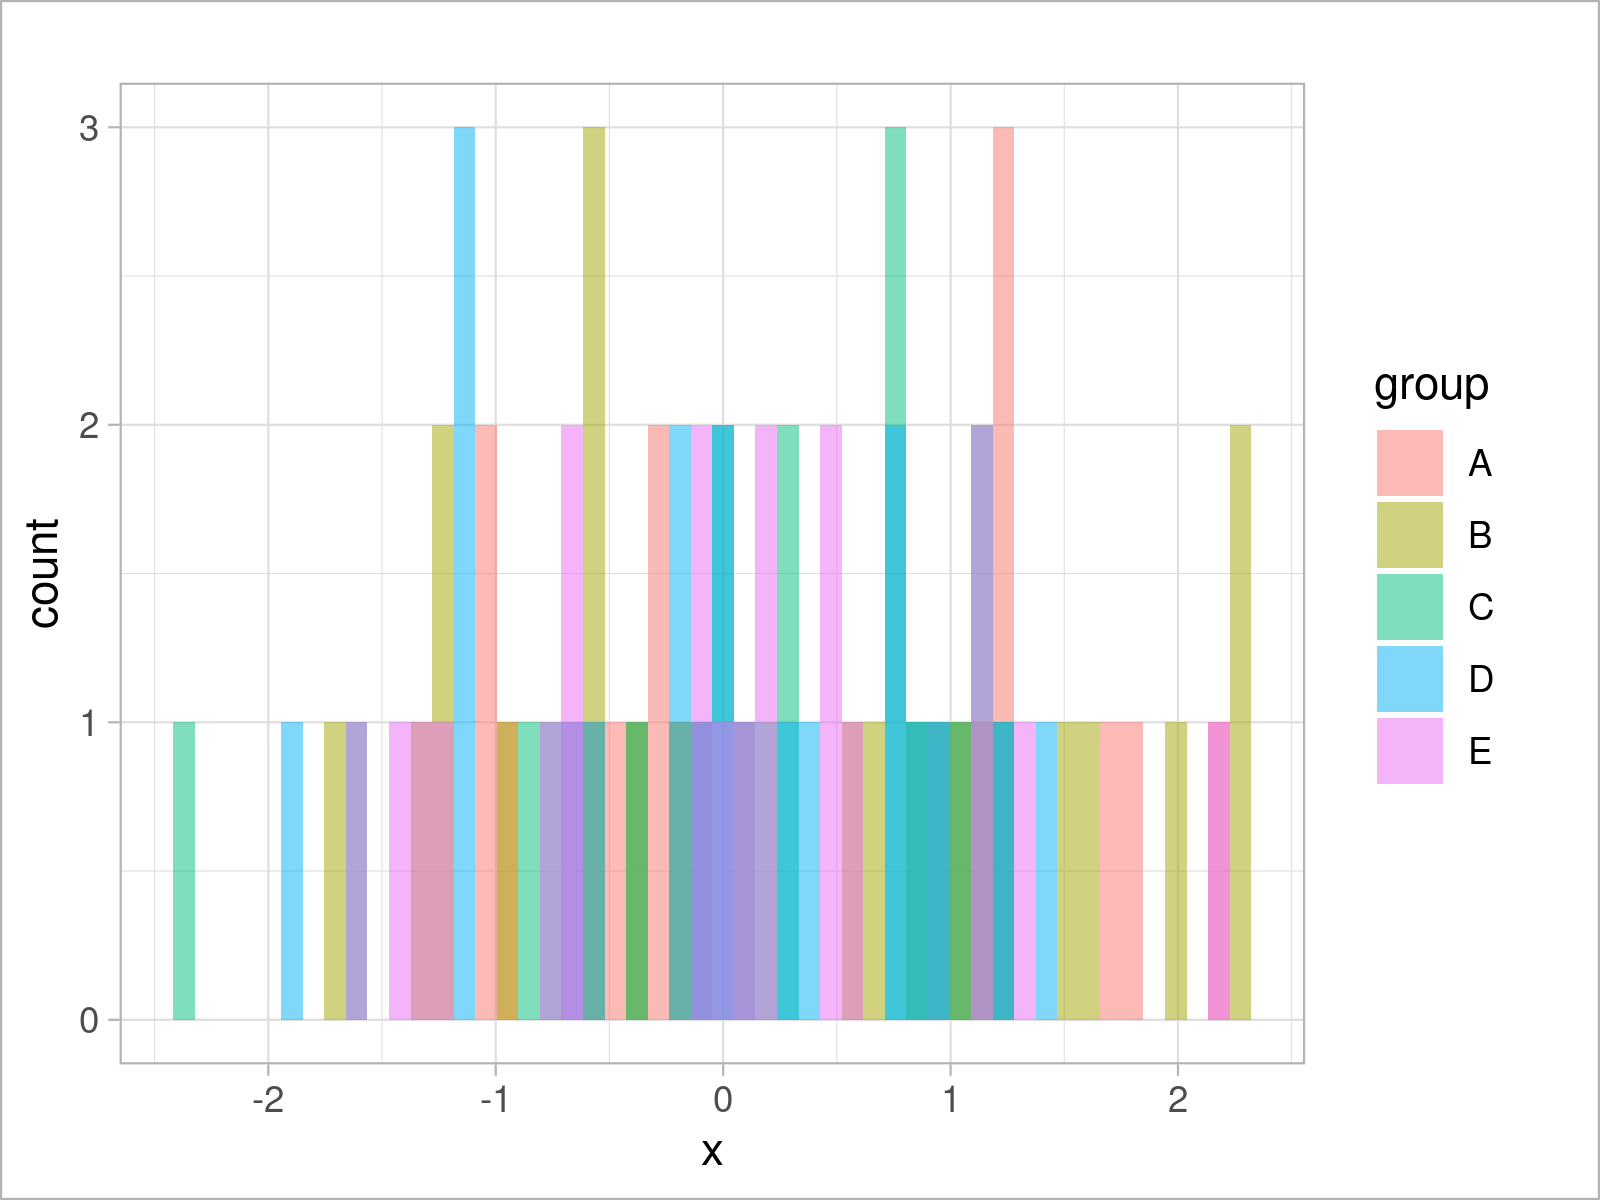
Example 3: Draw ggplot2 Histogram Using theme_light()
ggplot(data,                               # theme_light histogram
       aes(x = x,
           fill = group)) +
  geom_histogram(alpha = 0.5,
                 position = "identity",
                 bins = 50) +
  theme_light()
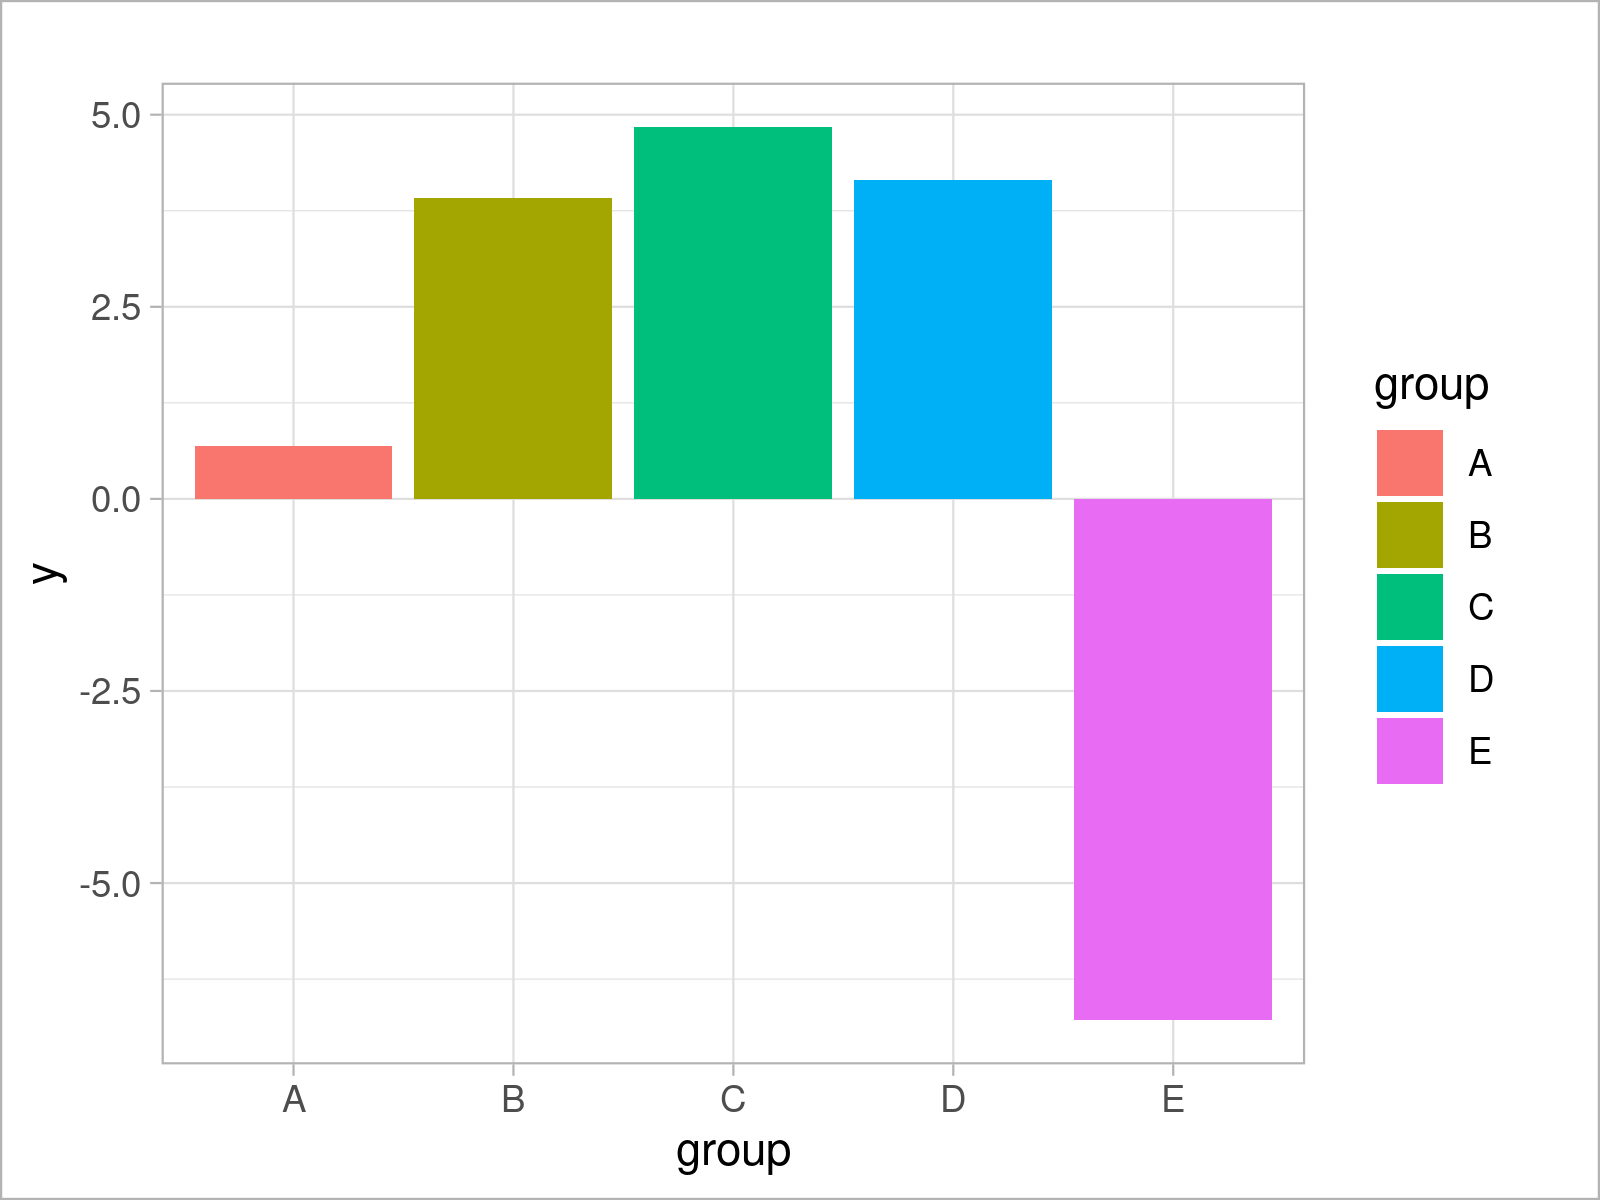
Example 4: Draw ggplot2 Barchart Using theme_light()
ggplot(aggregate(y ~ group, data, sum),    # theme_light barplot
       aes(x = group,
           y = y,
           fill = group)) +
  geom_bar(stat = "identity") +
  theme_light()
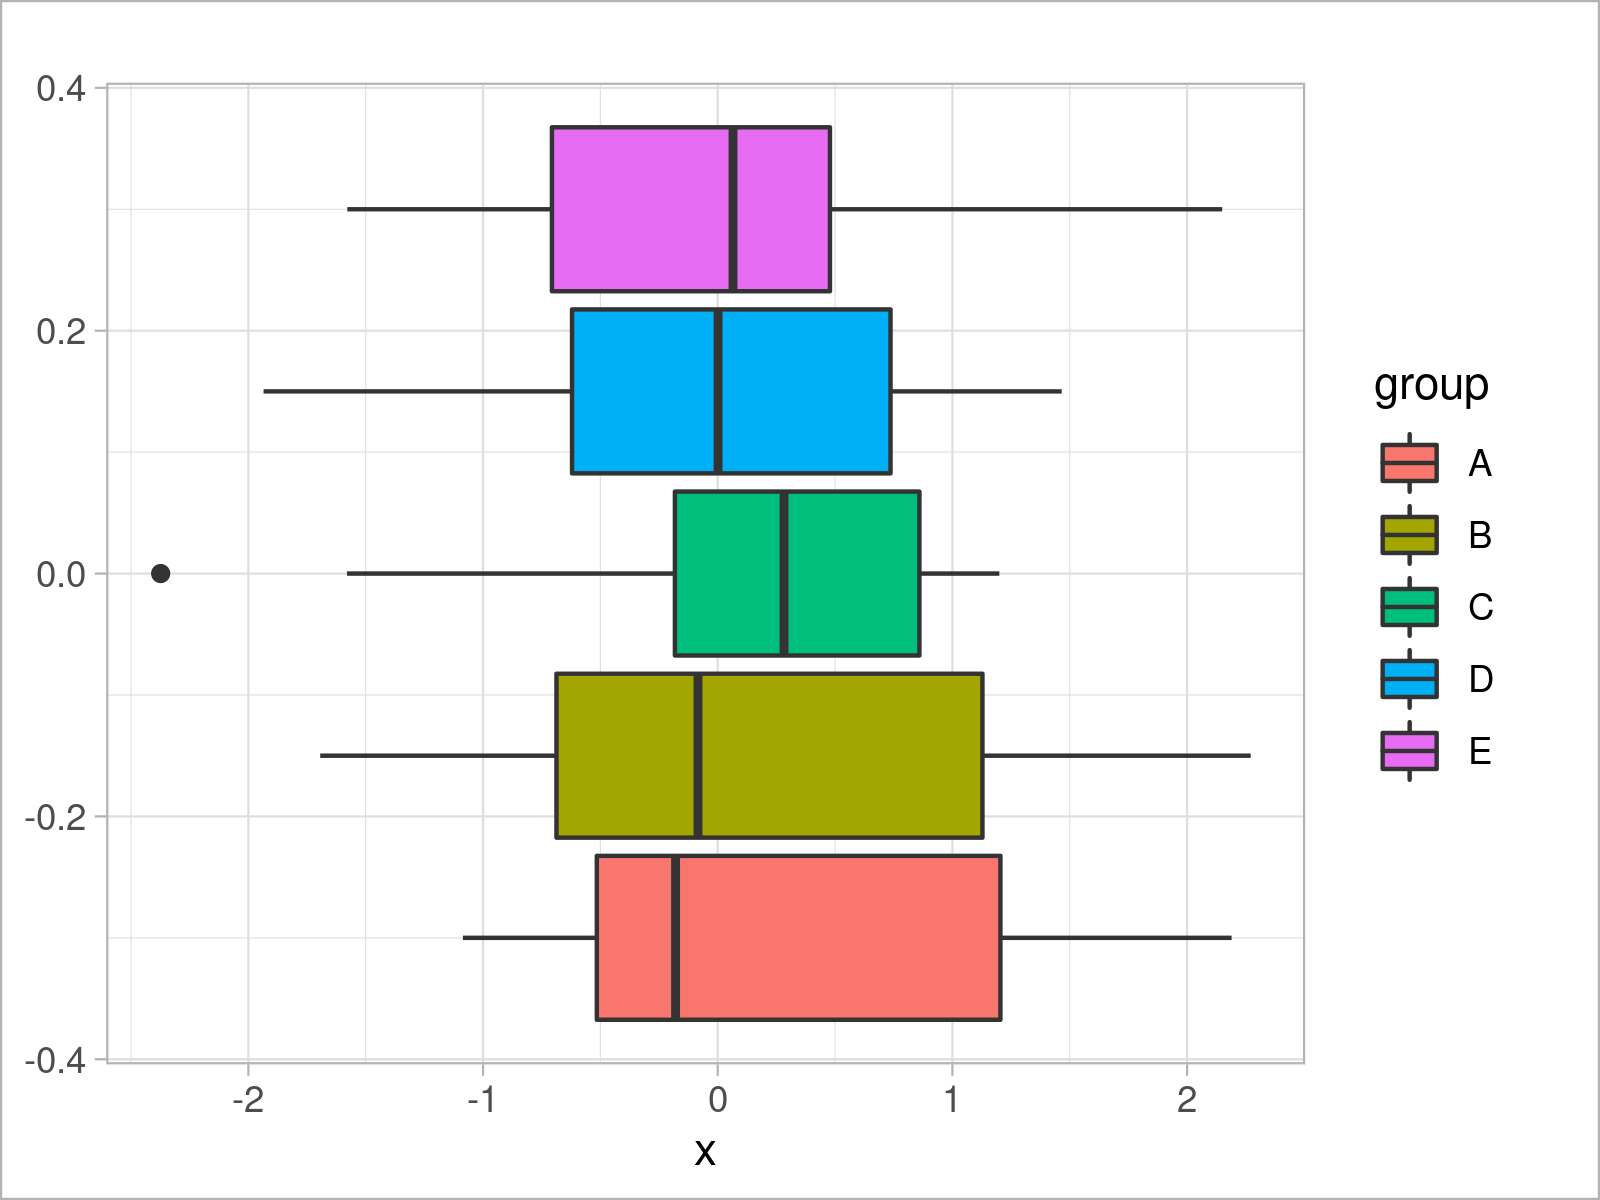
Example 5: Draw ggplot2 Boxplot Using theme_light()
ggplot(data,                               # theme_light boxplot
       aes(x = x,
           fill = group)) +
  geom_boxplot() +
  theme_light()
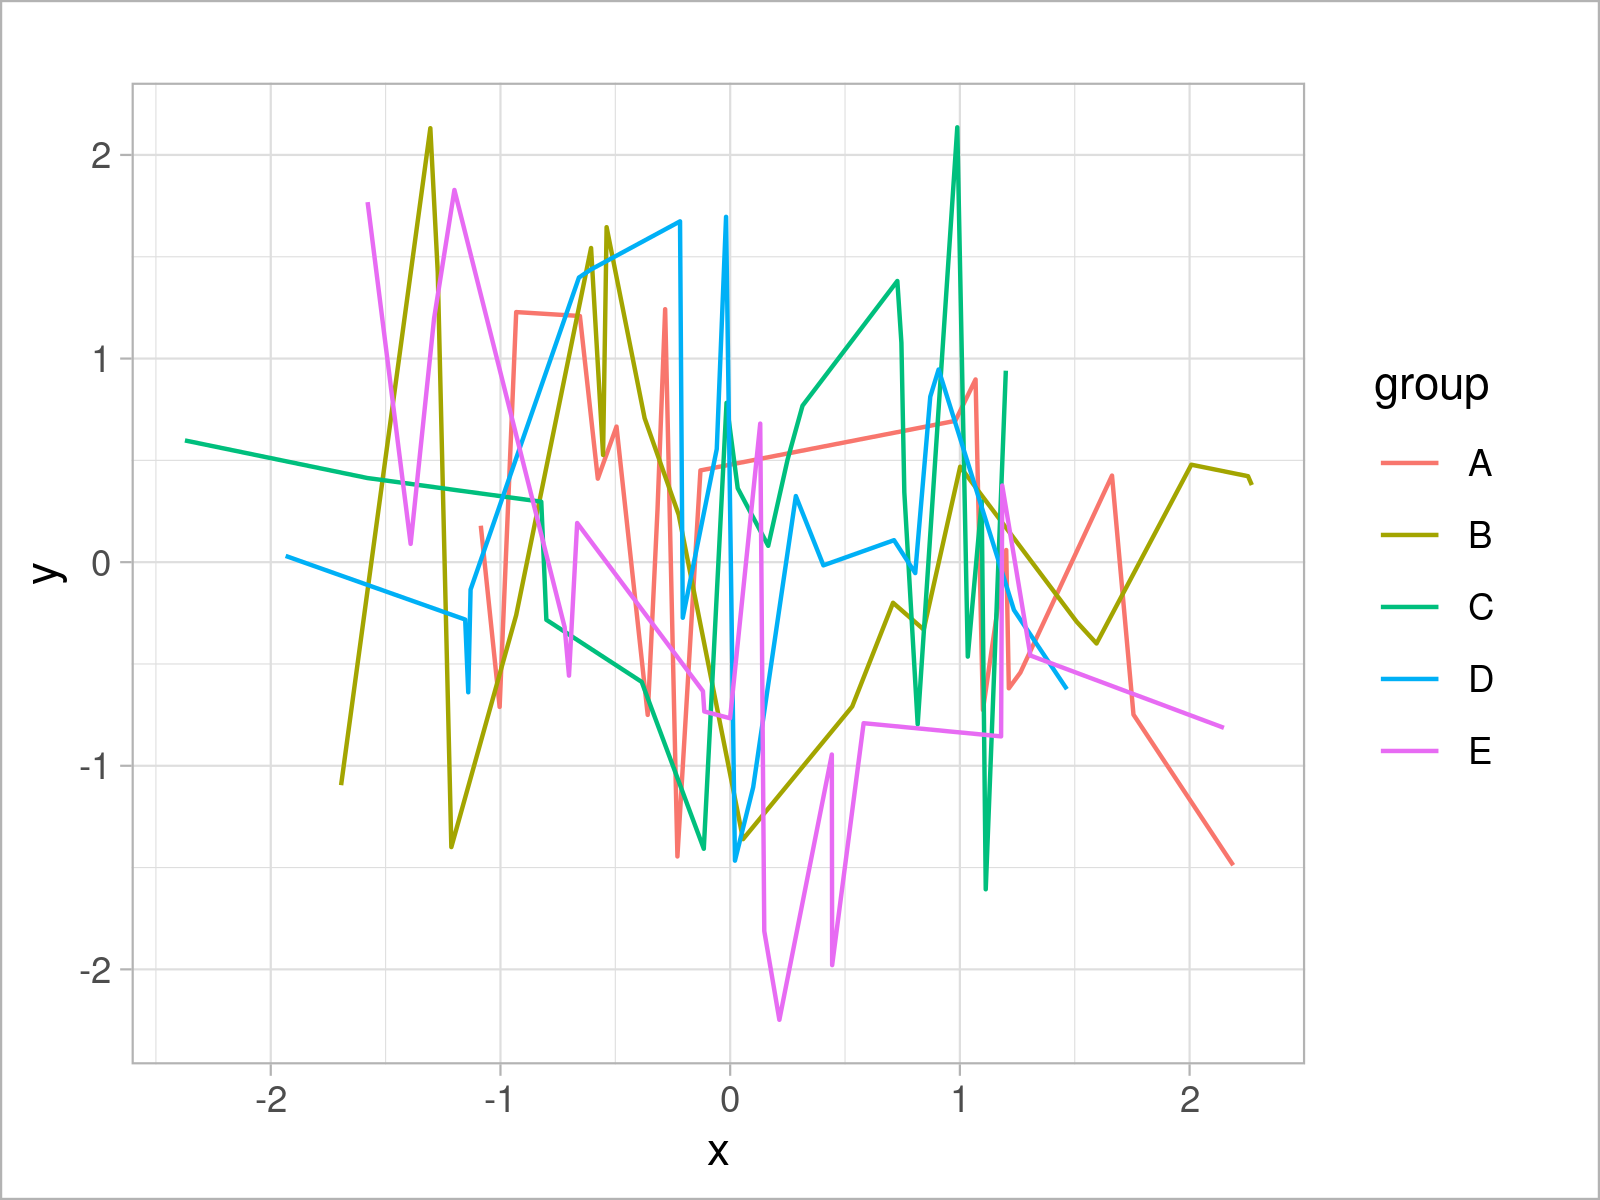
Example 6: Draw ggplot2 Line Plot Using theme_light()
ggplot(data,                               # theme_light line plot
       aes(x = x,
           y = y,
           col = group)) +
  geom_line() +
  theme_light()
Video & Further Resources
The ggplot2 package has of course much more of useful and awesome functions and opportunities when it comes to data visualization in R. May you have a look at the following introduction video on my my YouTube channel.
On Statistics Globe, you can also find instructions on how to draw different kinds of plots such as scatterplots, density plots, barcharts, boxplots, histograms, and line plots using different ggplot2 themes:
- theme_bw
- theme_classic
- theme_dark
- theme_economist [ggthemes Package]
- theme_gray
- theme_linedraw
- theme_minimal
- theme_test
- theme_void
In addition to that, you may have a look at the introductions to other add-on packages that contain extra themes for ggplot2 plots:
Furthermore, you may have a look at some of the related articles on https://statisticsglobe.com/:
Summary: In this R programming tutorial you have learned how to apply the theme_light function to adjust the design and layout of a ggplot2 plot. Let me know in the comments, in case you have any additional comments or questions.


