theme_void ggplot2 Theme in R (6 Examples) | Blank Theme for Graphic
This post shows how to set the ggplot2 theme to the theme_void in R programming.
The tutorial will contain six examples for the application of the theme_void ggplot2 theme. To be more specific, the tutorial contains the following topics:
Let’s start right away.
Example Data & Software Packages
Consider the example data below.
set.seed(12233665)                         # Set random seed
data <- data.frame(x = rnorm(160),         # Create example data frame
                   y = rnorm(160),
                   group = LETTERS[1:4])
head(data)                                 # Print head of example data frame
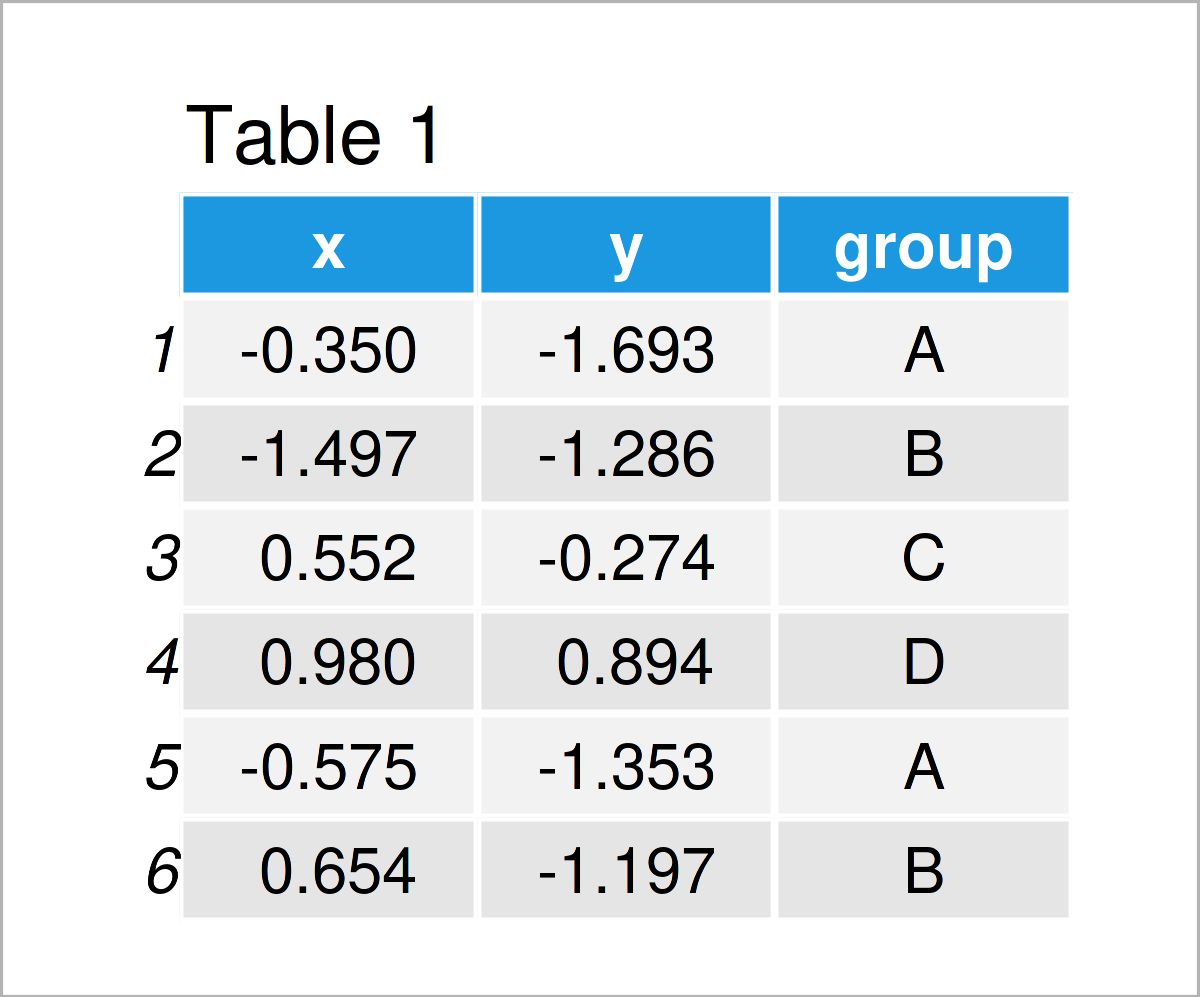
Table 1 shows that our exemplifying data comprises three columns. The variables x and y are numerical and the variable group is a character.
We also have to install and load the ggplot2 package to R, to be able to use the corresponding functions:
install.packages("ggplot2")                # Install & load ggplot2
library("ggplot2")
In this tutorial, we’ll use the theme_void theme to create our ggplot2 plots. The main characteristic of this theme is that it shows only the absolutely relevant plot components. Most of the less necessary metrics and components of the graph are removed.
Let’s draw different ggplot2 plots using the theme_void theme!
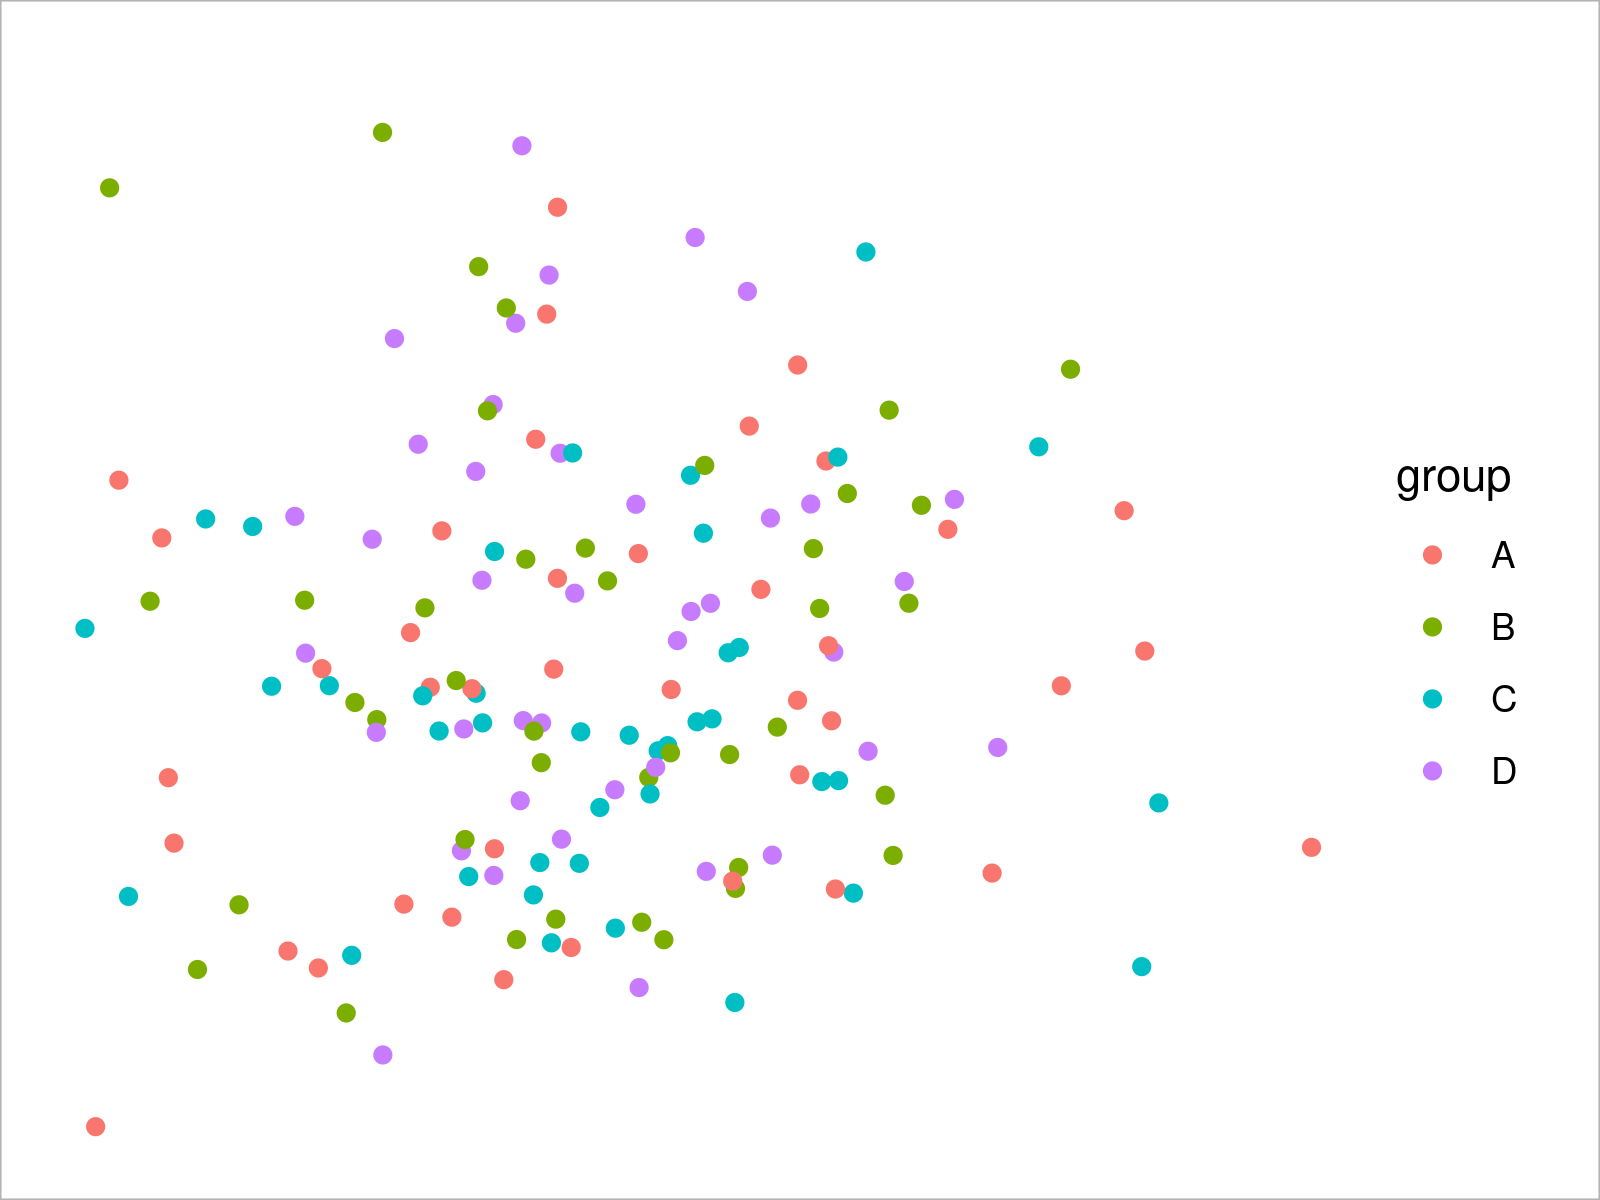
Example 1: Draw ggplot2 Scatterplot Using theme_void()
ggplot(data,                               # theme_void scatterplot
       aes(x = x,
           y = y,
           col = group)) +
  geom_point() +
  theme_void()
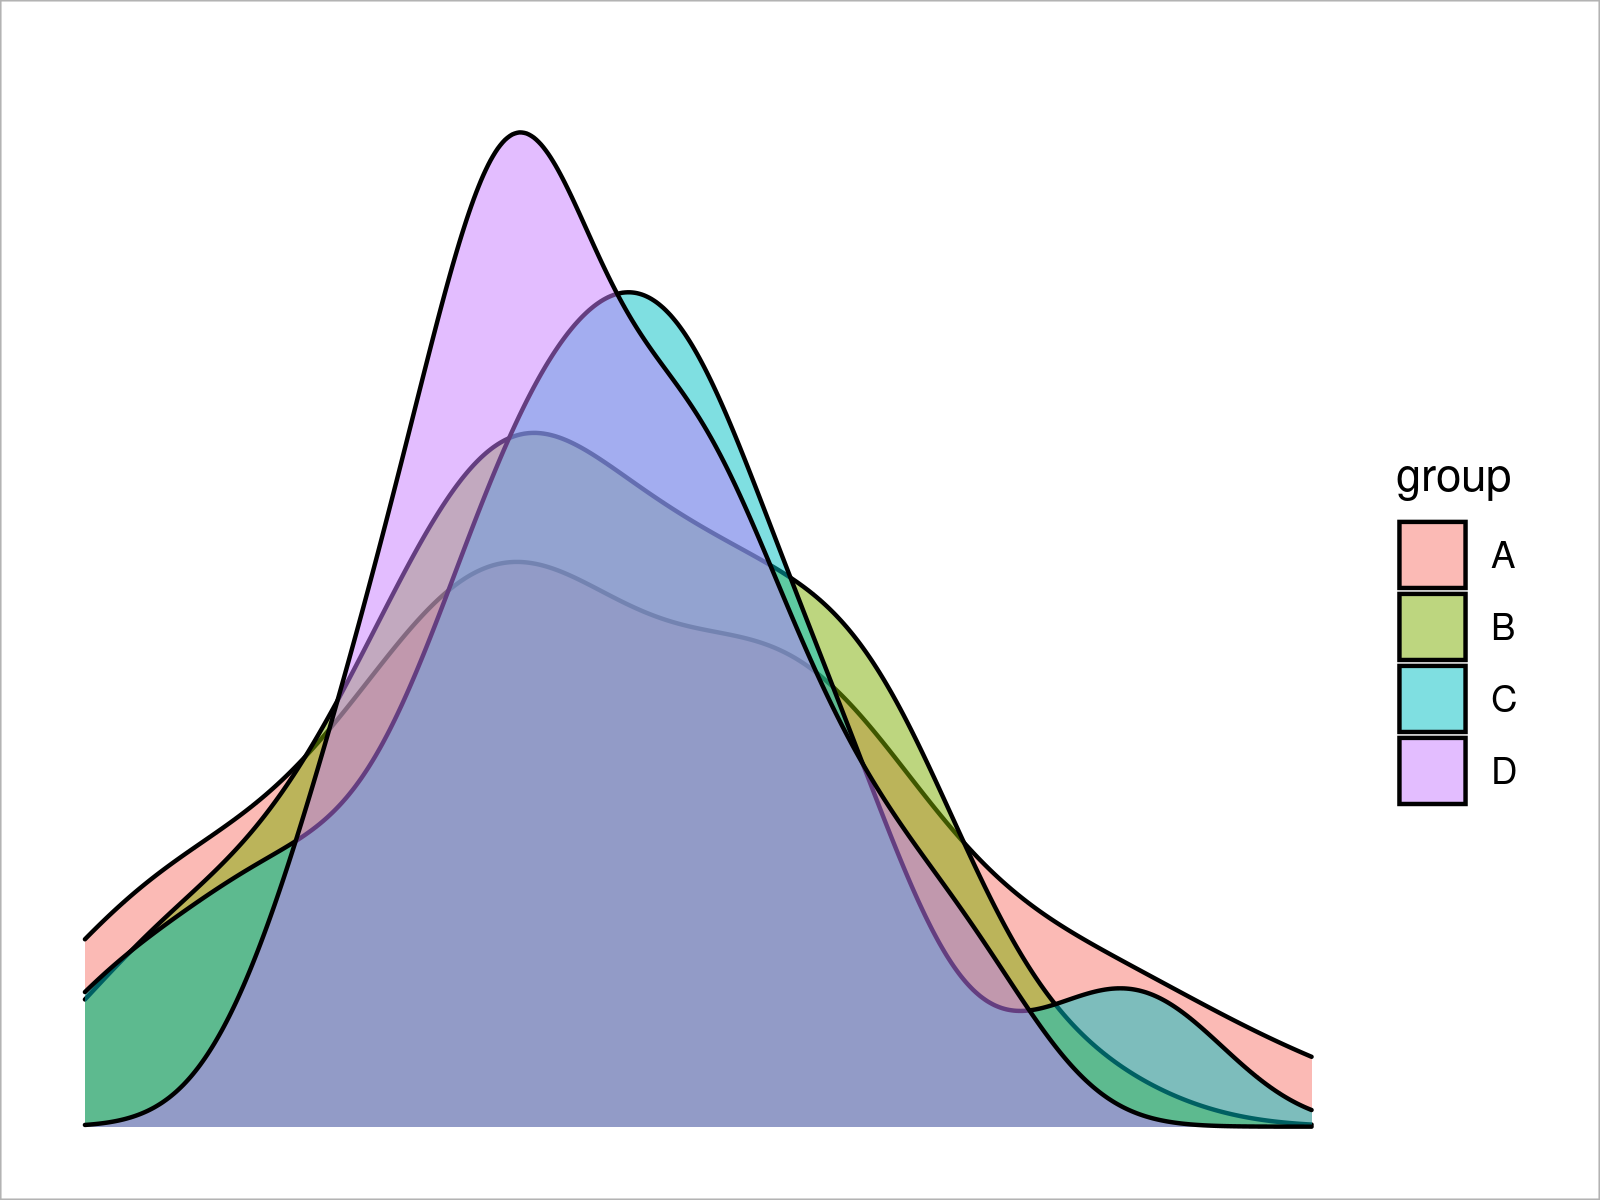
Example 2: Draw ggplot2 Density Plot Using theme_void()
ggplot(data,                               # theme_void density plot
       aes(x = x,
           fill = group)) +
  geom_density(alpha = 0.5) +
  theme_void()
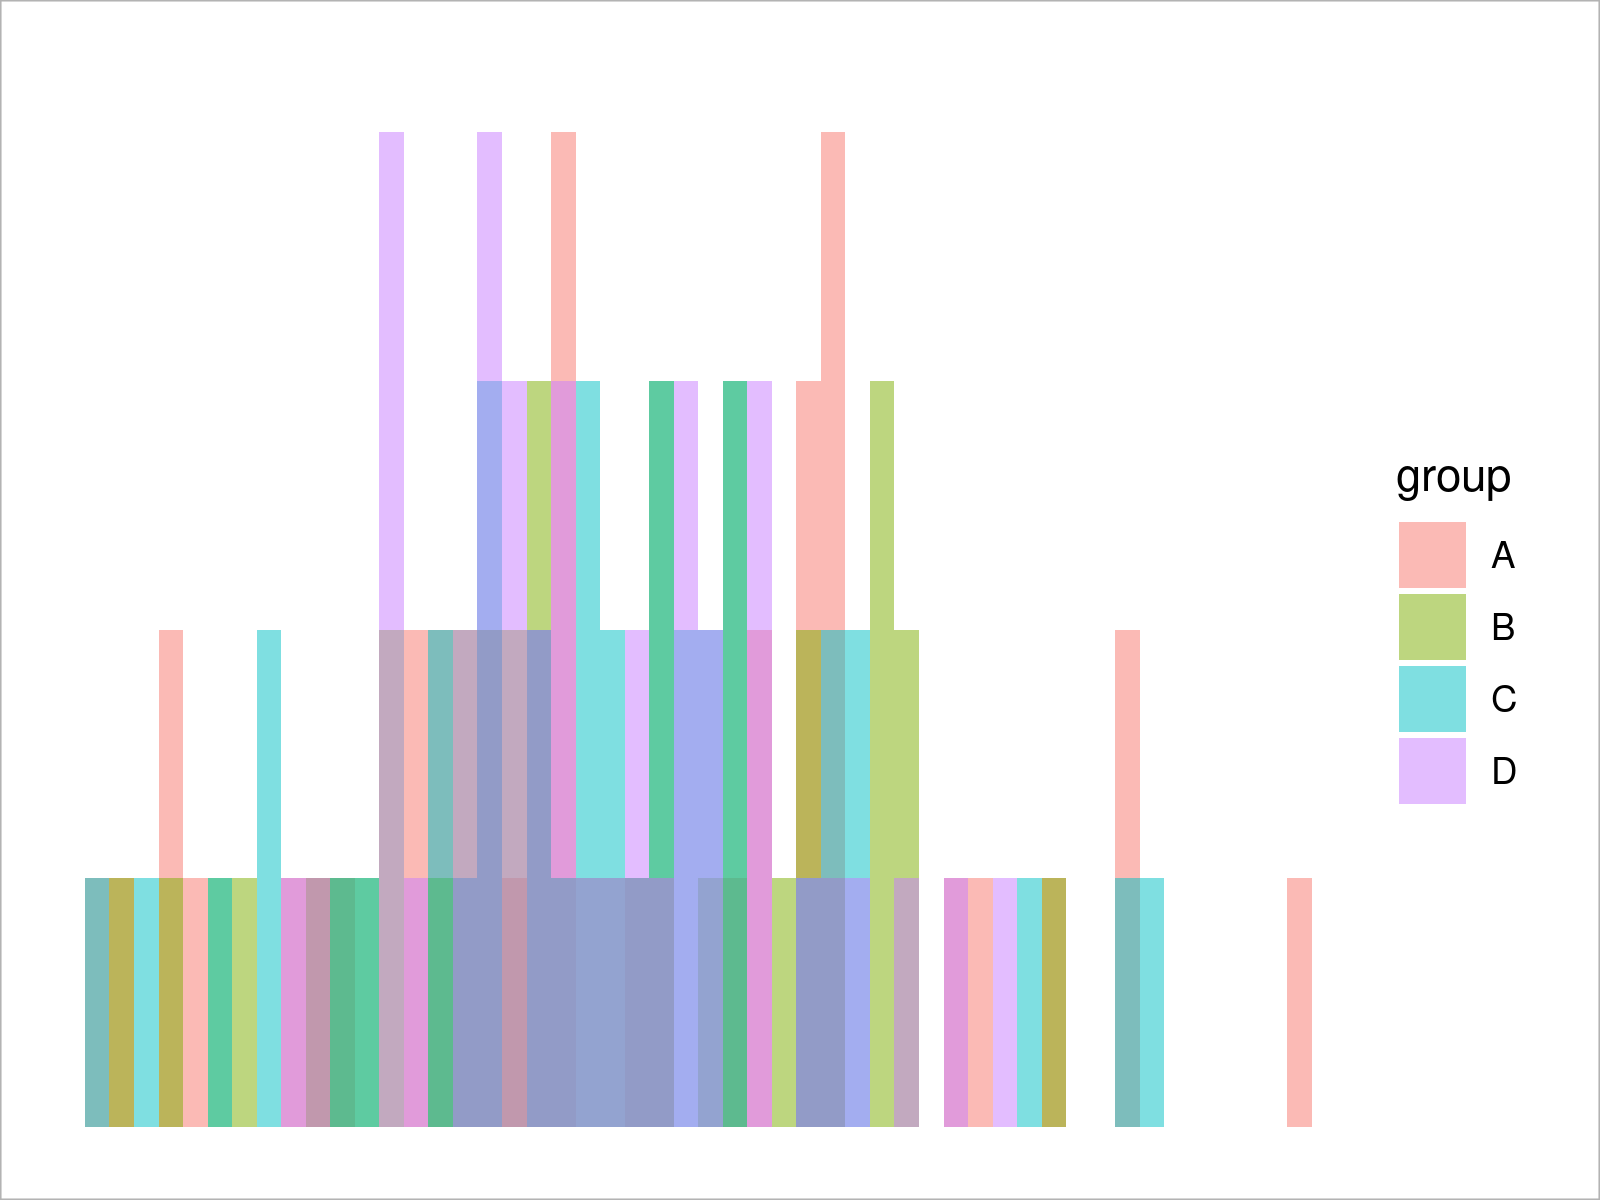
Example 3: Draw ggplot2 Histogram Using theme_void()
ggplot(data,                               # theme_void histogram
       aes(x = x,
           fill = group)) +
  geom_histogram(alpha = 0.5,
                 position = "identity",
                 bins = 50) +
  theme_void()
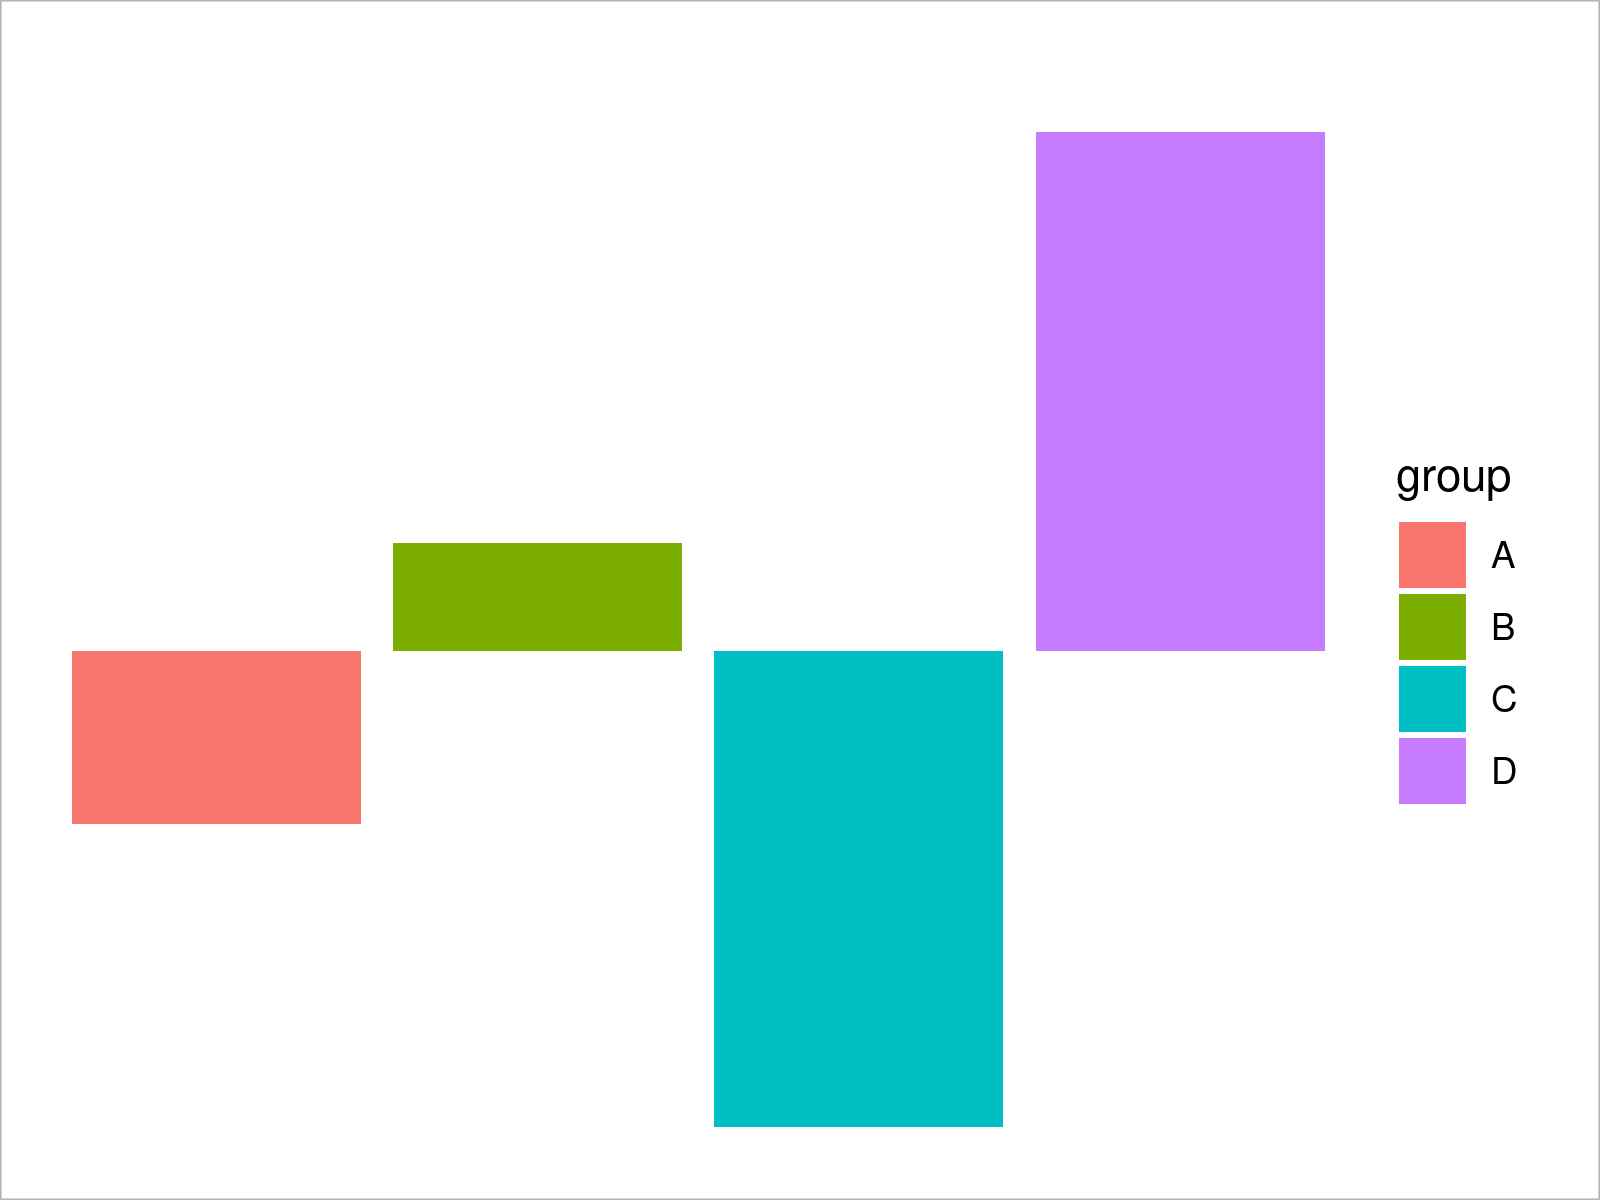
Example 4: Draw ggplot2 Barchart Using theme_void()
ggplot(aggregate(y ~ group, data, sum),    # theme_void barplot
       aes(x = group,
           y = y,
           fill = group)) +
  geom_bar(stat = "identity") +
  theme_void()
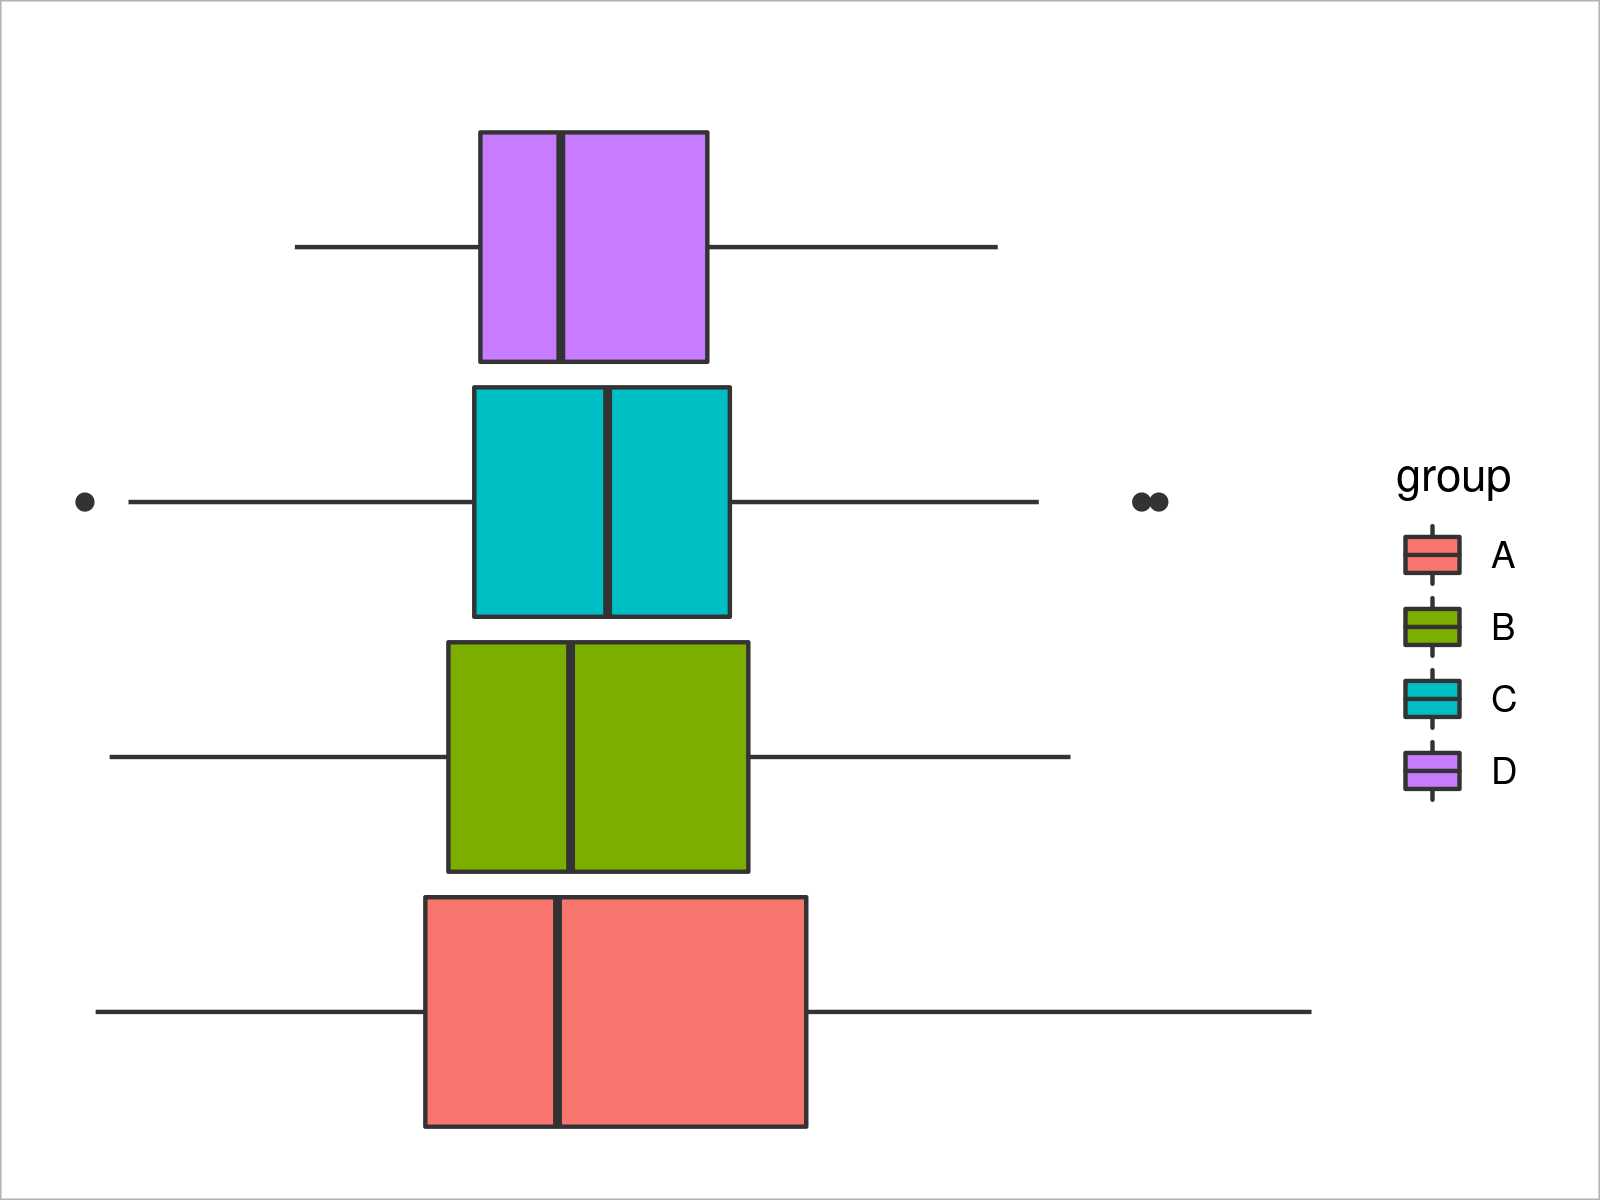
Example 5: Draw ggplot2 Boxplot Using theme_void()
ggplot(data,                               # theme_void boxplot
       aes(x = x,
           fill = group)) +
  geom_boxplot() +
  theme_void()
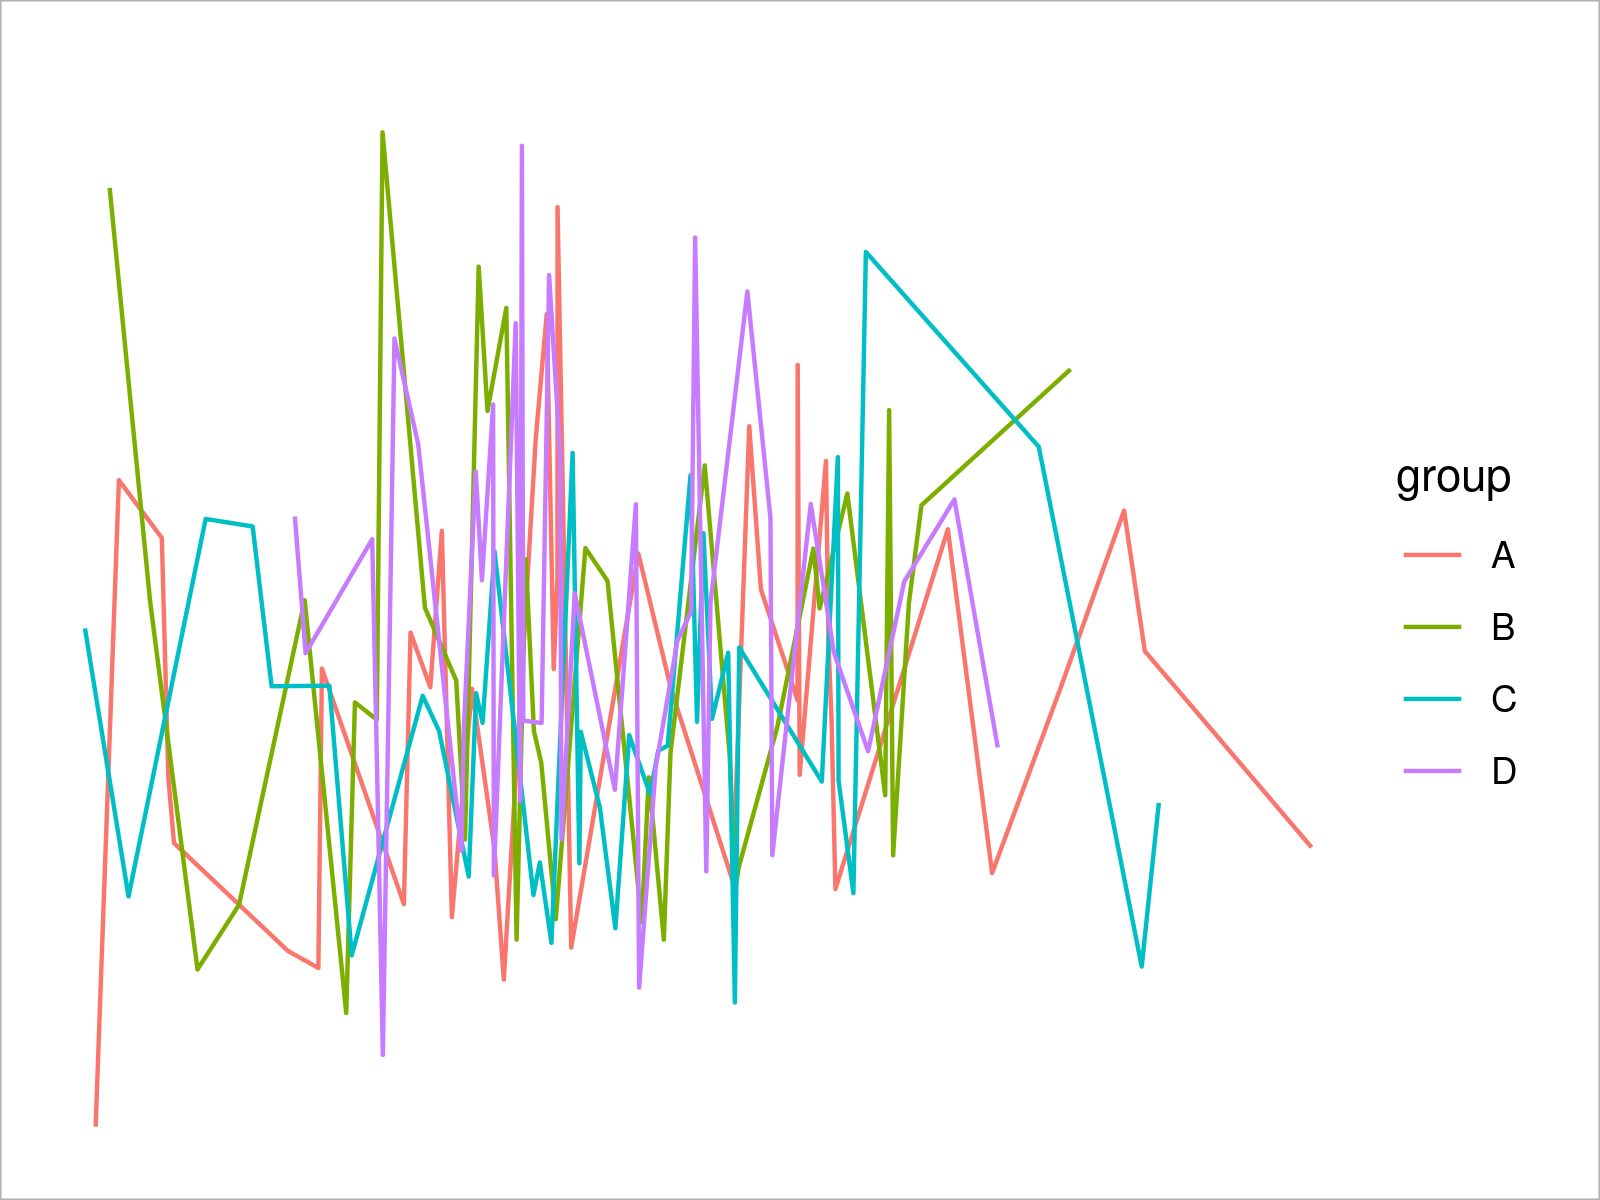
Example 6: Draw ggplot2 Line Plot Using theme_void()
ggplot(data,                               # theme_void line plot
       aes(x = x,
           y = y,
           col = group)) +
  geom_line() +
  theme_void()
Video, Further Resources & Summary
If you are interested in data visualization in R and the functions of the ggplot2 package, you have to watch the following video, where I explain the ggplot2 package in much more detail (beginners & advanced users).
You can also find articles on how to plot different kinds of graphics such as xy-plots, density plots, bargraphs, boxplots, histograms, and line plots using other ggplot2 themes:
- theme_classic
- theme_bw
- theme_dark
- theme_economist [ggthemes Package]
- theme_gray
- theme_light
- theme_linedraw
- theme_minimal
- theme_test
Also, you can have a look at the introductions to other add-on packages that provide extra themes for ggplot2 plots:
In addition, you may read some of the related tutorials that I have published on my website. You can find a selection of tutorials below.
In this R programming tutorial you have learned how to apply the theme_void function to modify the design and layout of a ggplot2 plot. Let me know in the comments, in case you have any additional questions. Furthermore, don’t forget to subscribe to my email newsletter in order to receive updates on the newest tutorials.


