theme_dark ggplot2 Theme in R (6 Examples)
In this R tutorial you’ll learn how to change the ggplot2 theme to the theme_dark.
The content of the page is structured like this:
You’re here for the answer, so let’s get straight to the examples:
Example Data & Add-On Packages
We use the following data as basement for this R tutorial:
set.seed(842236)                           # Set random seed
data <- data.frame(x = rnorm(100),         # Create example data frame
                   y = rnorm(100),
                   group = LETTERS[1:4])
head(data)                                 # Print head of example data frame
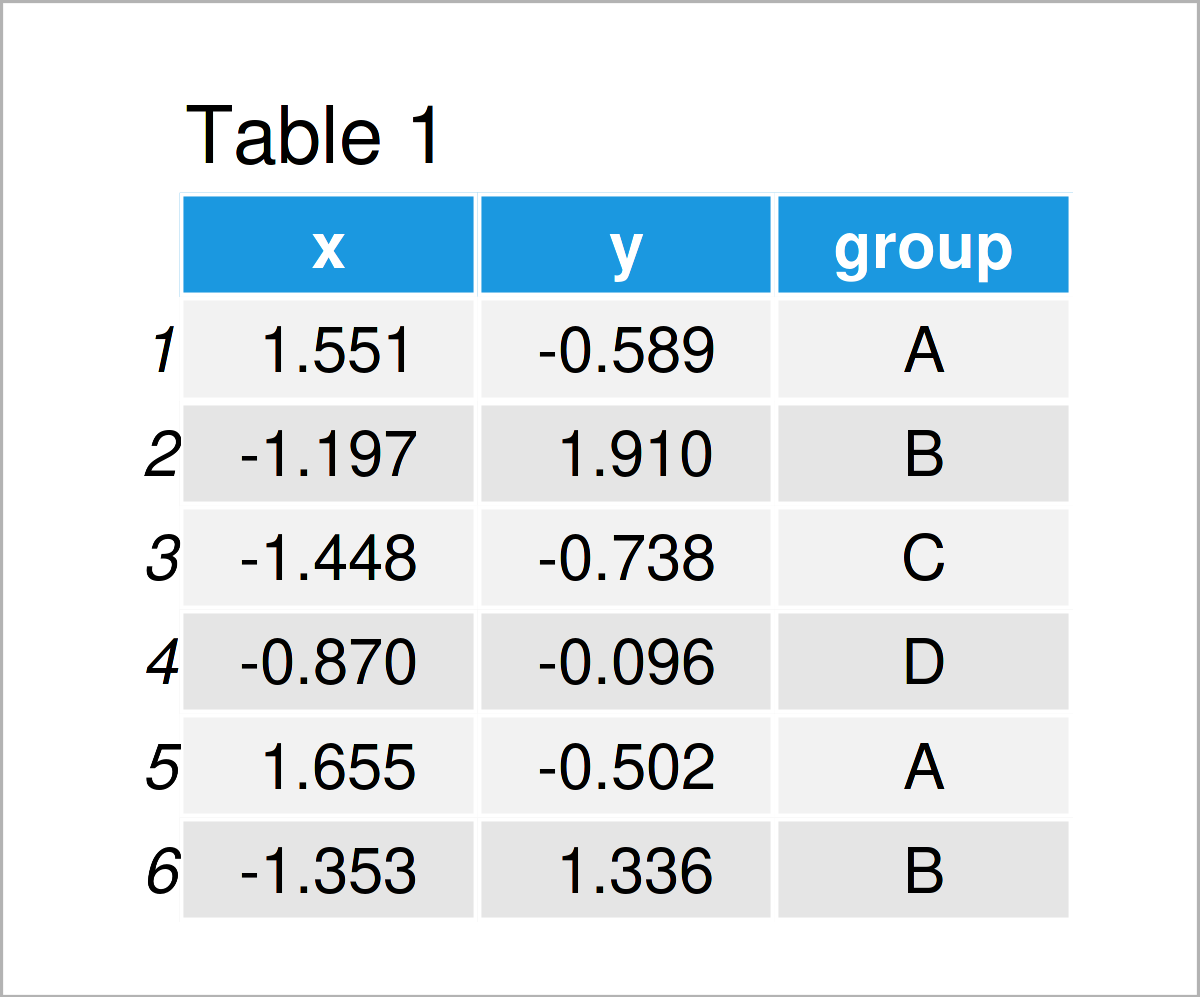
Have a look at the table that got returned after running the previous R code. It reveals the first six rows of the example data, and that our data is constituted of three columns. The columns x and y are numerical, and the variable group has the character data type.
In case we want to use the functions of the ggplot2 package, we also have to install and load ggplot2:
install.packages("ggplot2")                # Install ggplot2 package
library("ggplot2")                         # Load ggplot2
After installing and loading the ggplot2 package, we can draw our data in different kinds of ggplot2 graphics.
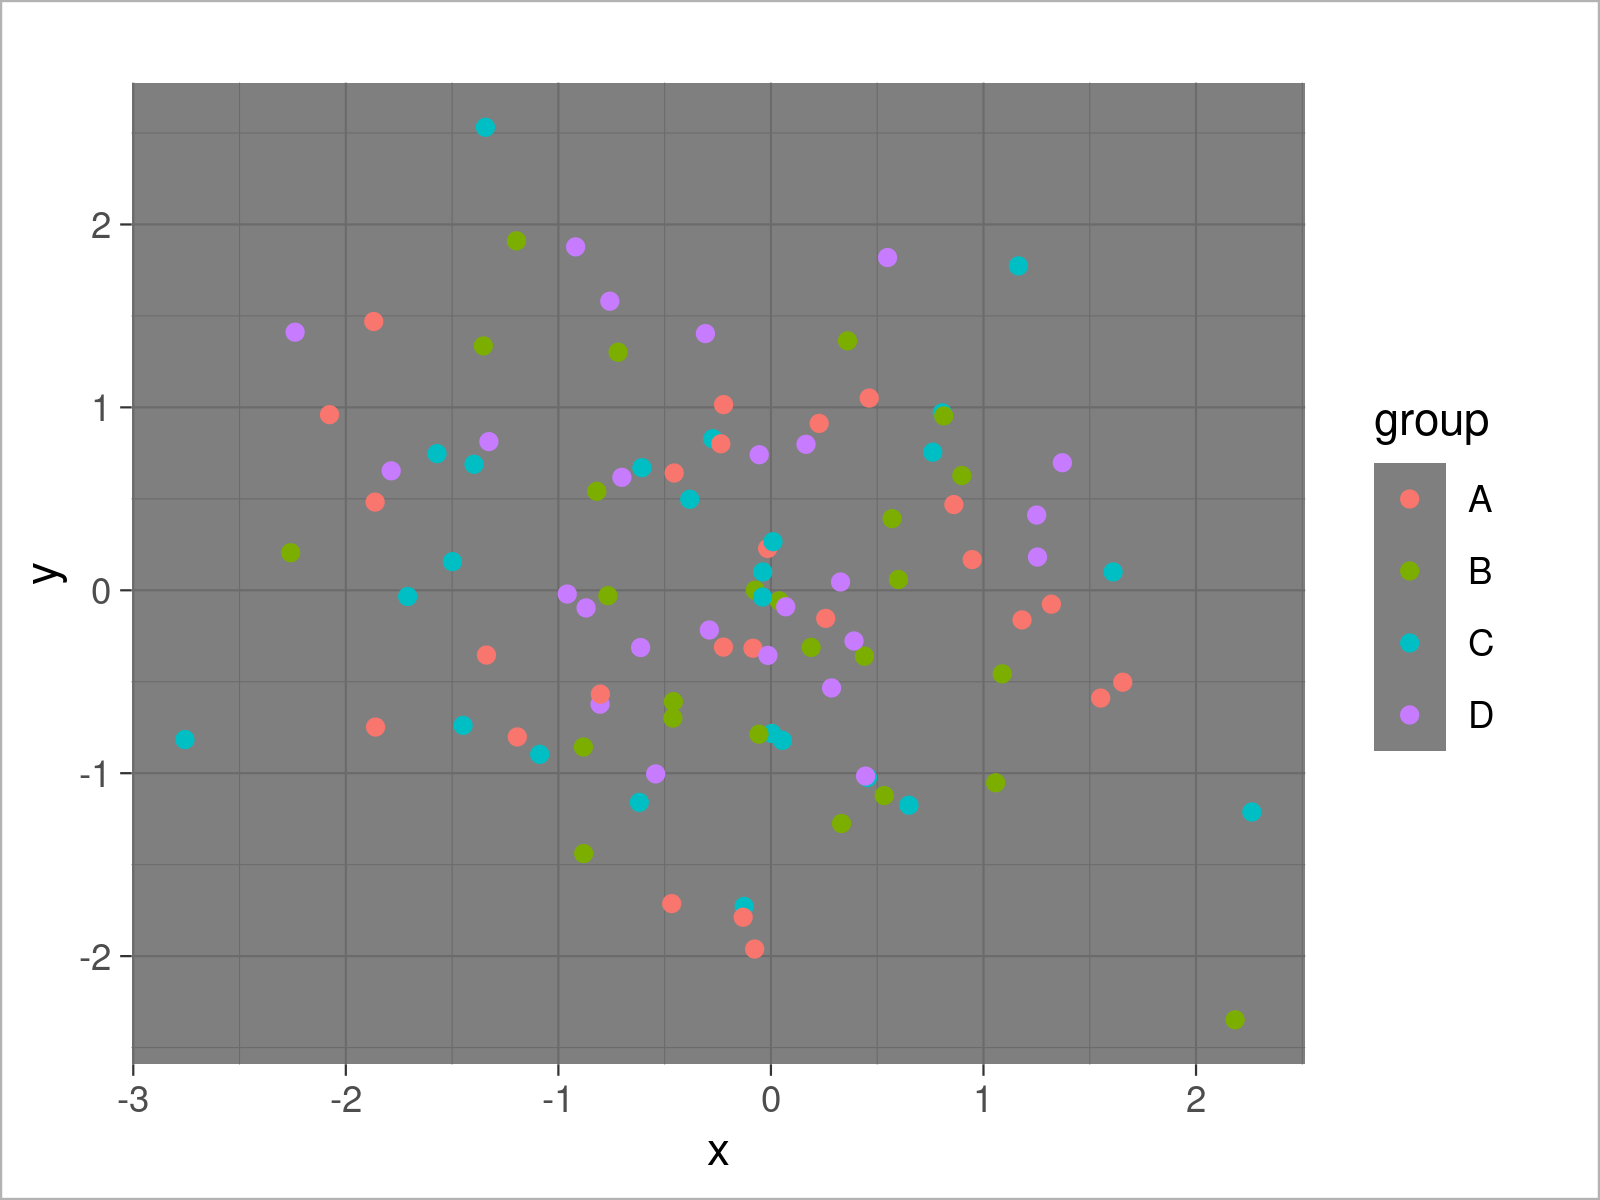
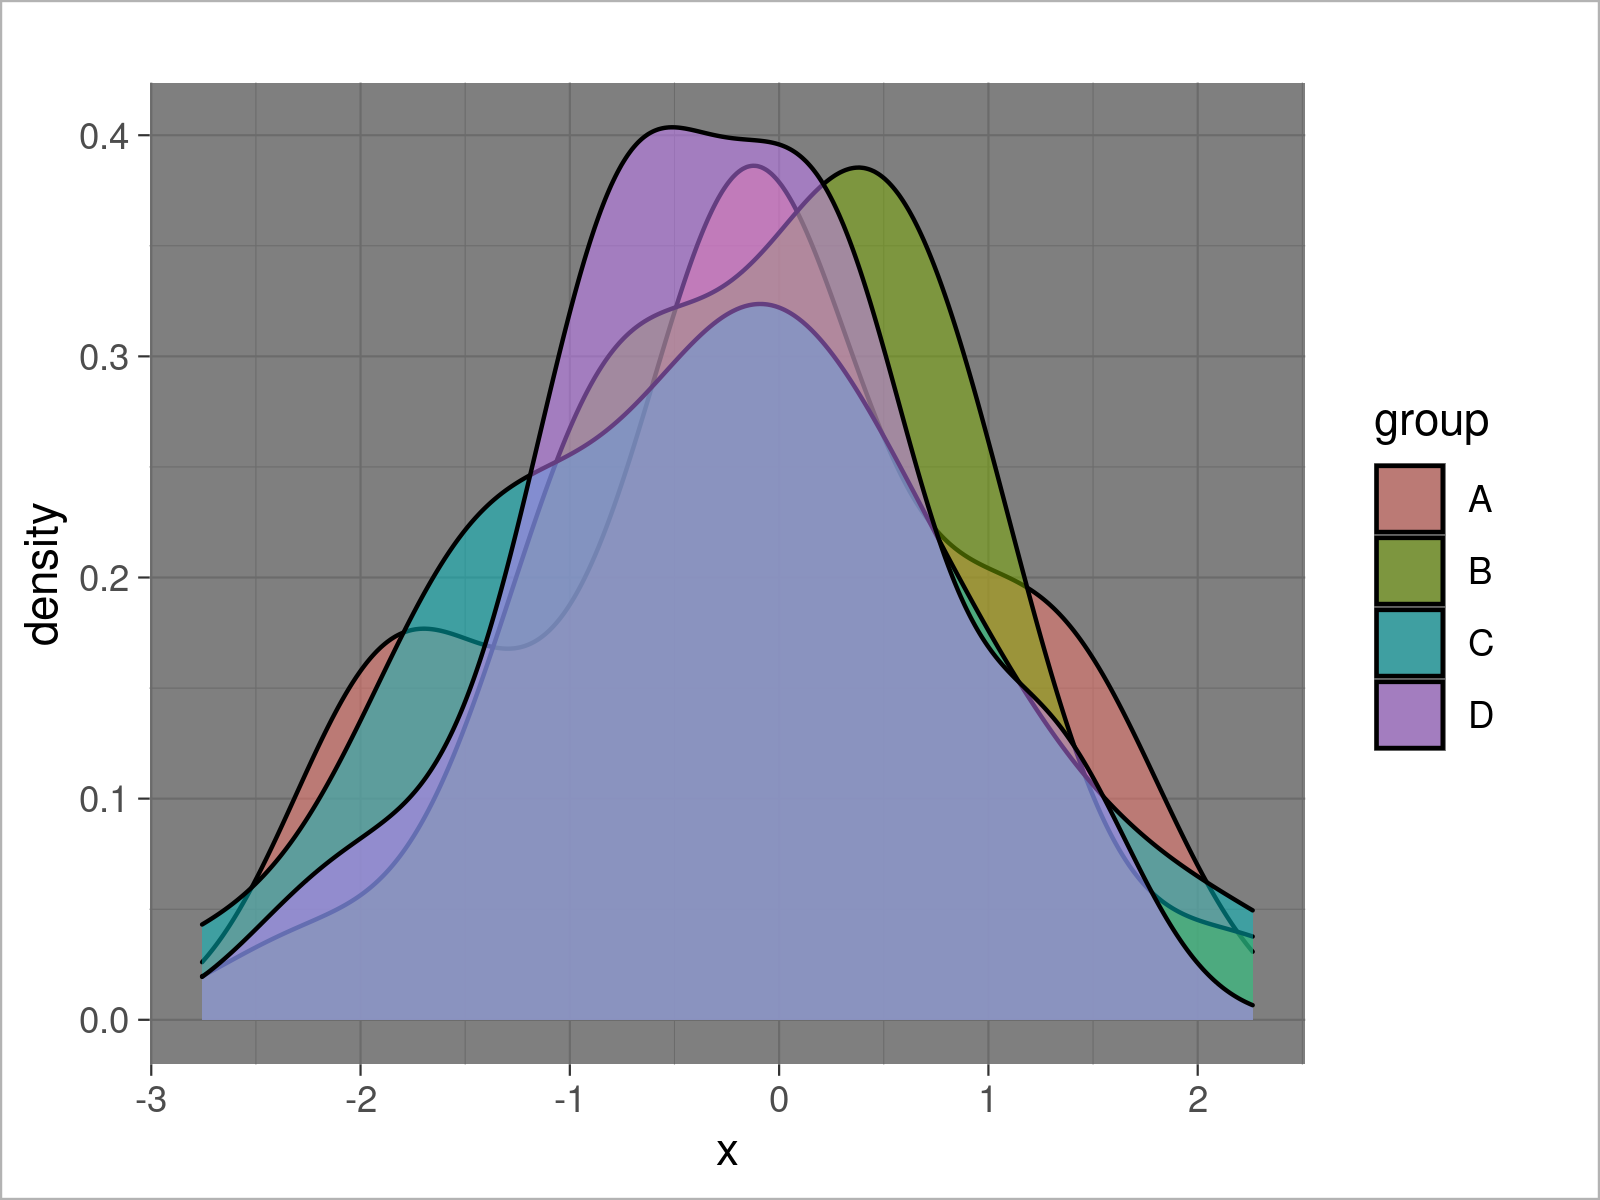
In this specific tutorial, we’ll focus on the theme_dark theme. The main characteristic of this theme is that it has a dark gray background and a darker design and style than other themes. This might especially be attractive when using neon and lighter colors to draw the different data points of our data set.
Anyway, let’s move on to the examples!
Example 1: Draw ggplot2 Scatterplot Using theme_dark()
ggplot(data,                               # theme_dark scatterplot
       aes(x = x,
           y = y,
           col = group)) +
  geom_point() +
  theme_dark()
Example 2: Draw ggplot2 Density Plot Using theme_dark()
ggplot(data,                               # theme_dark density plot
       aes(x = x,
           fill = group)) +
  geom_density(alpha = 0.5) +
  theme_dark()
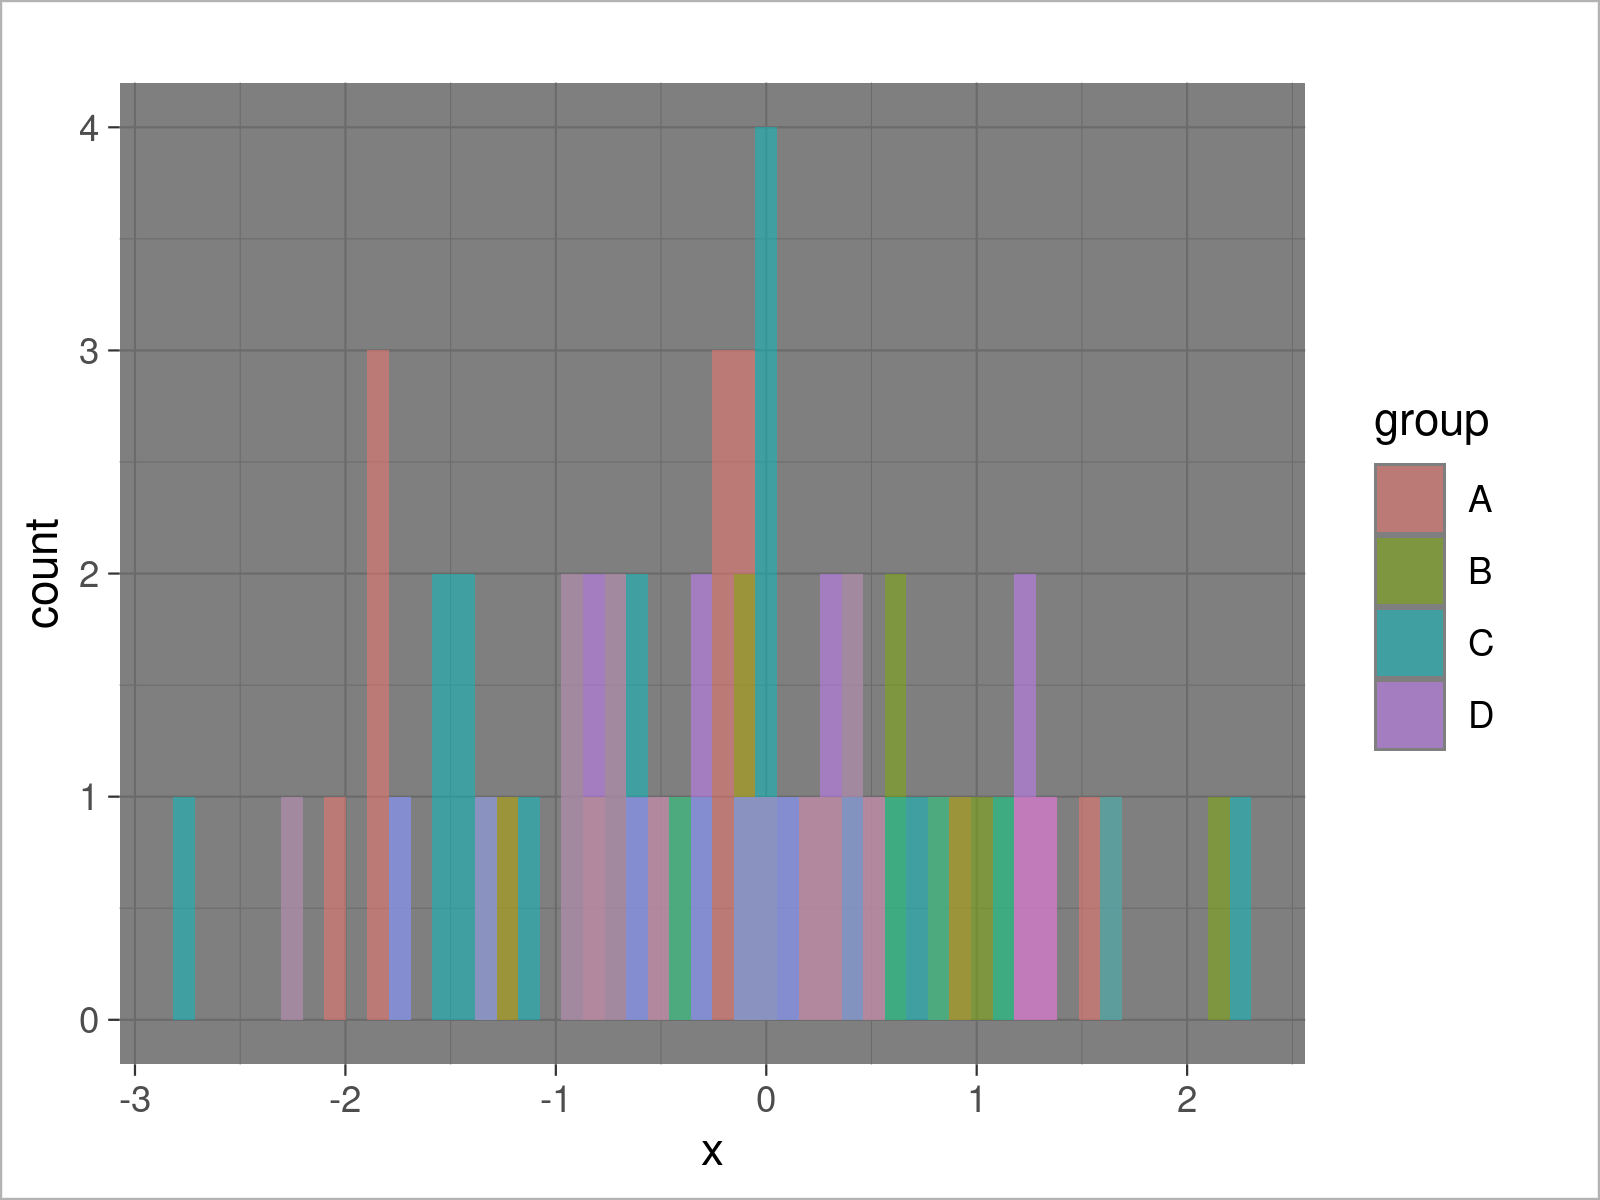
Example 3: Draw ggplot2 Histogram Using theme_dark()
ggplot(data,                               # theme_dark histogram
       aes(x = x,
           fill = group)) +
  geom_histogram(alpha = 0.5,
                 position = "identity",
                 bins = 50) +
  theme_dark()
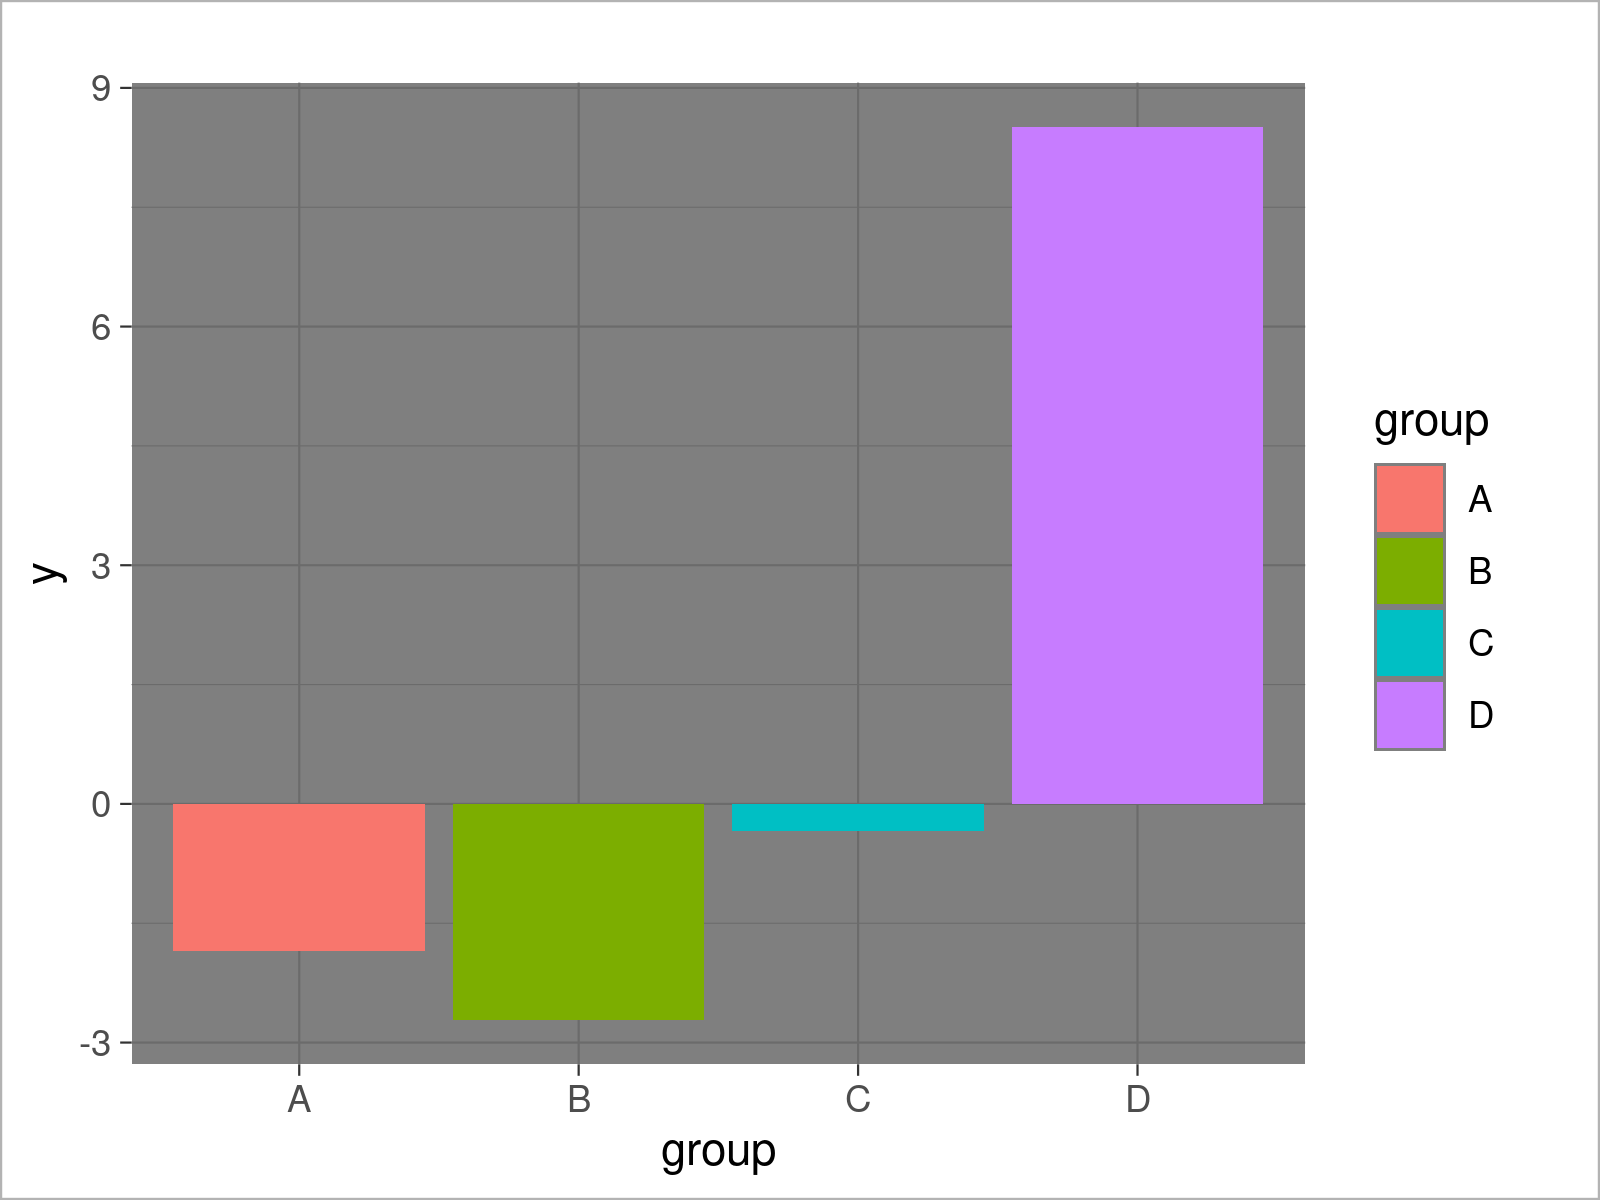
Example 4: Draw ggplot2 Barchart Using theme_dark()
ggplot(aggregate(y ~ group, data, sum),    # theme_dark barplot
       aes(x = group,
           y = y,
           fill = group)) +
  geom_bar(stat = "identity") +
  theme_dark()
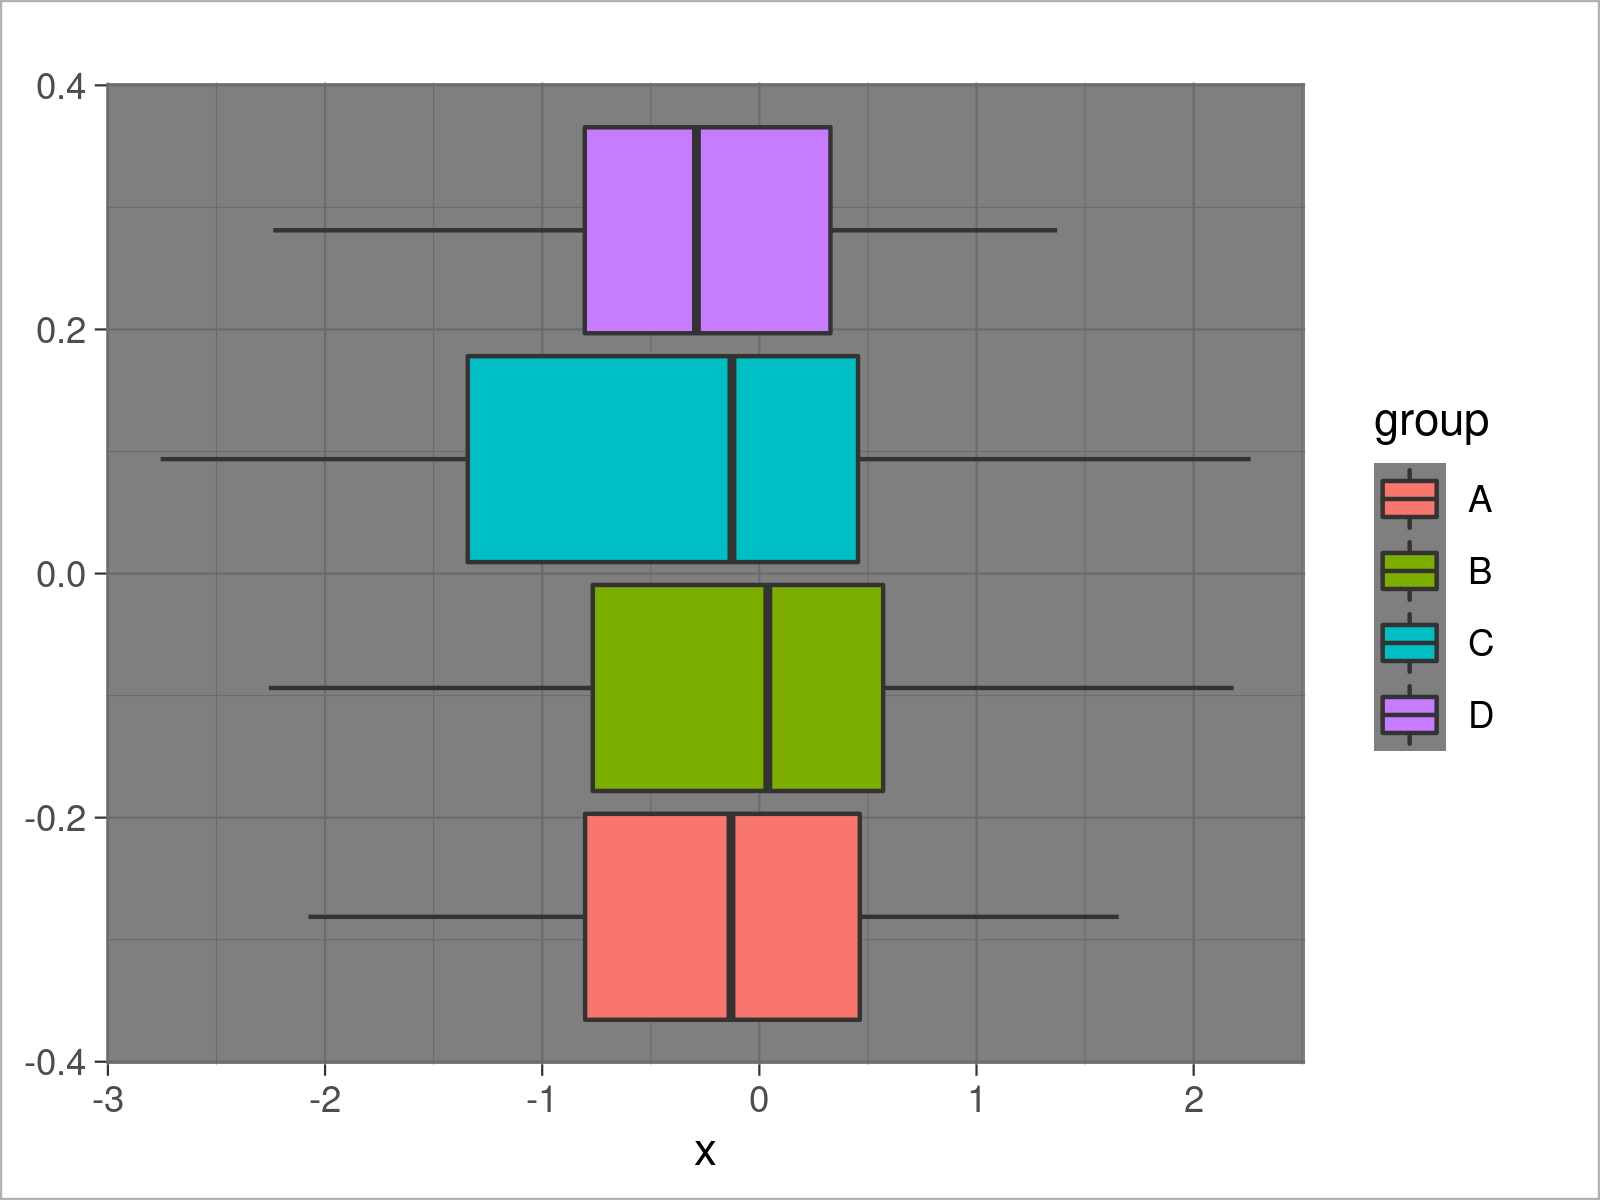
Example 5: Draw ggplot2 Boxplot Using theme_dark()
ggplot(data,                               # theme_dark boxplot
       aes(x = x,
           fill = group)) +
  geom_boxplot() +
  theme_dark()
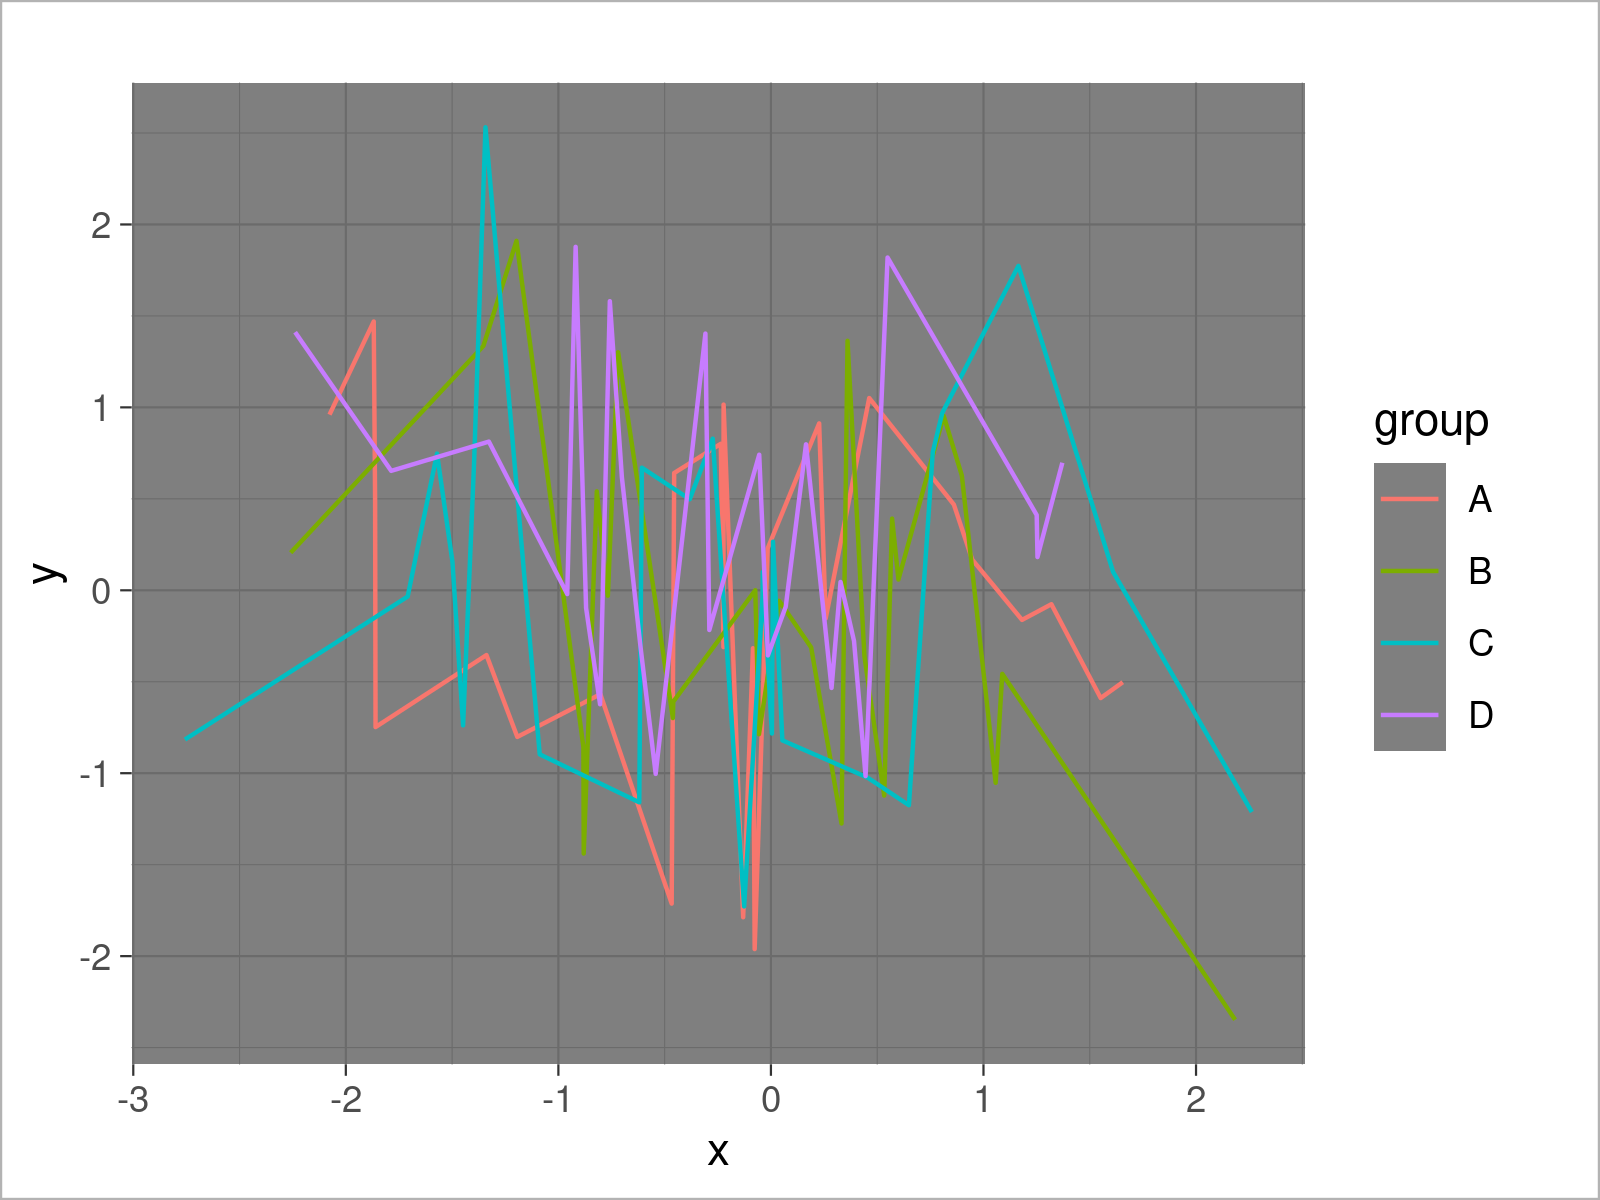
Example 6: Draw ggplot2 Line Plot Using theme_dark()
ggplot(data,                               # theme_dark line plot
       aes(x = x,
           y = y,
           col = group)) +
  geom_line() +
  theme_dark()
Video & Further Resources
The ggplot2 package has of course much more of useful and awesome functions and opportunities when it comes to data visualization in R. May you have a look at the following introduction video on my my YouTube channel.
On Statistics Globe, you may also read tutorials on how to create different kinds of graphics such as scatterplots, density plots, barcharts, boxplots, histograms, and line plots using different ggplot2 themes:
- theme_bw
- theme_classic
- theme_economist [ggthemes Package]
- theme_gray
- theme_light
- theme_linedraw
- theme_minimal
- theme_test
- theme_void
Furthermore, you may have a look at the introductions to other add-on packages that provide extra themes for ggplot2 graphics:
Furthermore, you could have a look at the other tutorials on my website. Some tutorials are shown below.
To summarize: In this tutorial, I have shown how to transform the ggplot2 theme to the theme_dark in the R programming language. Please let me know in the comments, in case you have further questions. Furthermore, please subscribe to my email newsletter to receive regular updates on the newest articles.


