Change Display Order of ggplot2 Plot Legend in R (Example)
In this post you’ll learn how to modify the ordering of legend items of a ggplot2 graph in the R programming language.
The tutorial will contain these content blocks:
Let’s get started!
Example Data, Packages & Default Graphic
We use the following data as basement for this R tutorial:
data <- data.frame(x = 1:5,                              # Example data
                   y = 1:5,
                   group = LETTERS[1:5])
data                                                     # Structure of data
#   x y group
# 1 1 1     A
# 2 2 2     B
# 3 3 3     C
# 4 4 4     D
# 5 5 5     E
As you can see based on the previous output of the RStudio console, the example data has five rows and three columns. One of the columns is a grouping variable, which is also responsible for the legend items in the plots later on.
If we want to use the functions of the ggplot2 package, we also have to install and load ggplot2 to RStudio.
install.packages("ggplot2")                                # Install & load ggplot2 package
library("ggplot2")
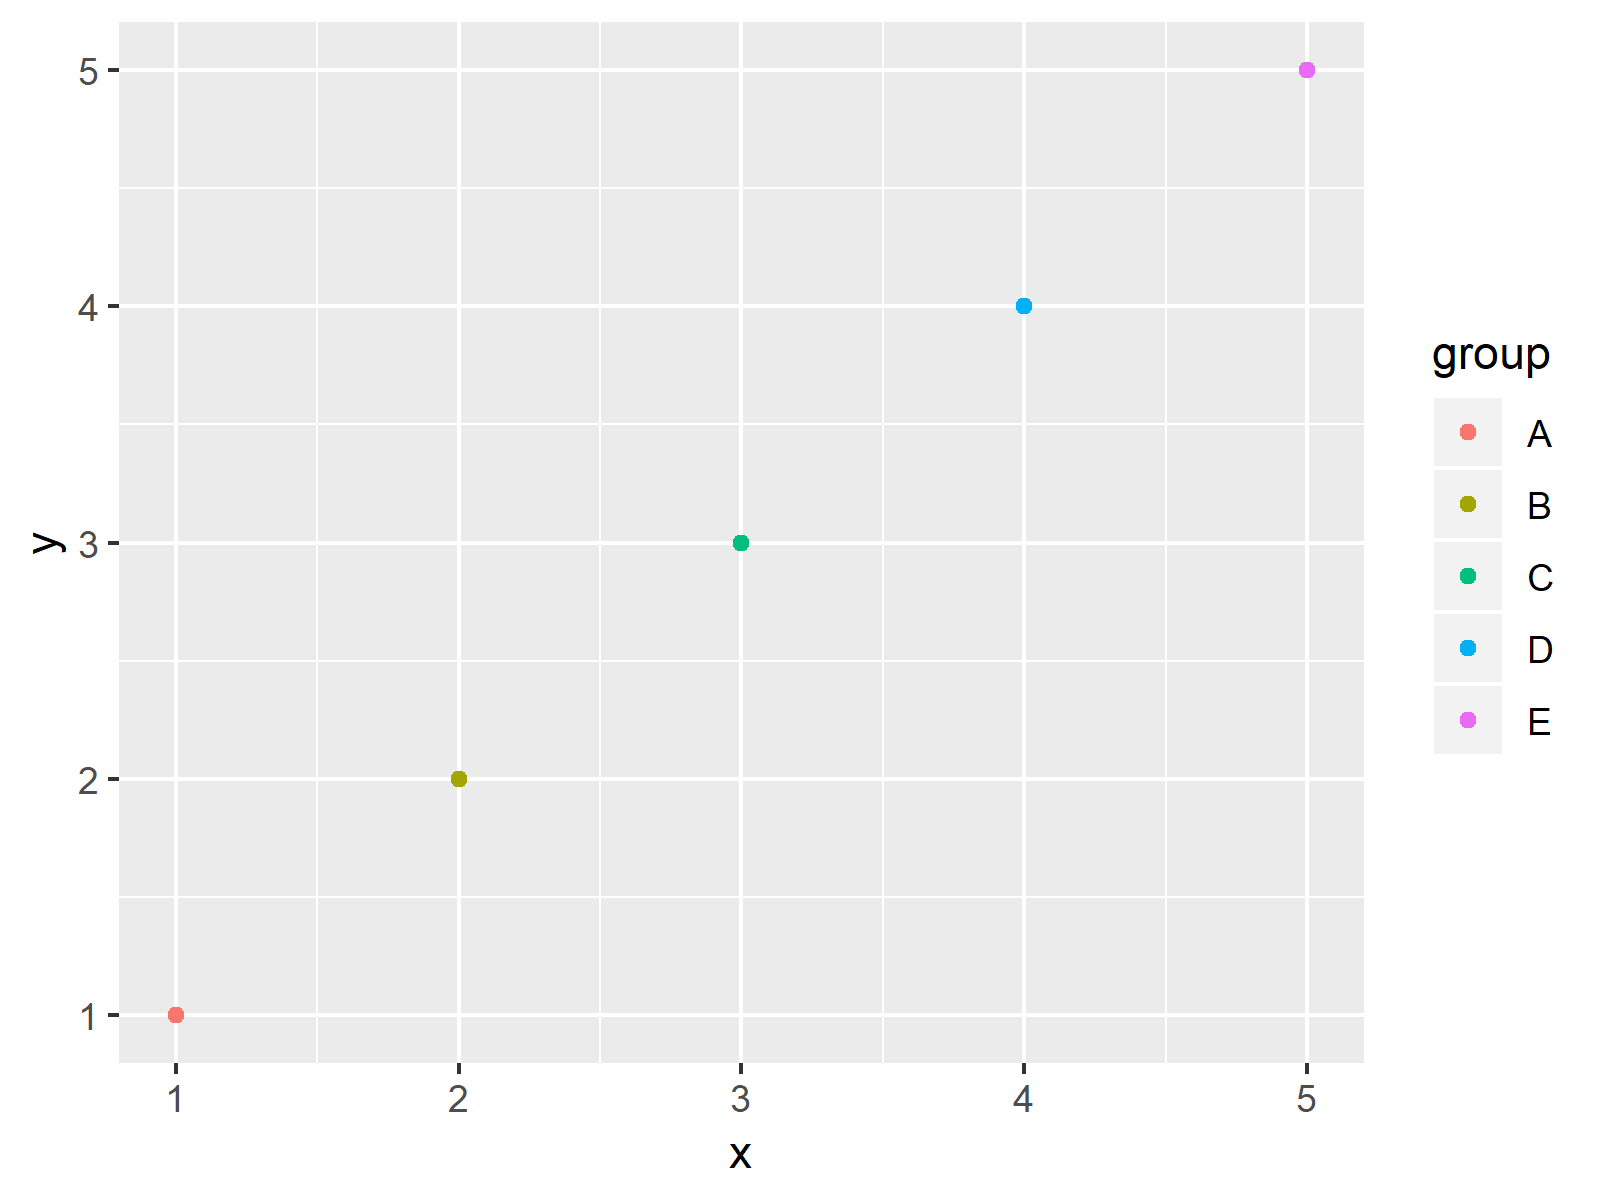
Next, we can plot our data with default legend specifications (i.e. alphabetical order):
ggp <- ggplot(data, aes(x, y, color = group)) +          # Basic ggplot2 plot
  geom_point()
ggp                                                      # Print plot

As shown in Figure 1, we drew a ggplot2 plot and a legend with the previous R code.
Example: Changing Order of ggplot2 Legend Items by Reordering of Grouping Factor
This Example shows how to sort legend items of a ggplot2 graphic manually. First, we need to replicate our data:
data_new <- data # Replicate data
Now, we can modify the factor levels of our grouping column in the order we want.
data_new$group <- factor(data_new$group,                 # Relevel group factor
                         levels = c("B", "D", "A", "E", "C"))
Now, we can draw our data again:
ggp_new <- ggplot(data_new, aes(x, y, color = group)) +  # Recreate plot
  geom_point()
ggp_new                                                  # Draw updated plot

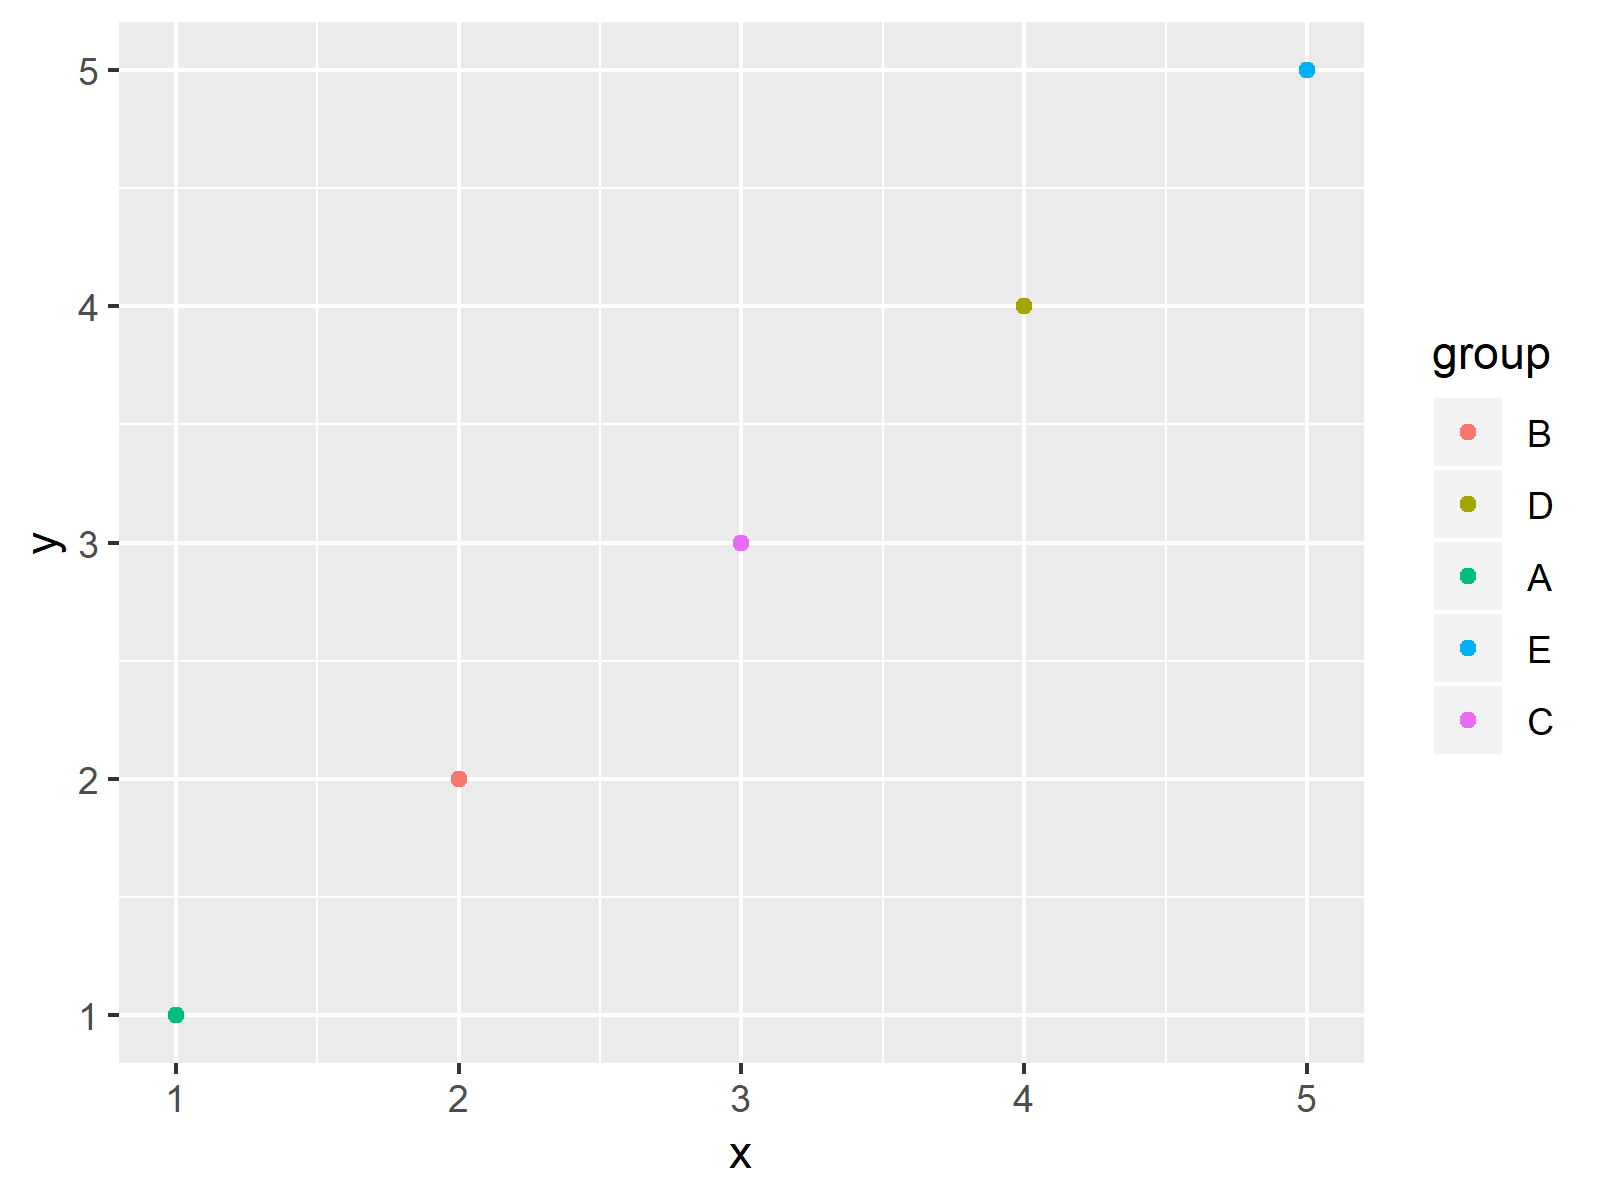
Figure 2 shows the output of the previous R code: The legend items were ordered according to the specification of factor levels that we did before.
Video & Further Resources
In case you need more information on the R programming syntax of this post, you might watch the following video of my YouTube channel. I’m explaining the content of the present tutorial in the video.
Furthermore, you may have a look at the related posts of my website. Please find a selection of related tutorials here:
- Control Size of ggplot2 Legend Items
- Show ggplot2 Legend at the Bottom of a Plot & Horizontally Aligned
- Change Spacing Between Horizontal Legend Items of ggplot2 Plot
- Remove Legend Title from ggplot2 Plot
- Change Legend Title in ggplot2
- Create Legend in ggplot2 Plot
- R Graphics Gallery
- The R Programming Language
This tutorial explained how to control the legend items of a ggplot2 plot manually in the R programming language. In case you have any further comments and/or questions, let me know in the comments below.


