ggthemes Package in R (Example)
In this R programming tutorial you’ll learn how to modify the theme of a ggplot2 plot using the ggthemes package.
The tutorial consists of one example for the modification of the theme of a ggplot2 plot using the ggthemes package. To be more specific, the content of the article looks as follows:
Let’s get started.
Example Data, Packages & Default Graph
The first step is to create some data that we can use in the examples below:
set.seed(89365343)                               # Set random seed
data <- data.frame(x = rnorm(100),               # Create example data frame
                   y = rnorm(100),
                   group = LETTERS[1:5])
head(data)                                       # Print head of example data frame
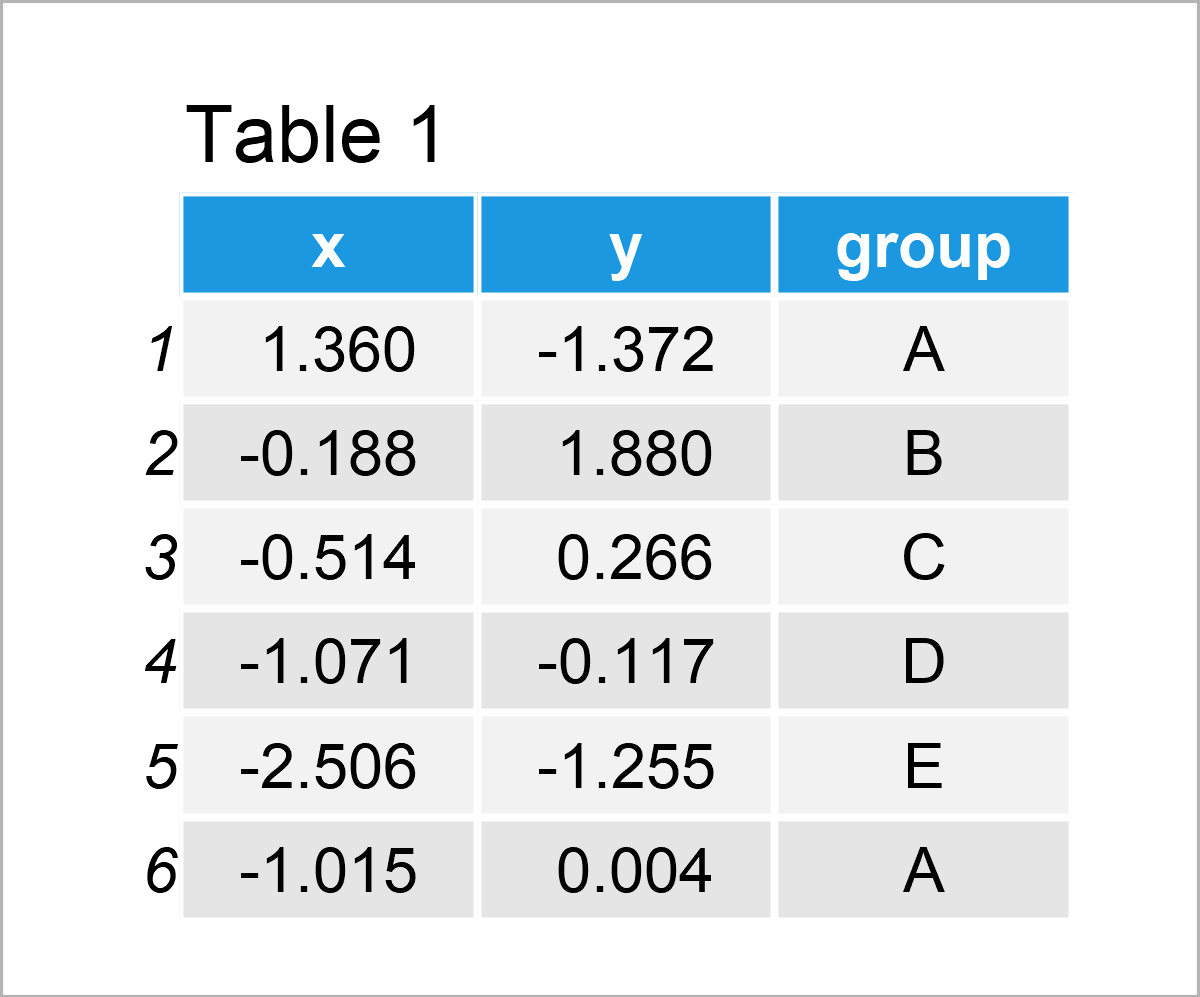
Table 1 shows that our example data has three columns. The variables x and y have the numeric class and the variable group is a character.
For the following tutorial, we also need to install and load the ggplot2 software package:
install.packages("ggplot2")                      # Install ggplot2 package
library("ggplot2")                               # Load ggplot2 package
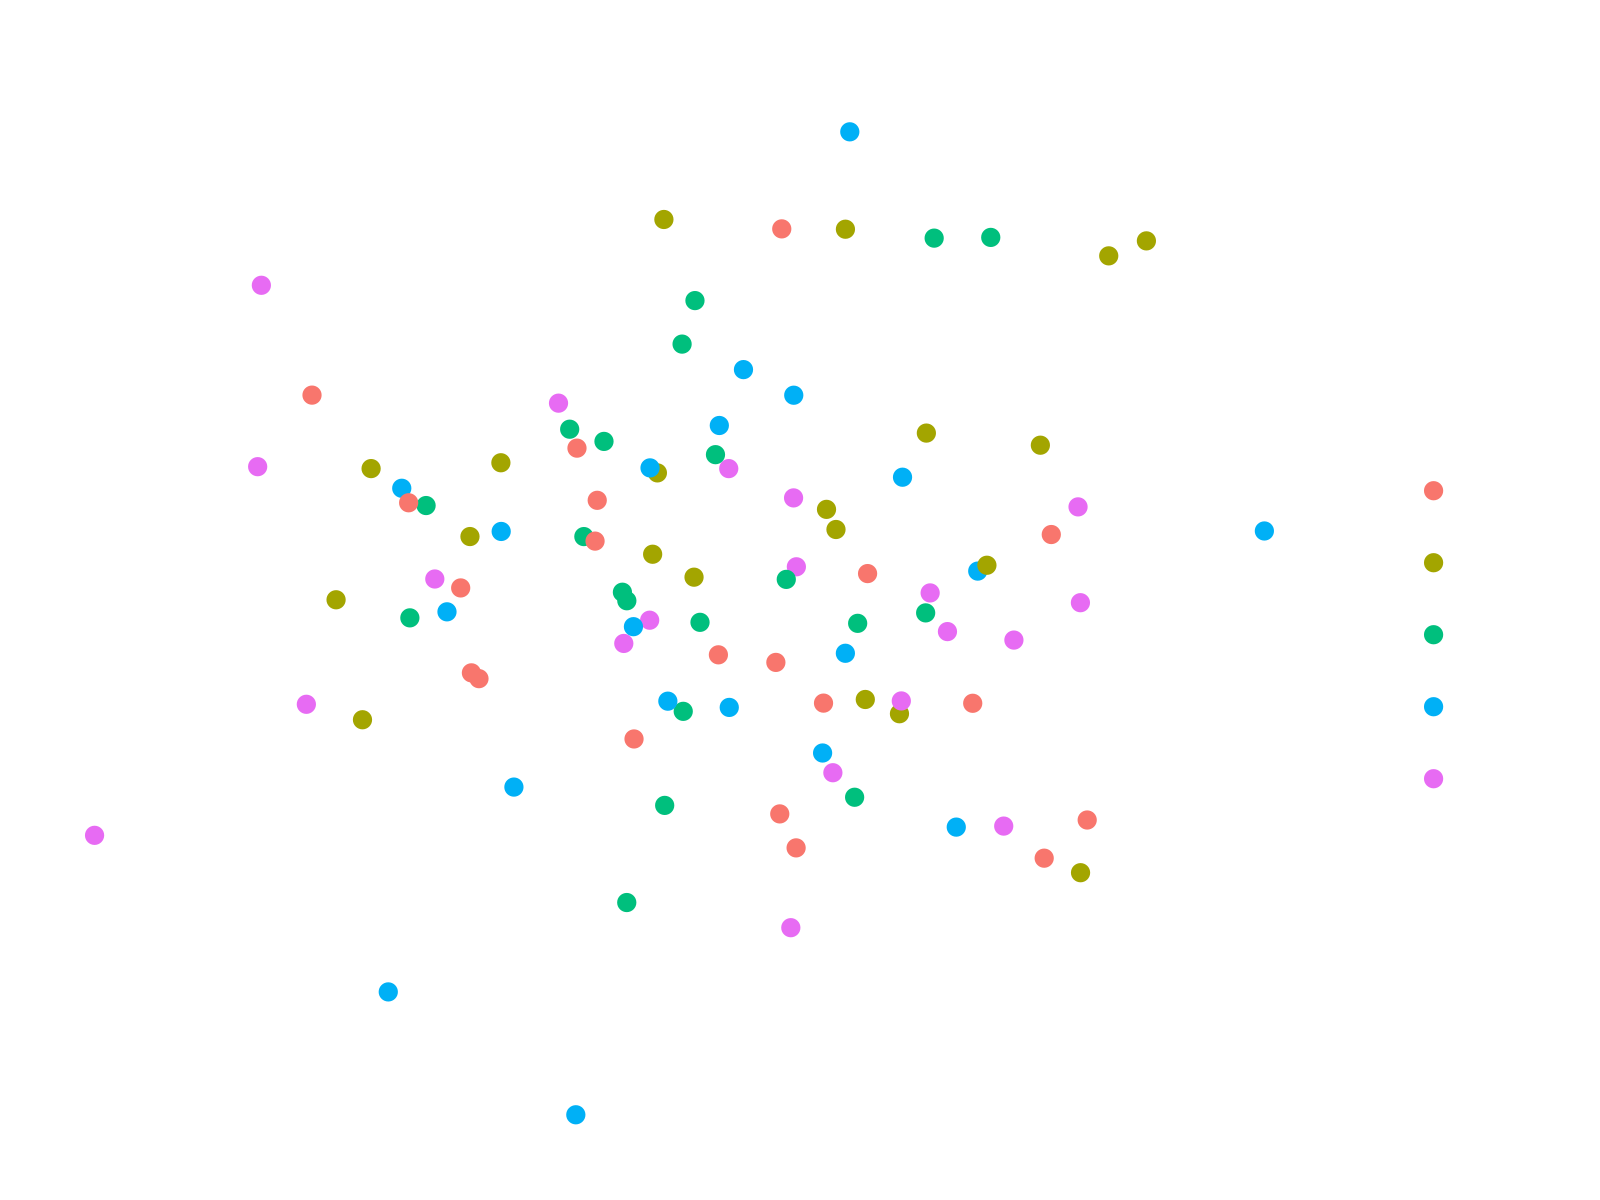
As a next step, we can plot our data with default theme specifications, i.e. the theme_gray theme of the ggplot2 package:
ggp <- ggplot(data, aes(x, y, col = group)) +    # Draw default ggplot2 plot
  geom_point()
ggp
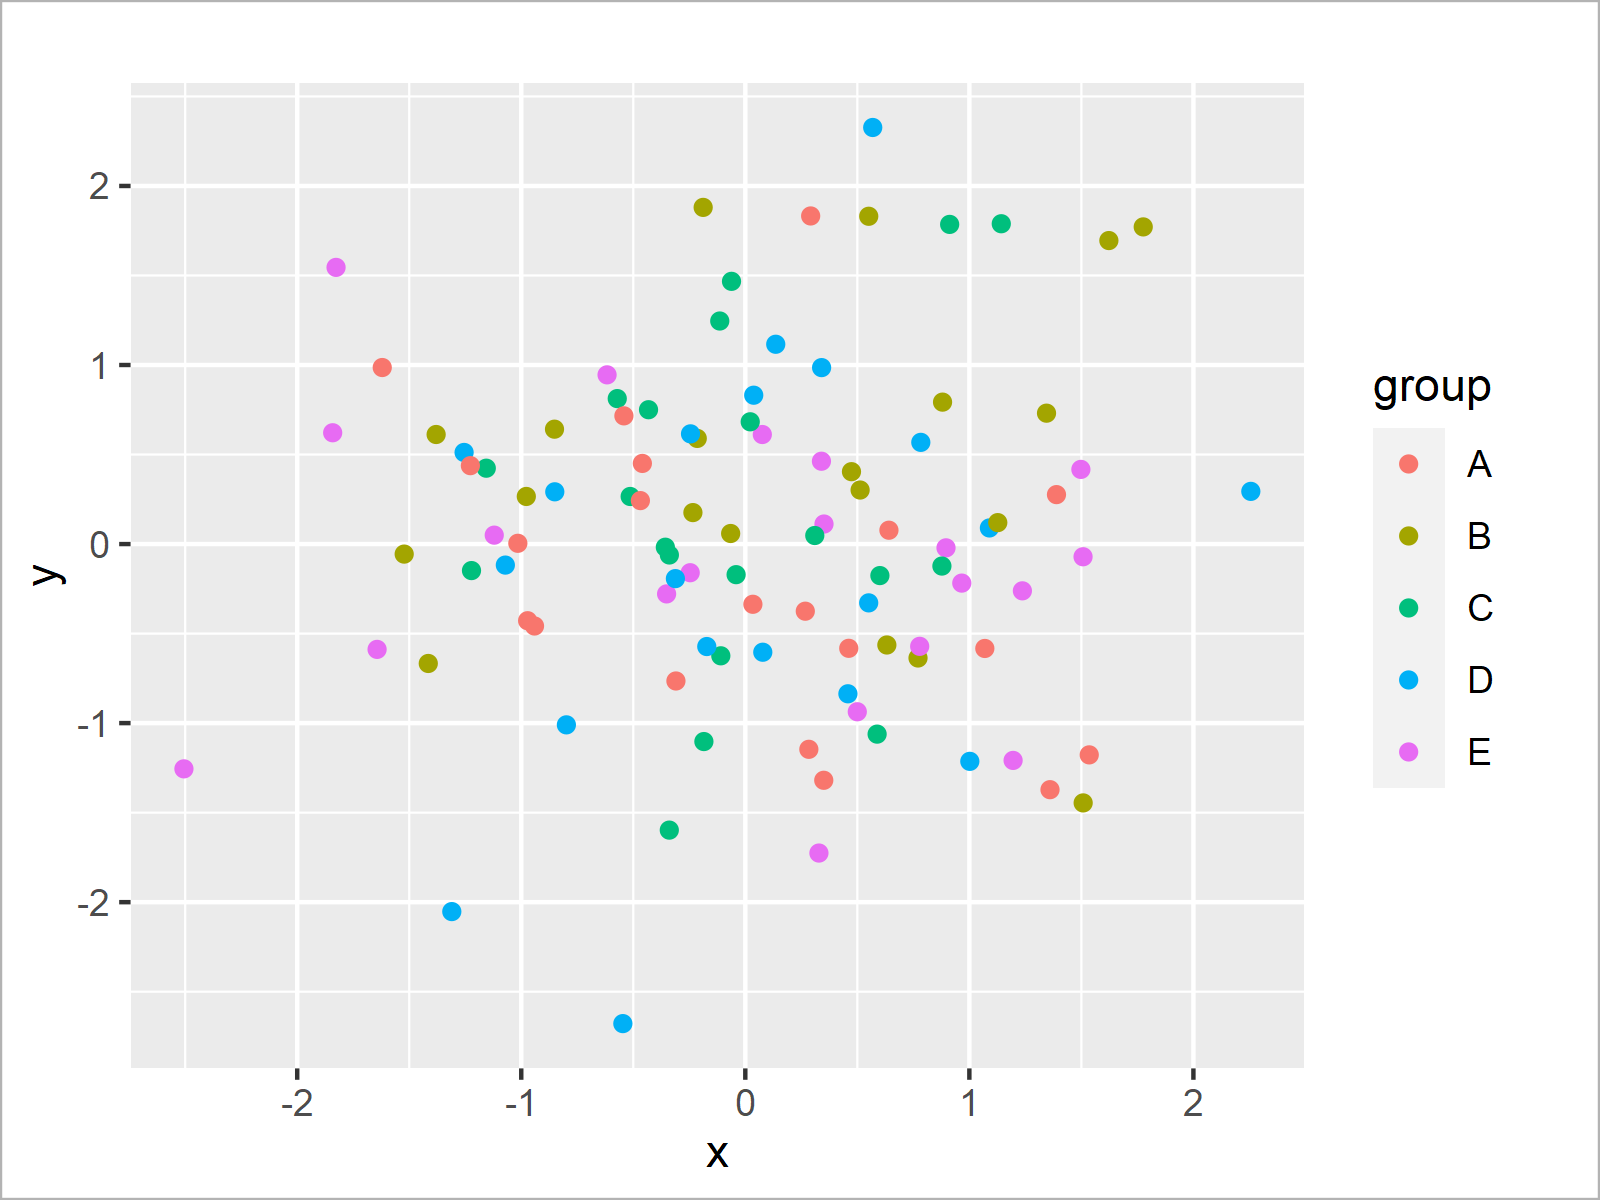
After executing the previous syntax the default ggplot2 scatterplot shown in Figure 1 has been created.
Example: Draw ggplot2 Plot Using Themes of ggthemes Package
This section demonstrates how to change the theme of a ggplot2 graph using the functions of the ggthemes package.
If we want to use the functions of the ggthemes package, we first need to download, install and load ggthemes. Otherwise, the error message there is no package called ggthemes would occur:
install.packages("ggthemes")                     # Install ggthemes package
library("ggthemes")                              # Load ggthemes package
The ggthemes package provides extra themes, geoms, and scales for the ggplot2 package. In this tutorial, we’ll focus on the additional themes that are provided by ggthemes.
In the next step, we can add the theme that we want to use to our ggplot2 plot object called ggp that we have created in the previous section of this tutorial.
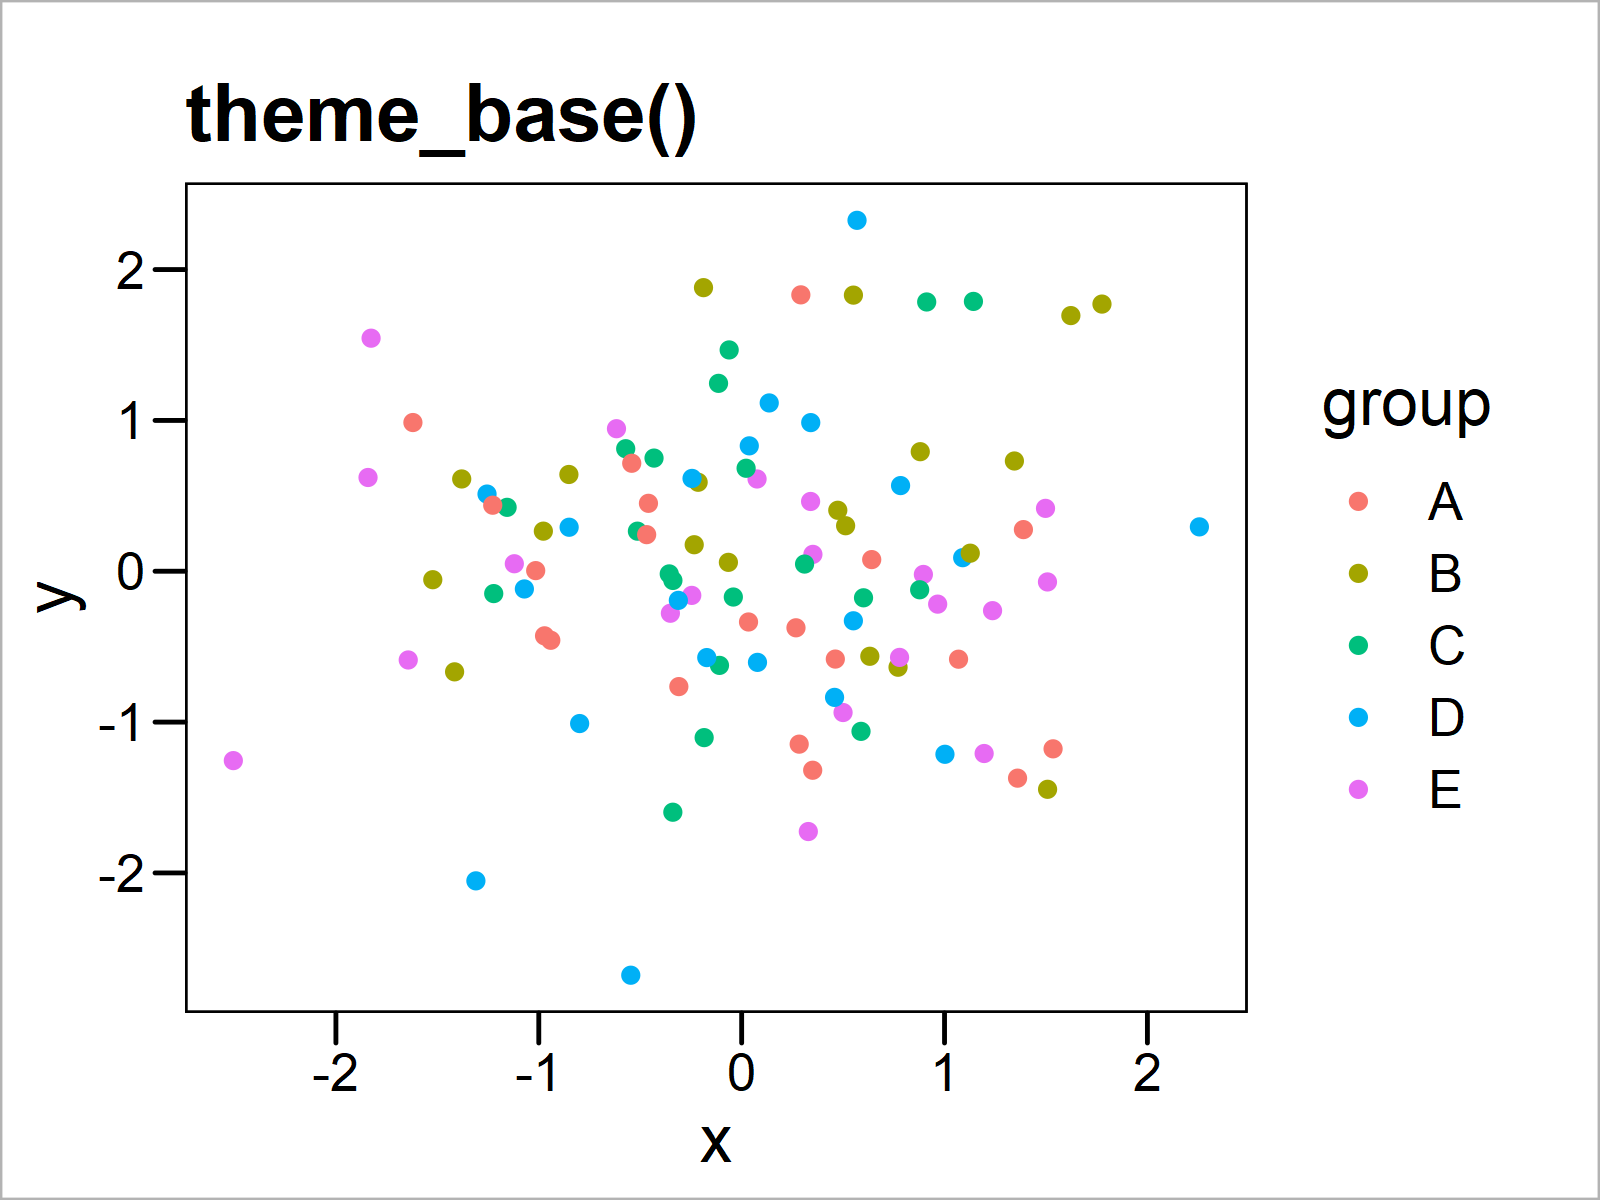
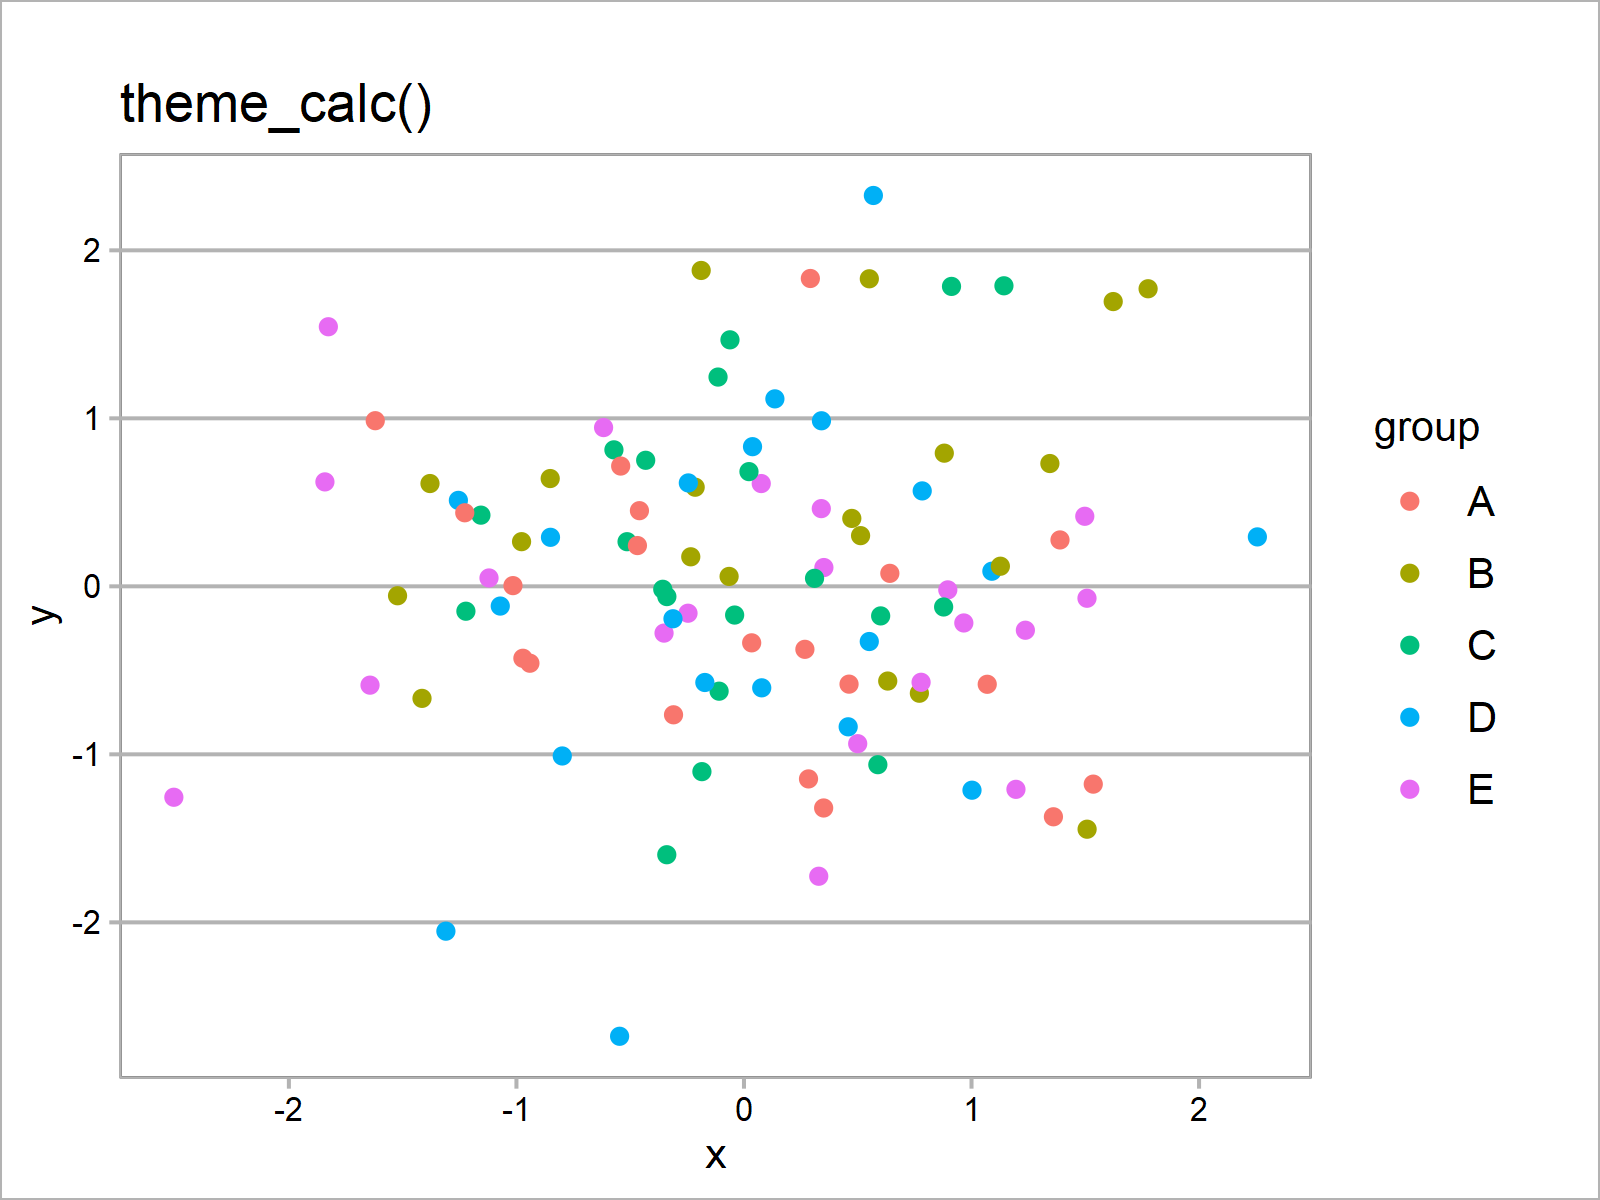
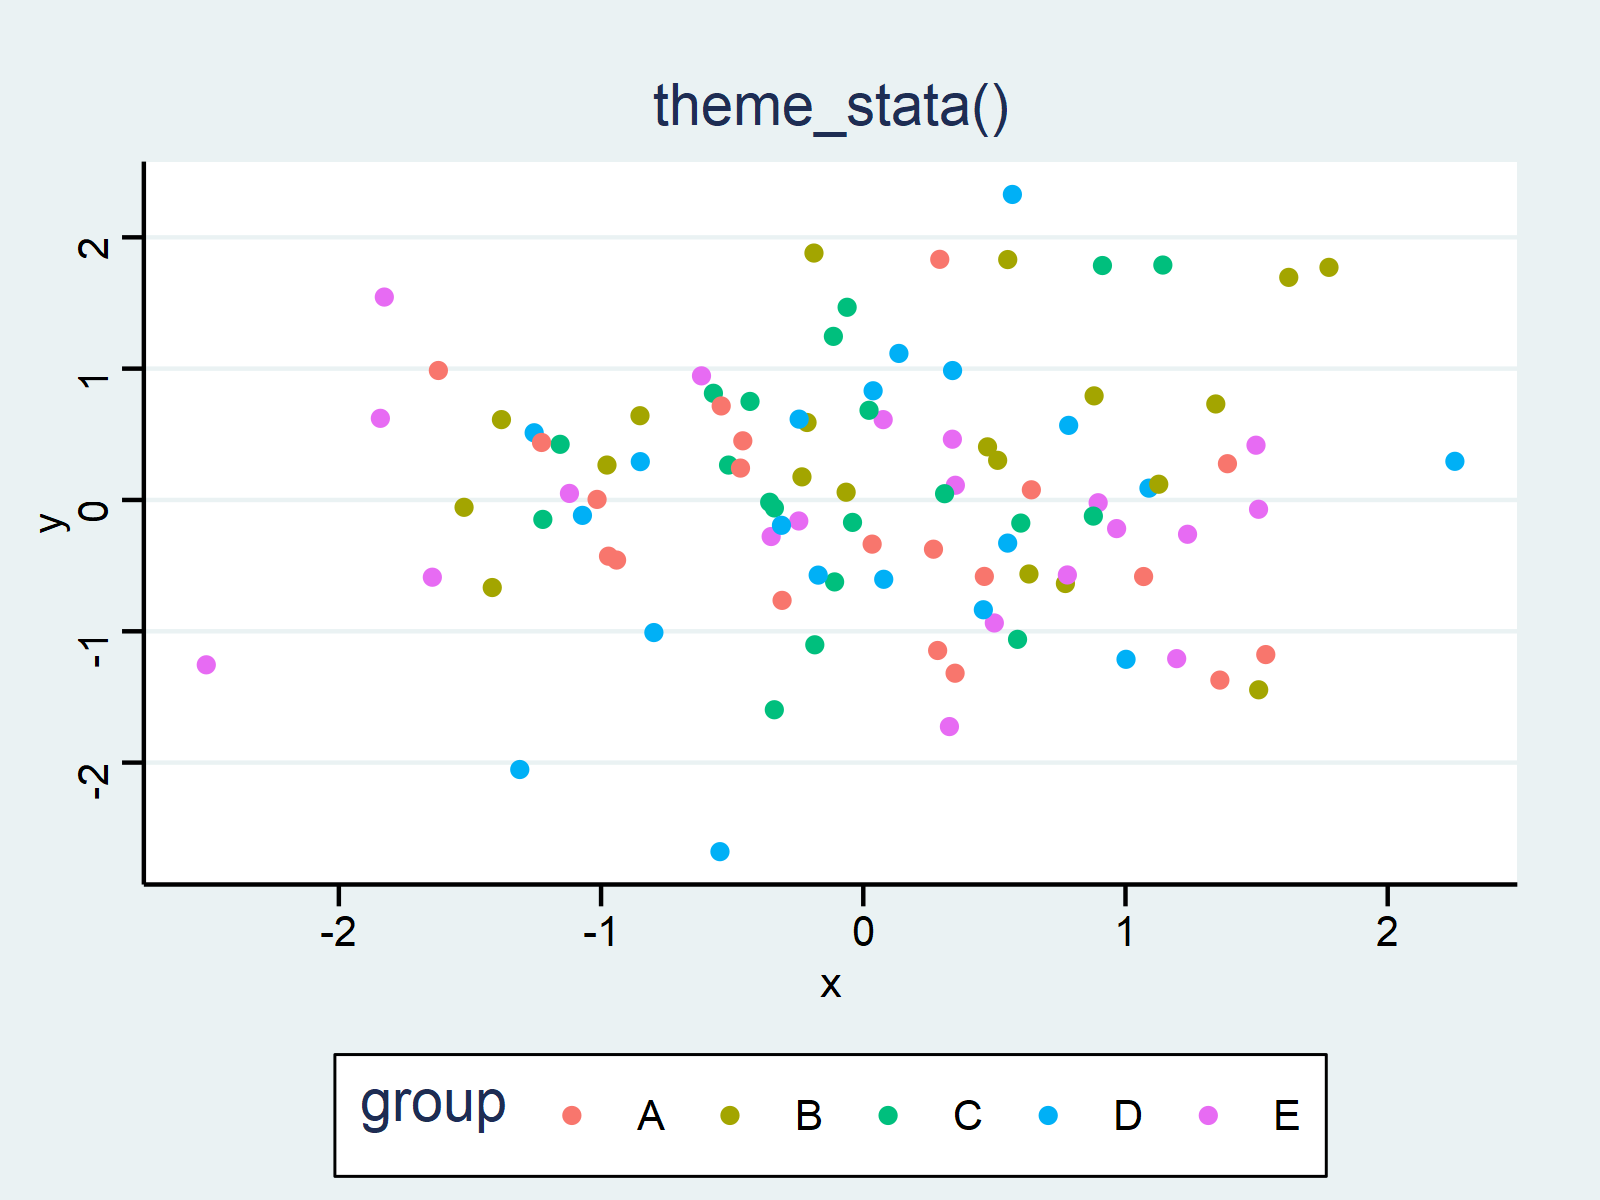
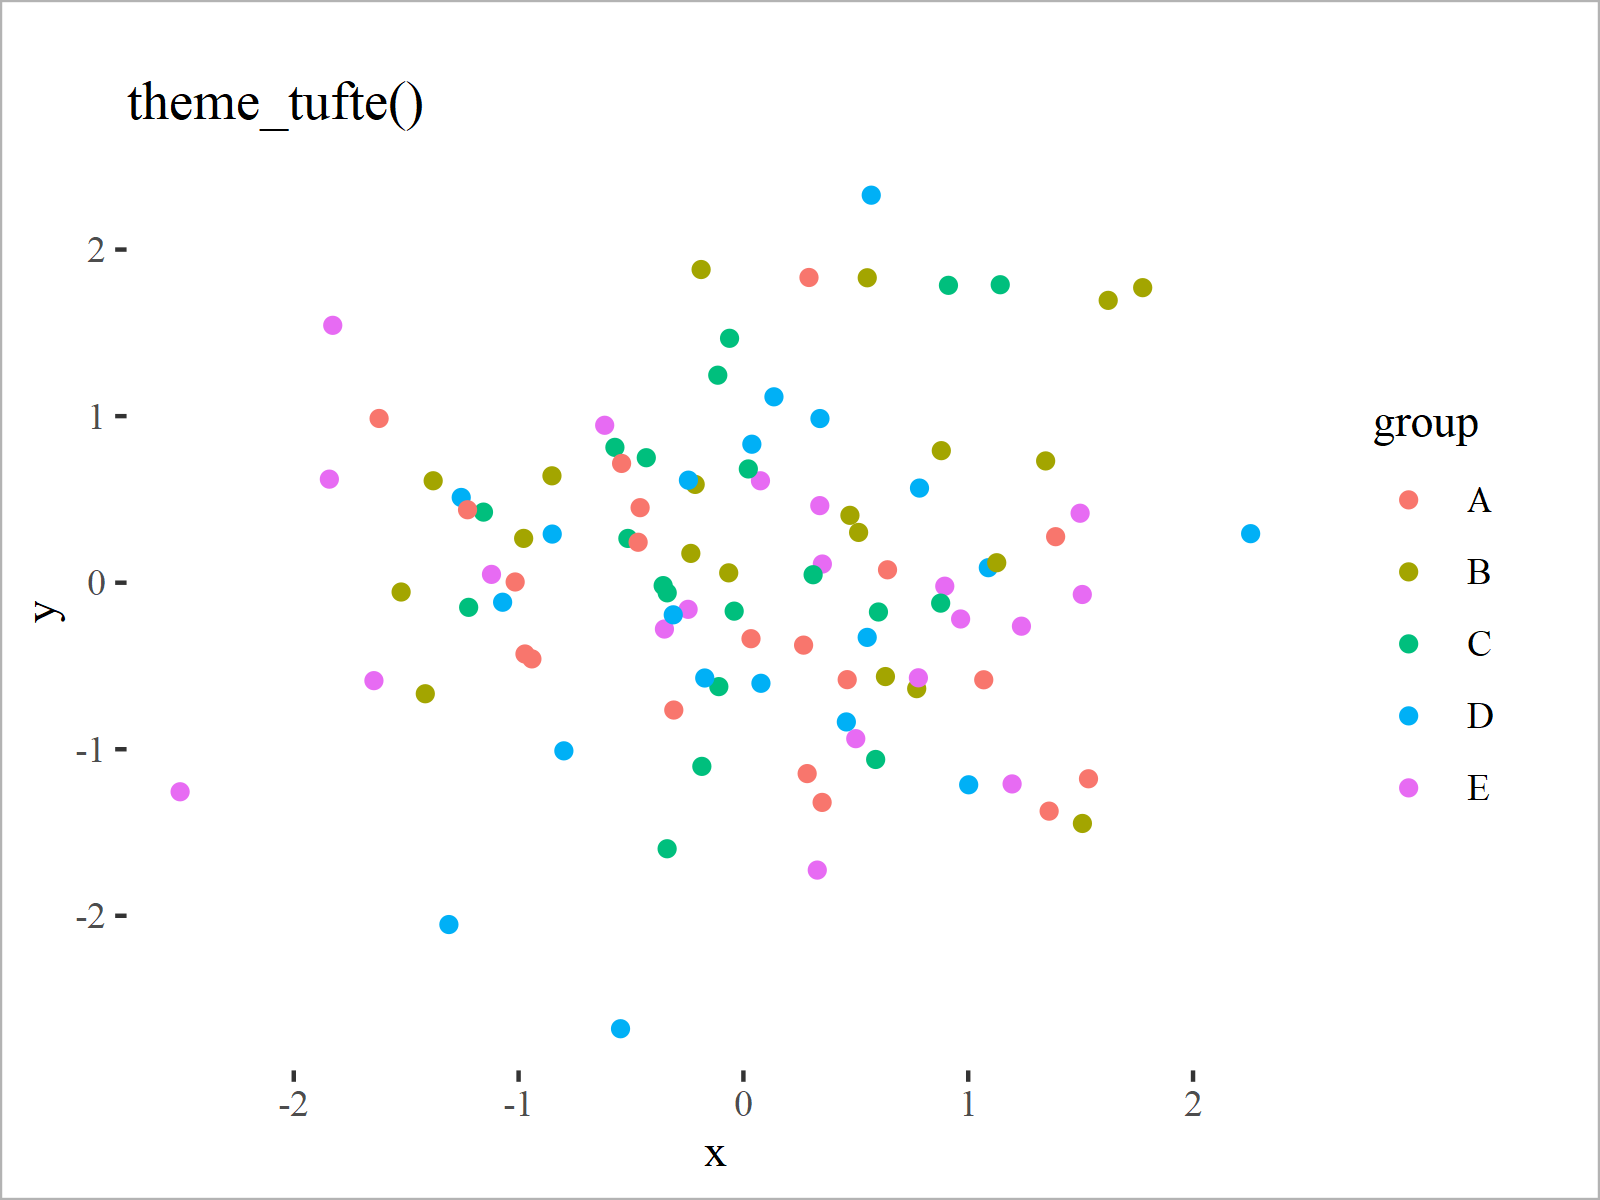
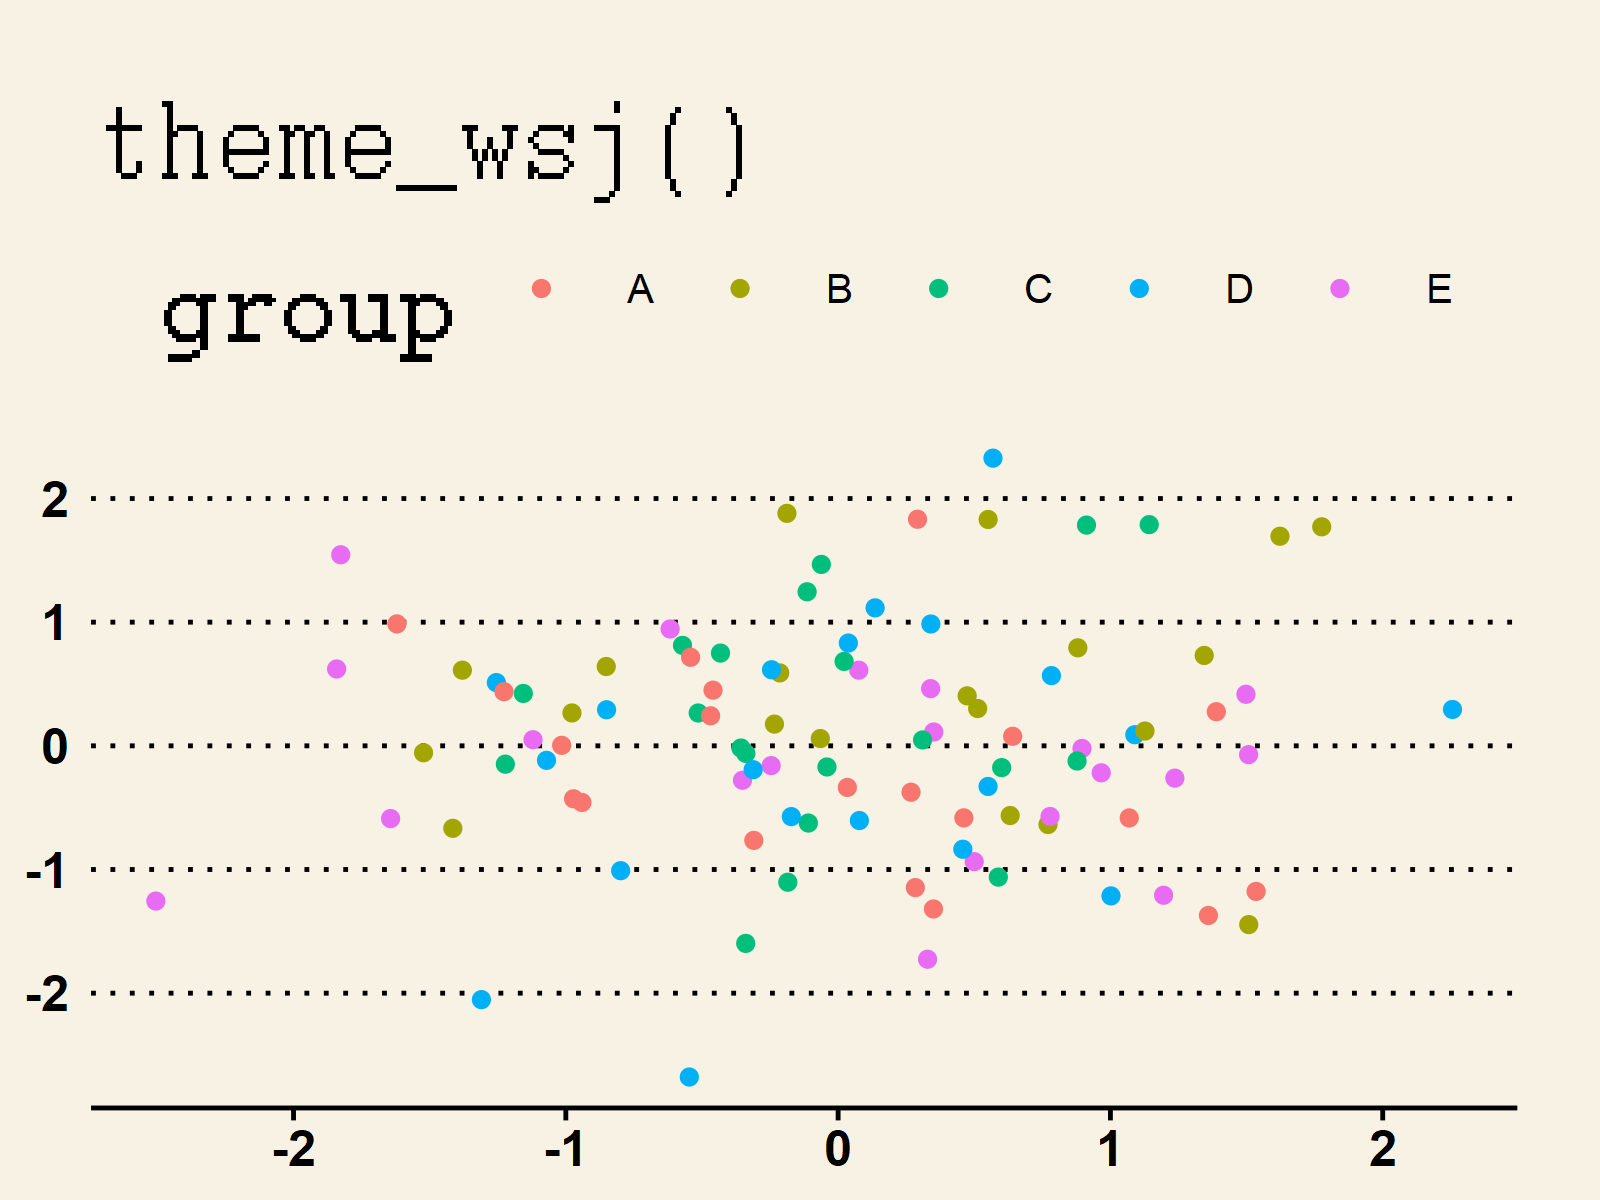
The following R codes and their graphical outputs show the different themes that are provided by the ggthemes package.
ggp_base <- ggp + theme_base() + ggtitle("theme_base()")
ggp_base
ggp_calc <- ggp + theme_calc() + ggtitle("theme_calc()")
ggp_calc
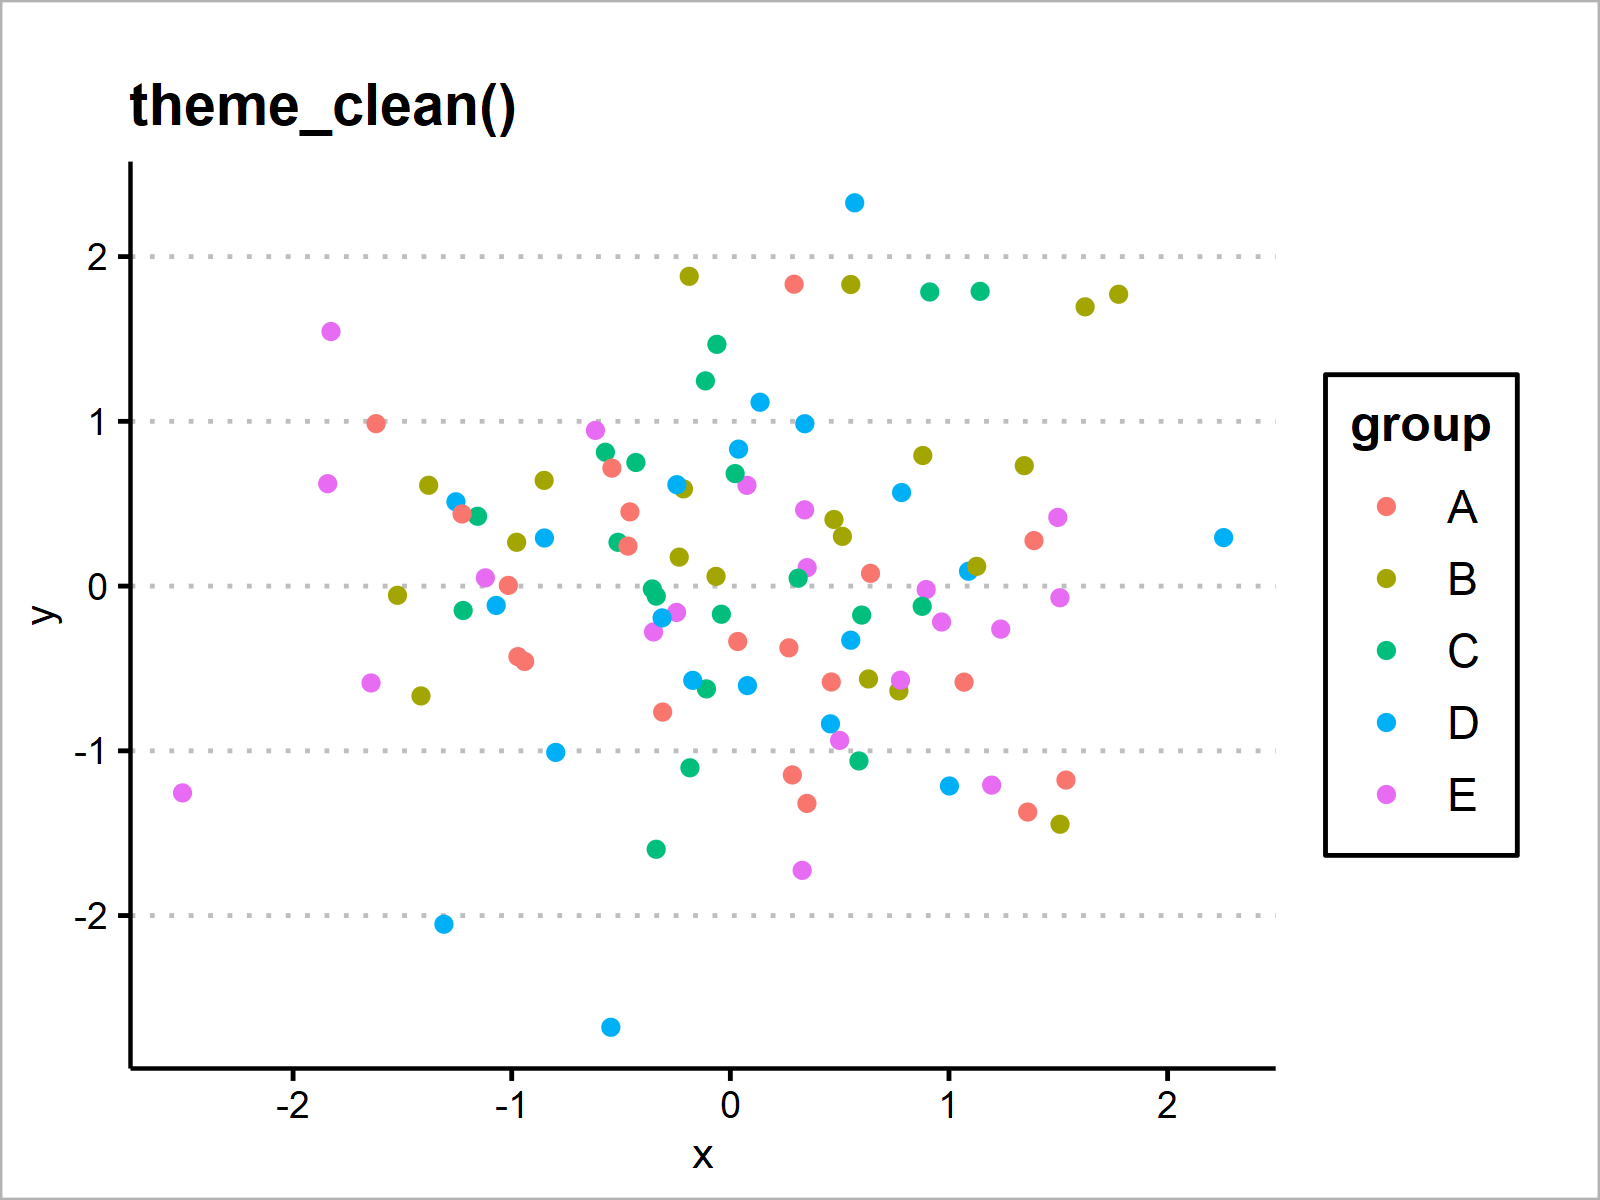
ggp_clean <- ggp + theme_clean() + ggtitle("theme_clean()")
ggp_clean
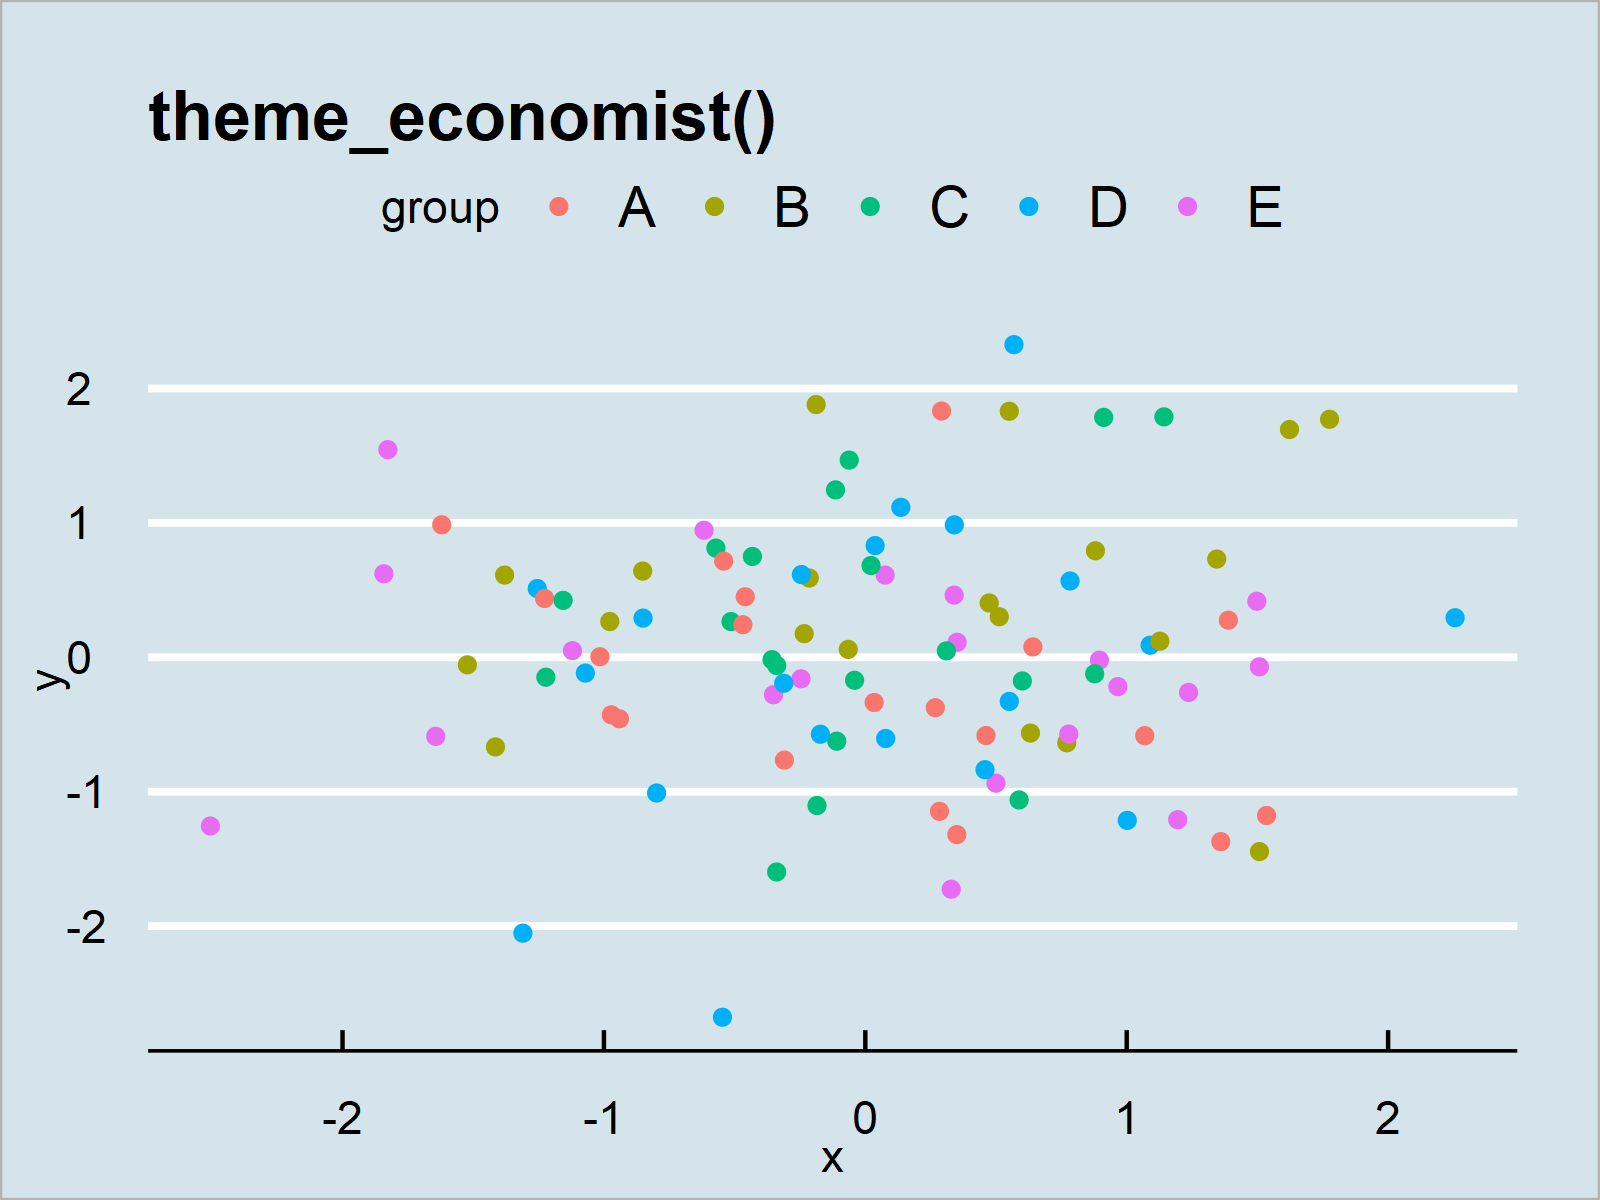
ggp_economist <- ggp + theme_economist() + ggtitle("theme_economist()")
ggp_economist
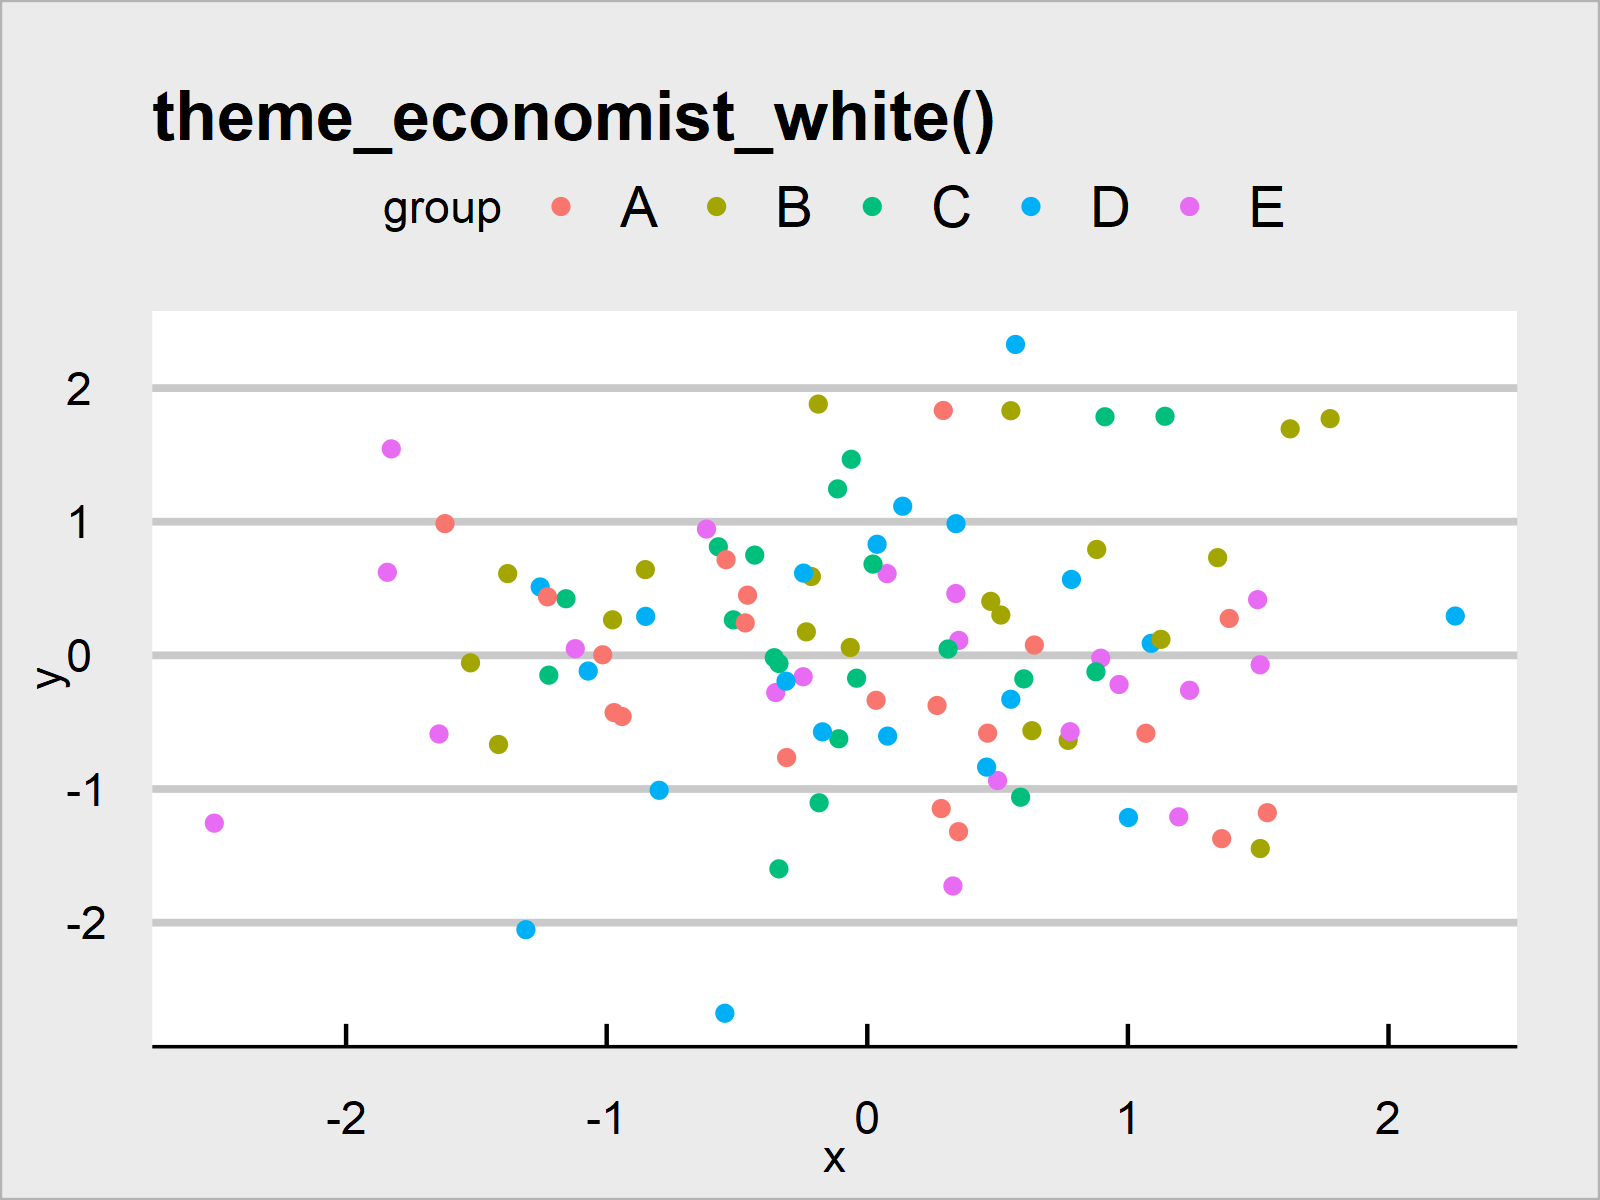
ggp_economist_white <- ggp + theme_economist_white() + ggtitle("theme_economist_white()")
ggp_economist_white
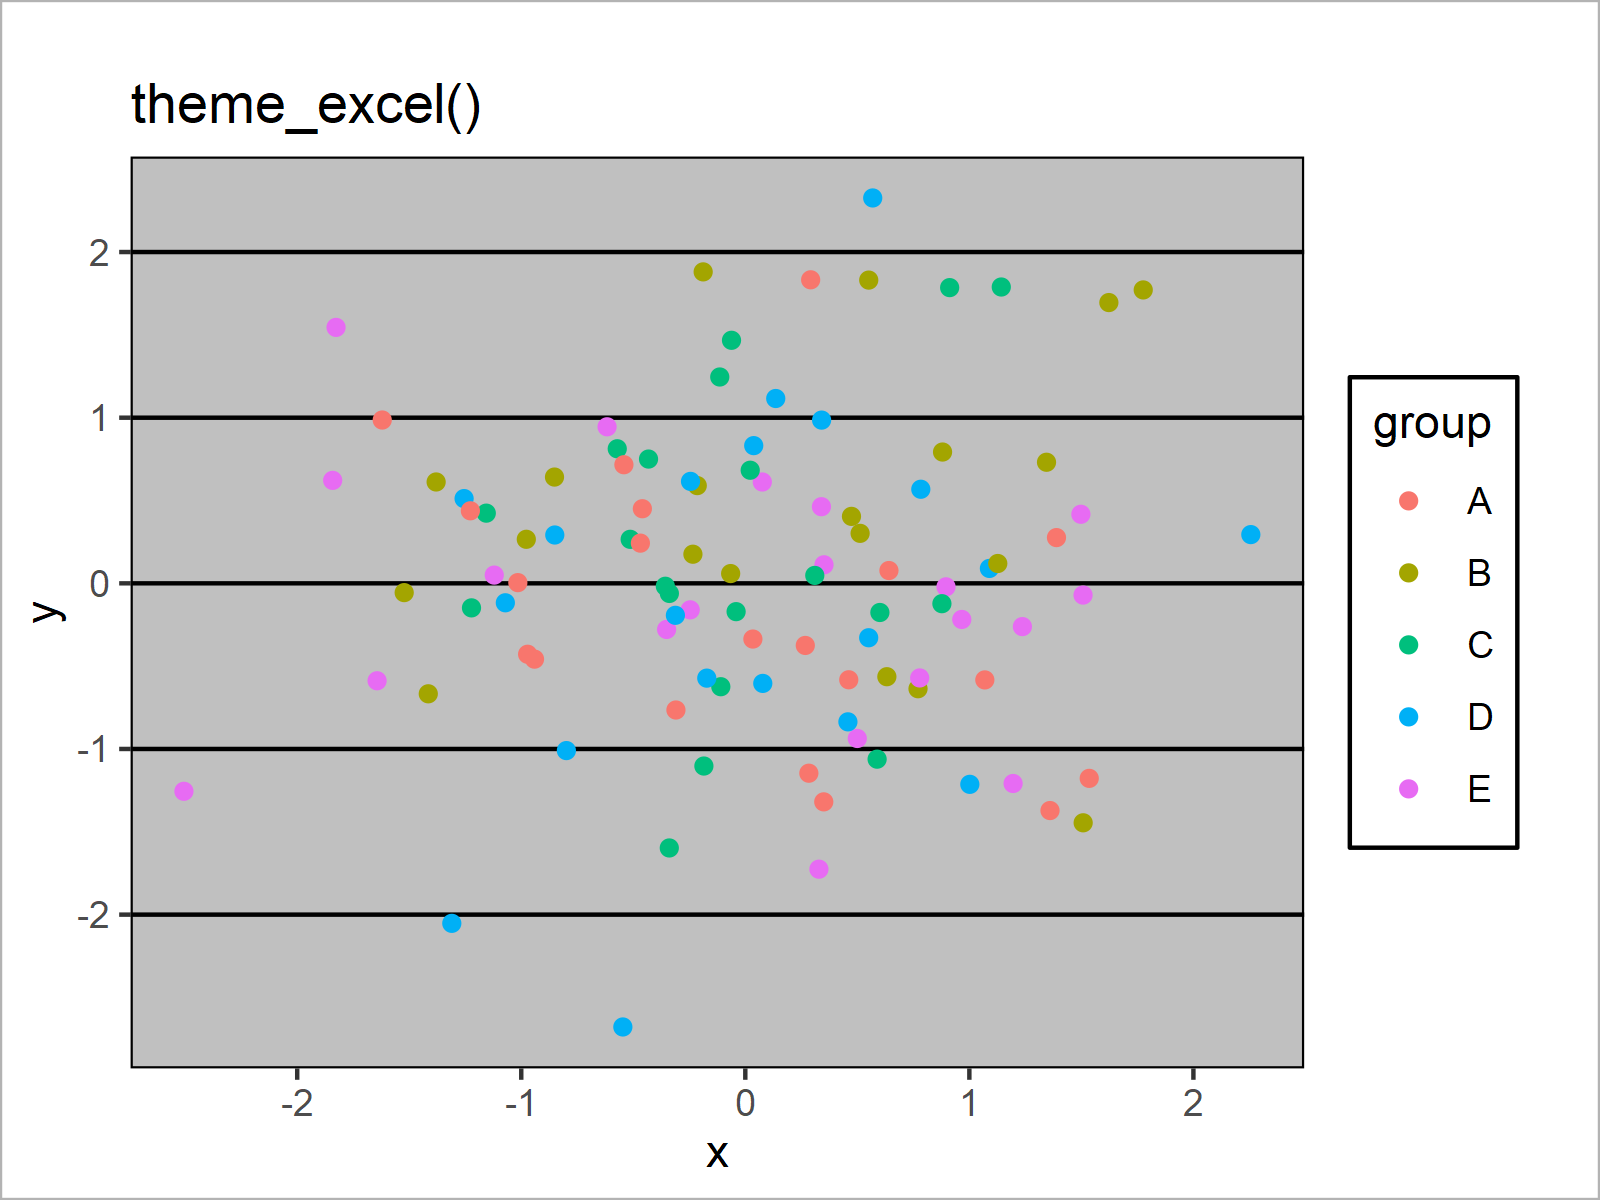
ggp_excel <- ggp + theme_excel() + ggtitle("theme_excel()")
ggp_excel
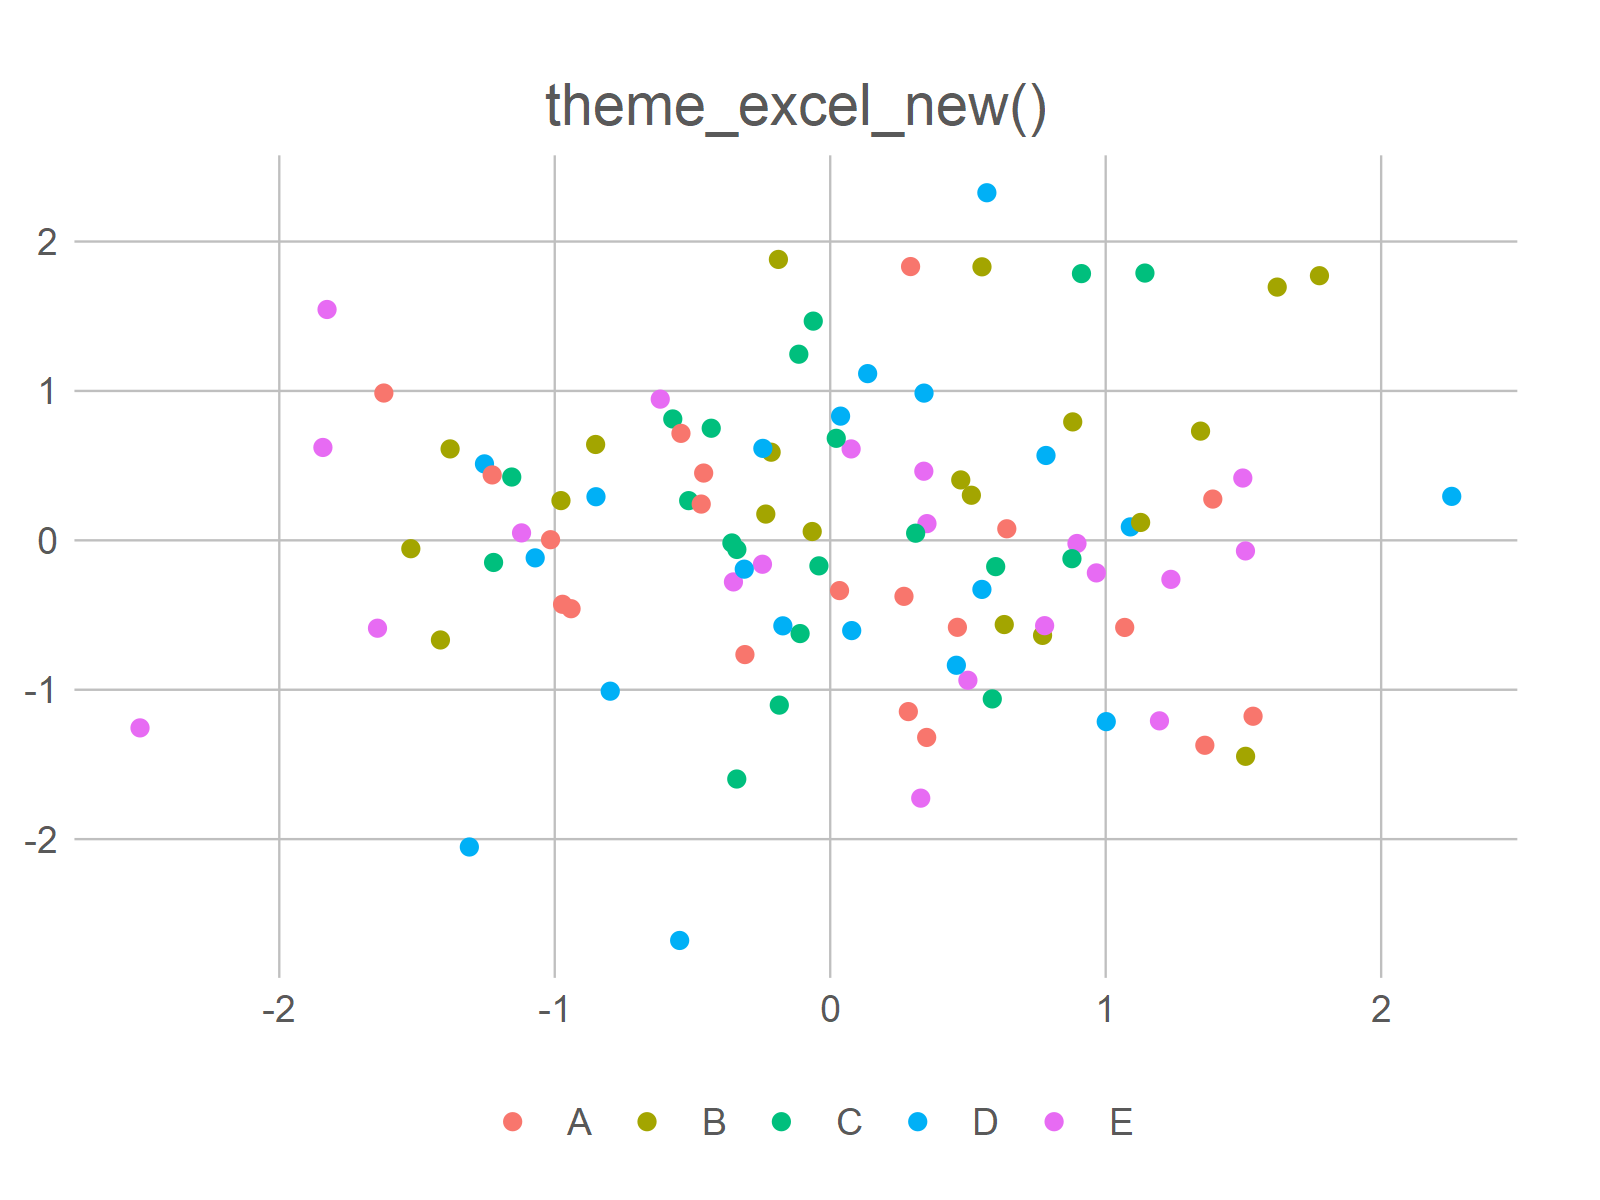
ggp_excel_new <- ggp + theme_excel_new() + ggtitle("theme_excel_new()")
ggp_excel_new
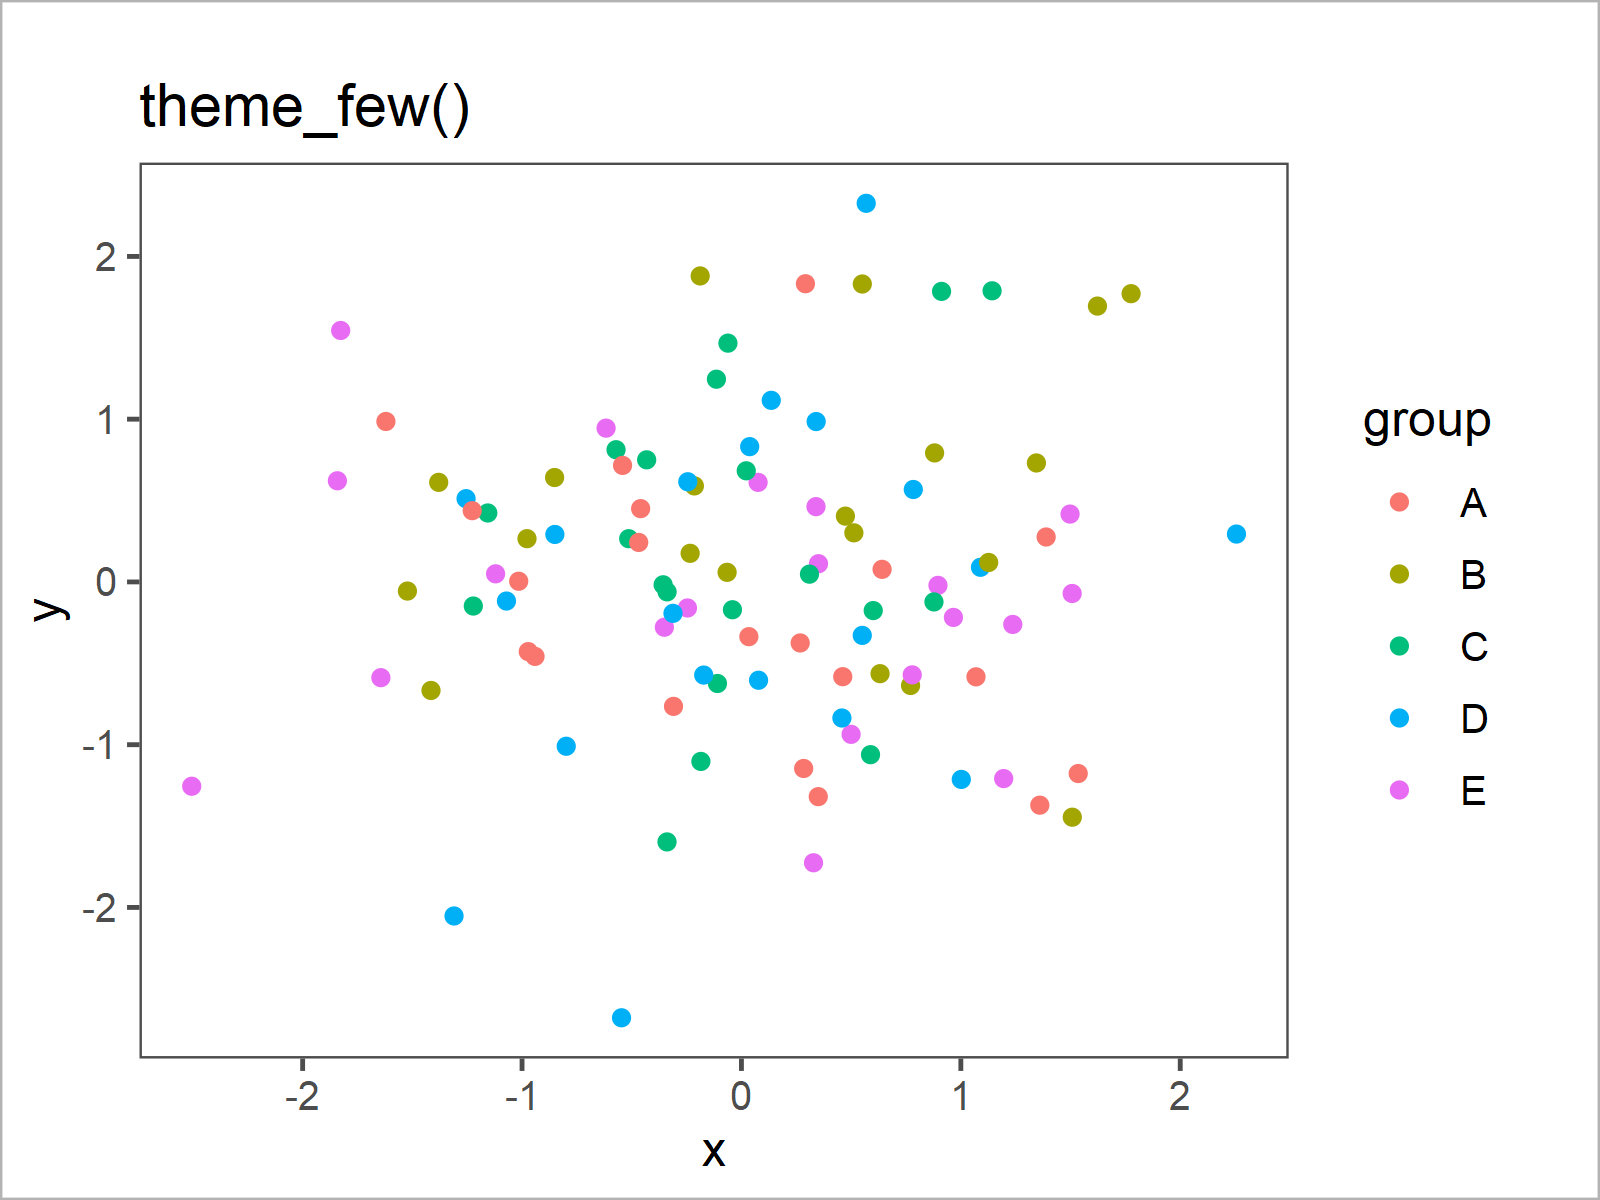
ggp_few <- ggp + theme_few() + ggtitle("theme_few()")
ggp_few
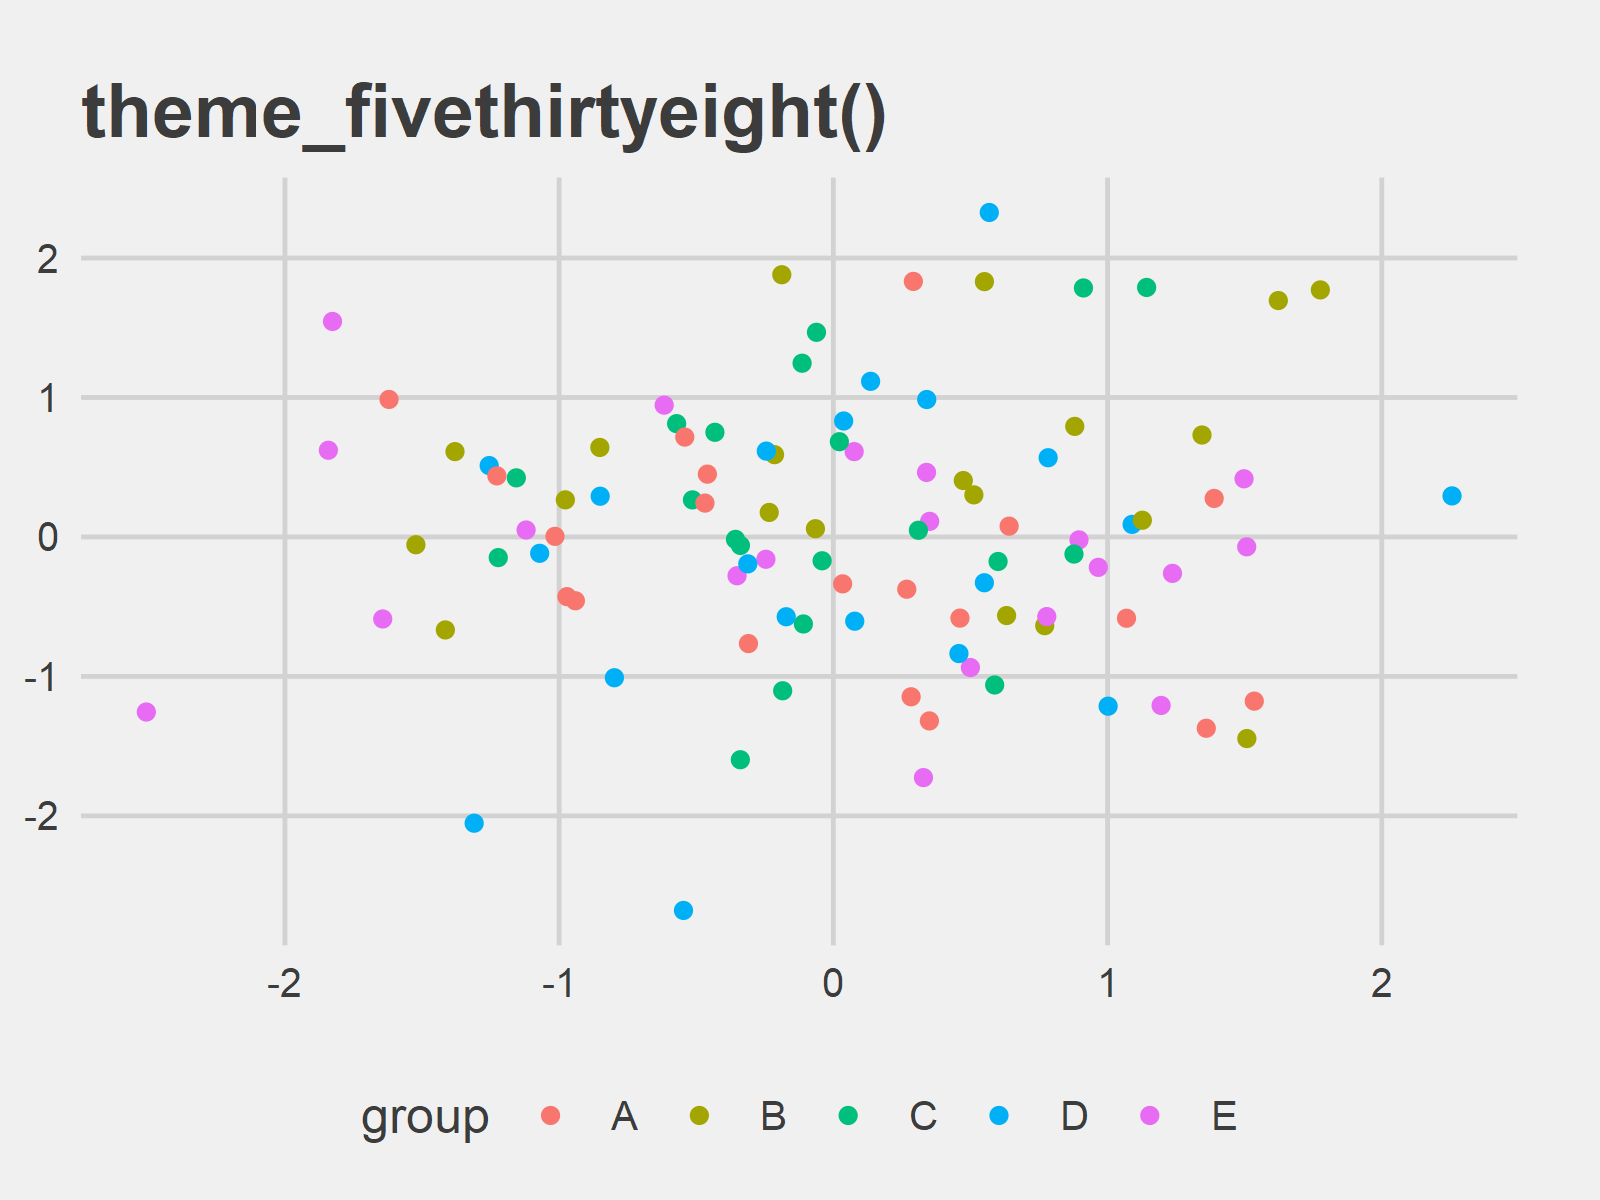
ggp_fivethirtyeight <- ggp + theme_fivethirtyeight() + ggtitle("theme_fivethirtyeight()")
ggp_fivethirtyeight
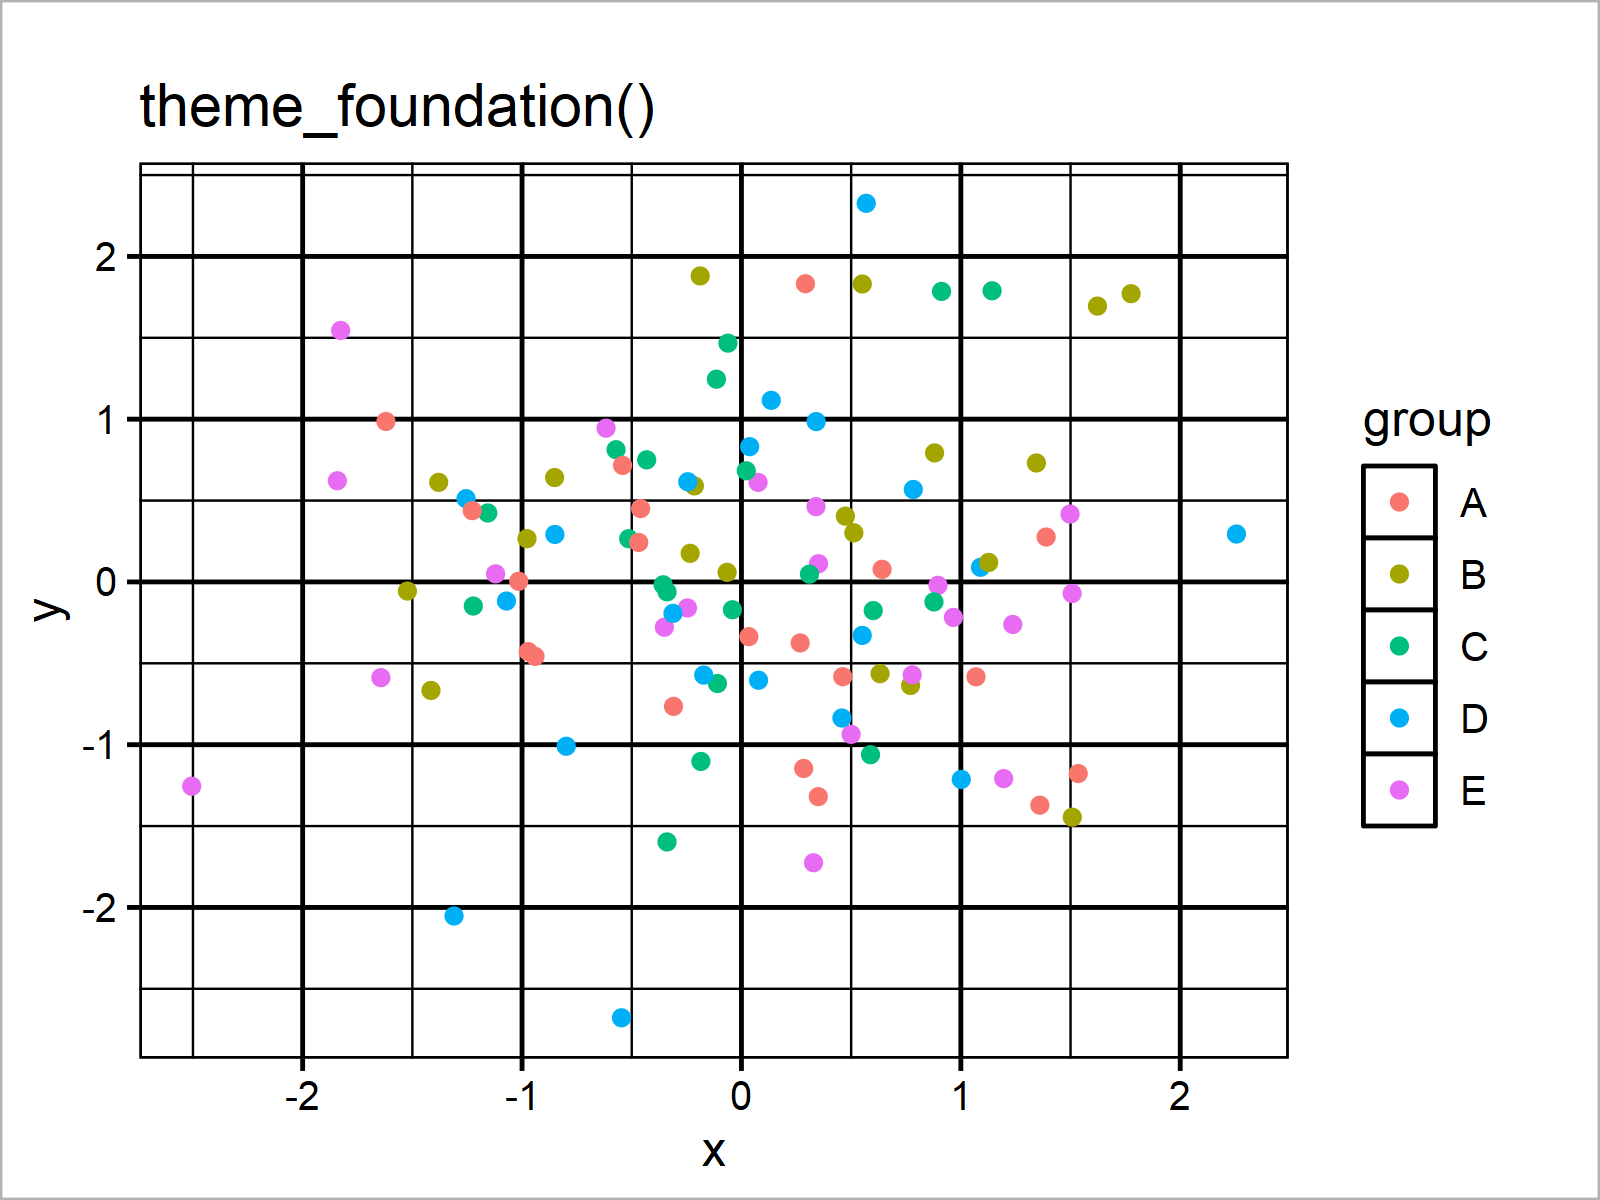
ggp_foundation <- ggp + theme_foundation() + ggtitle("theme_foundation()")
ggp_foundation
ggp_gdocs <- ggp + theme_gdocs() + ggtitle("theme_gdocs()")
ggp_gdocs
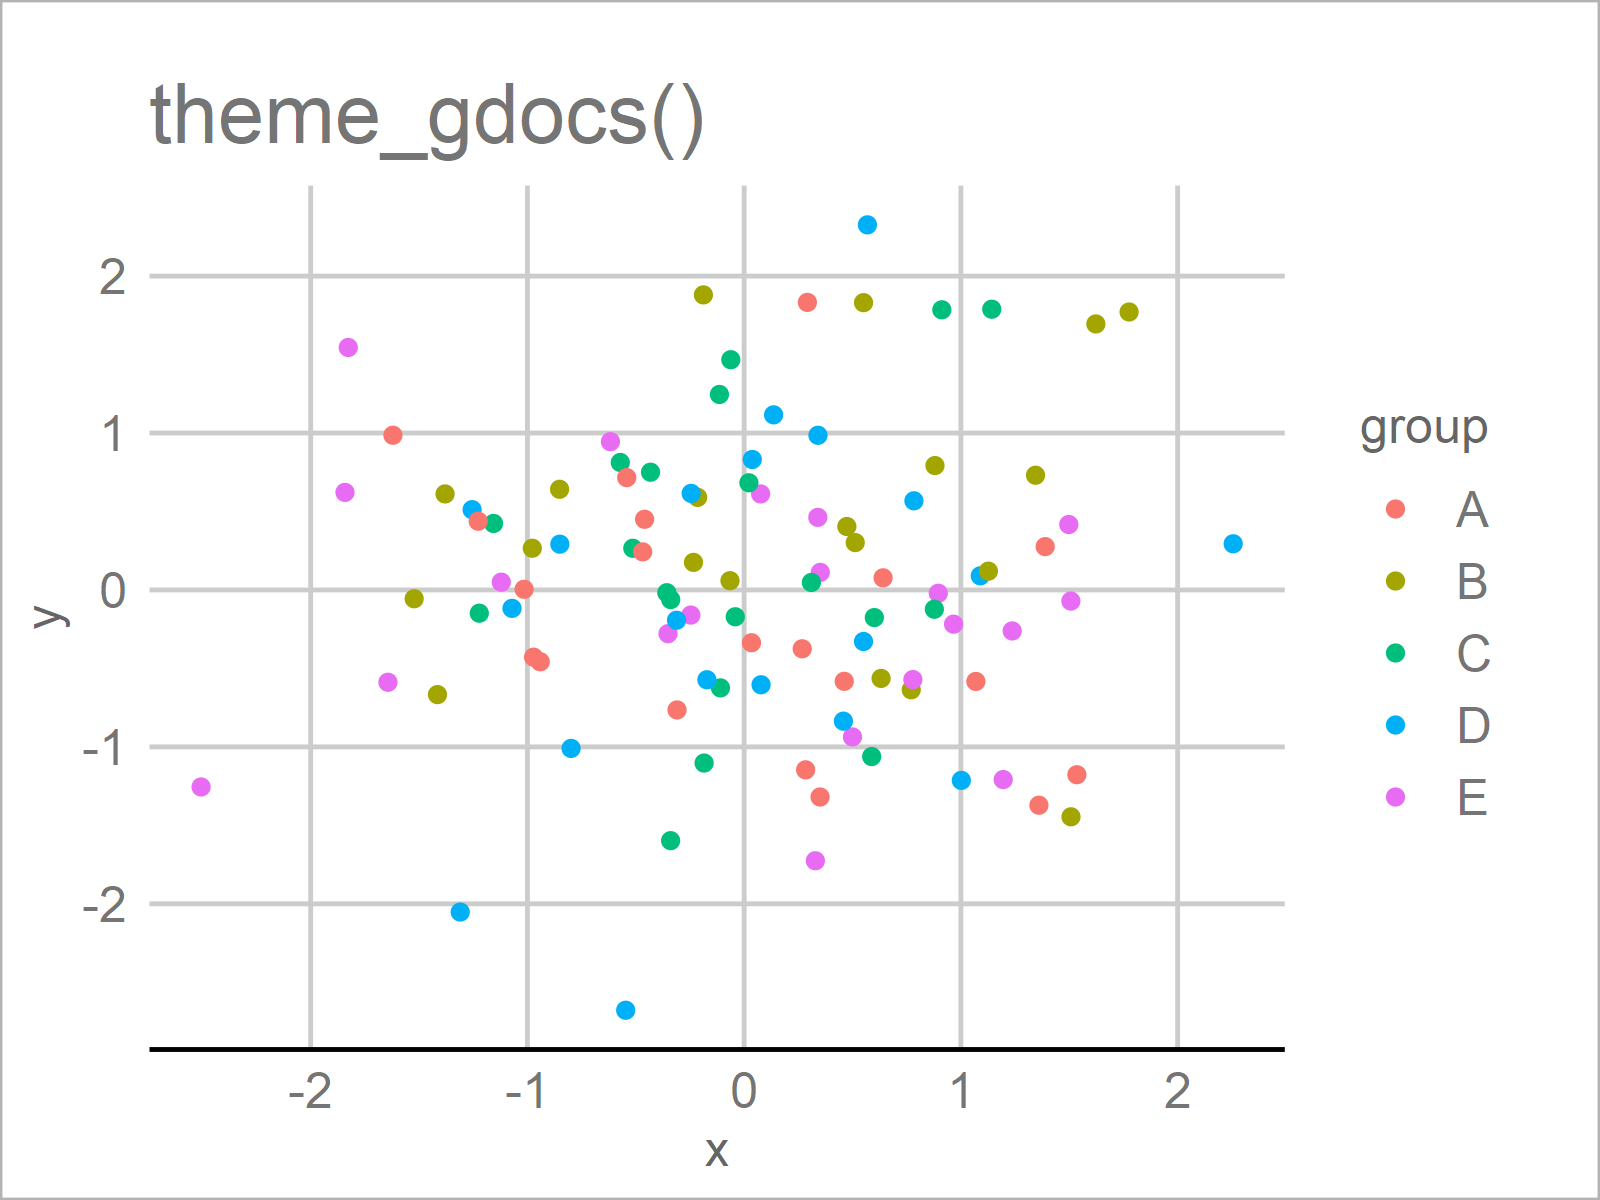
ggp_hc <- ggp + theme_hc() + ggtitle("theme_hc()")
ggp_hc
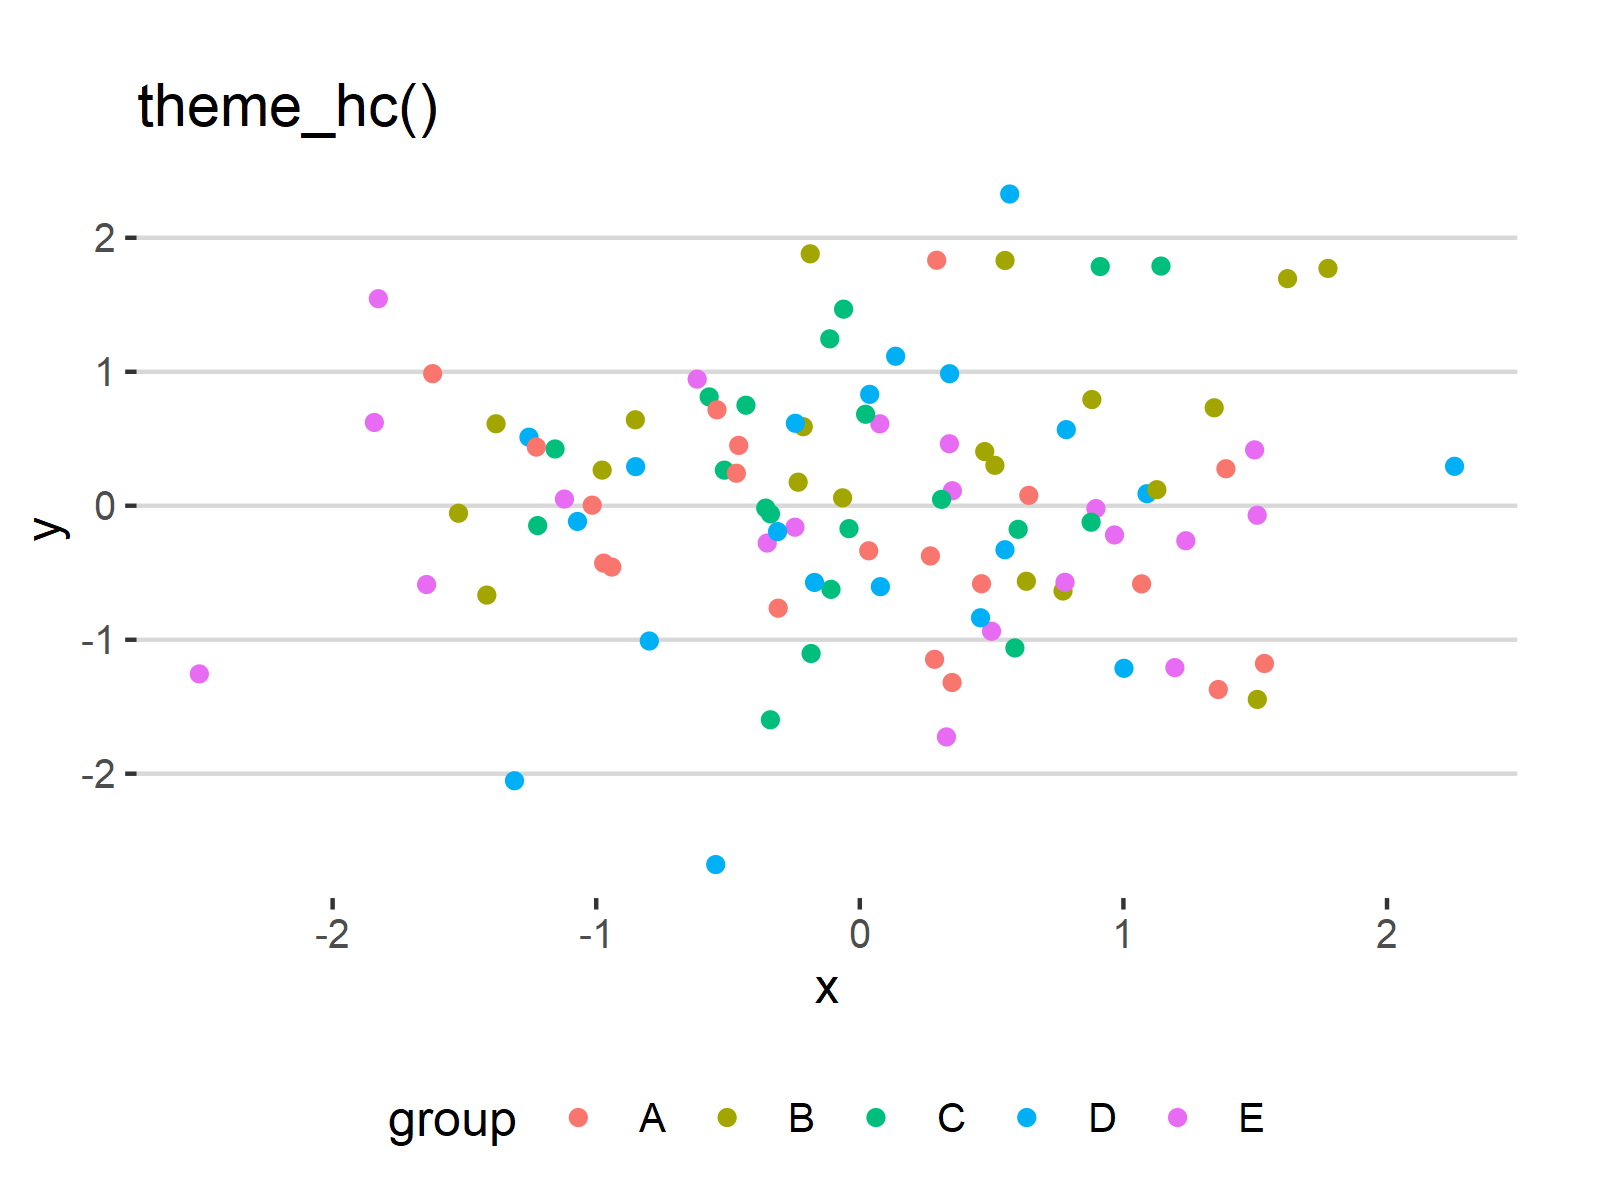
ggp_igray <- ggp + theme_igray() + ggtitle("theme_igray()")
ggp_igray
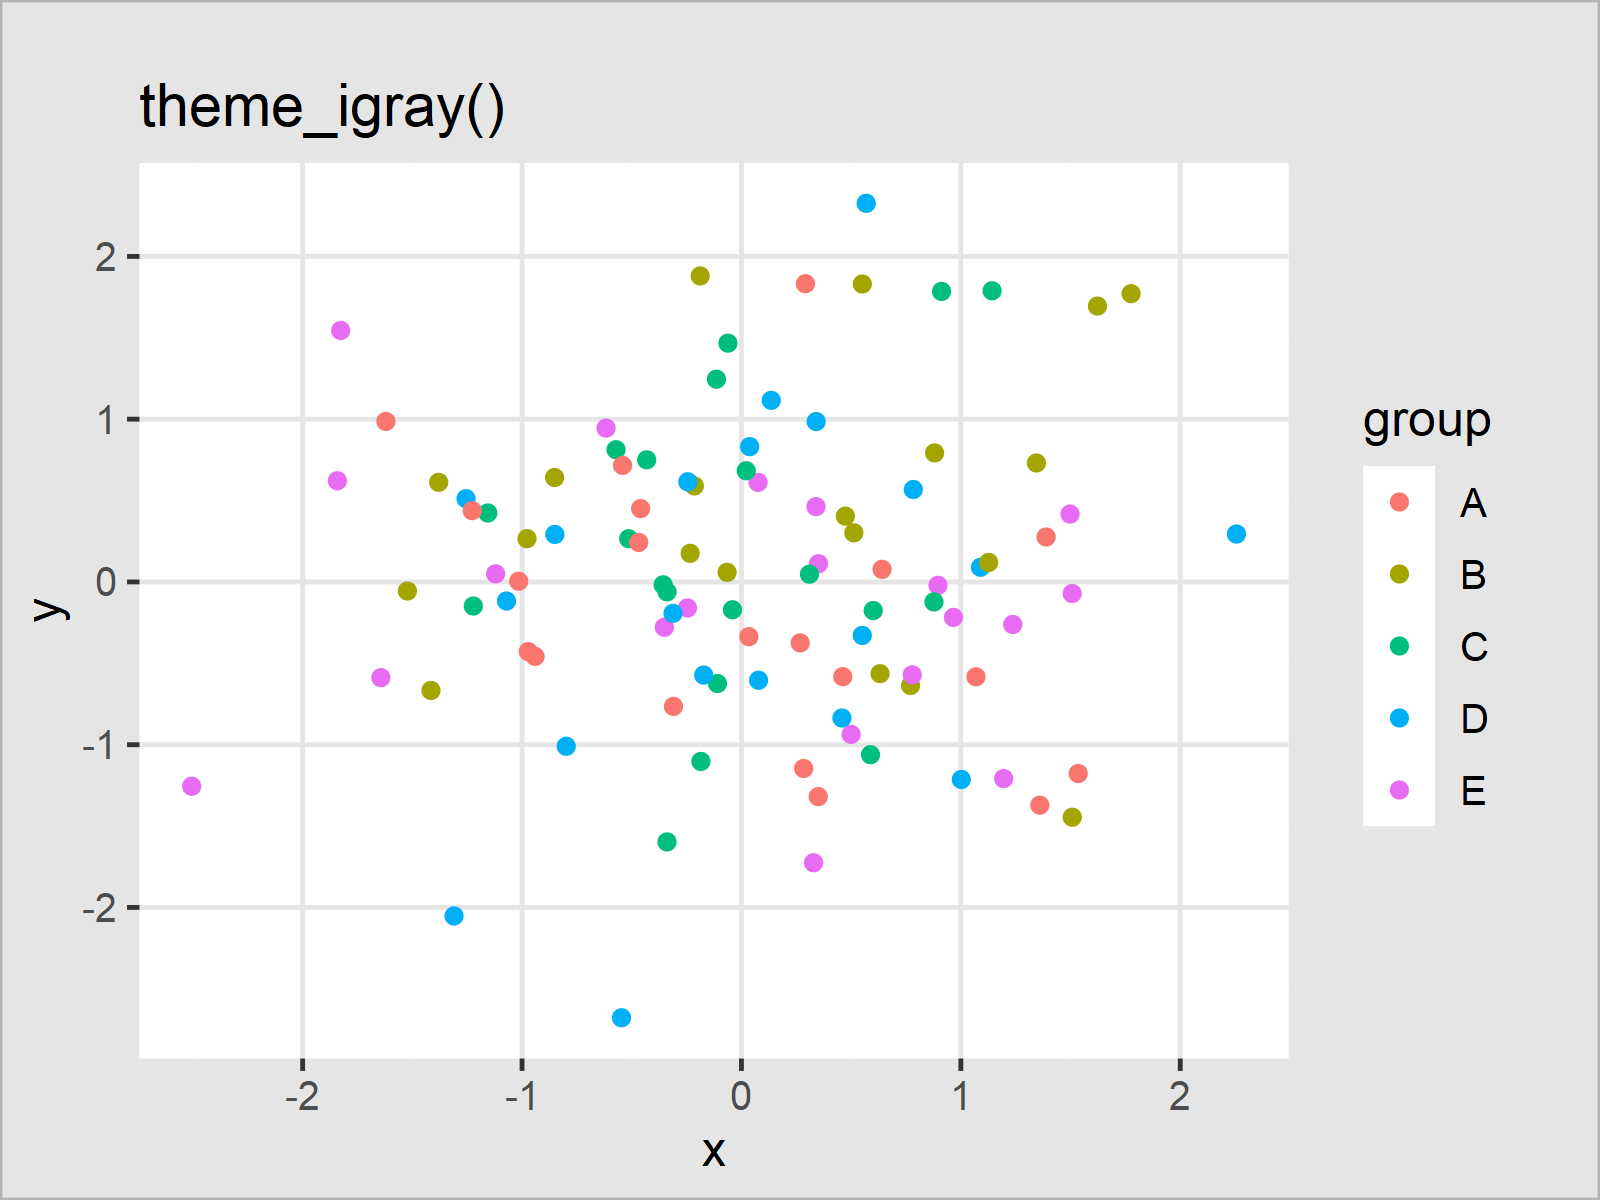
ggp_map <- ggp + theme_map() + ggtitle("theme_map()")
ggp_map
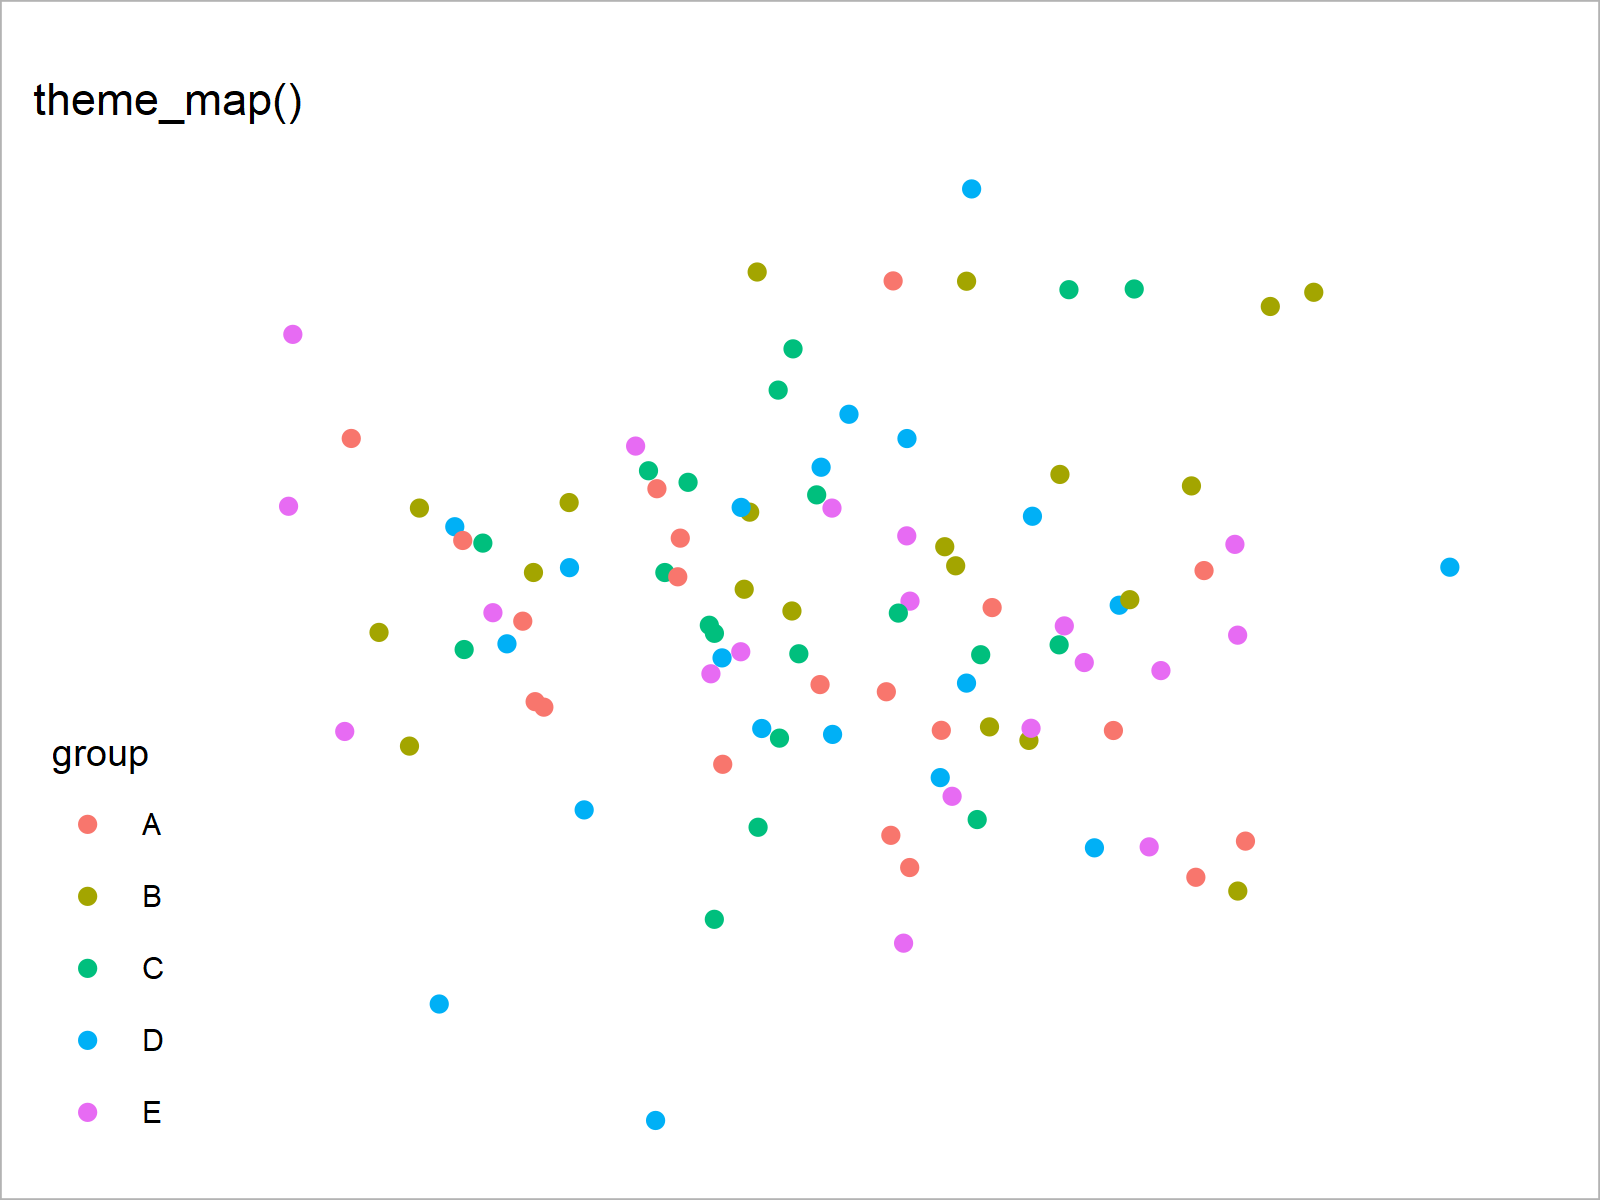
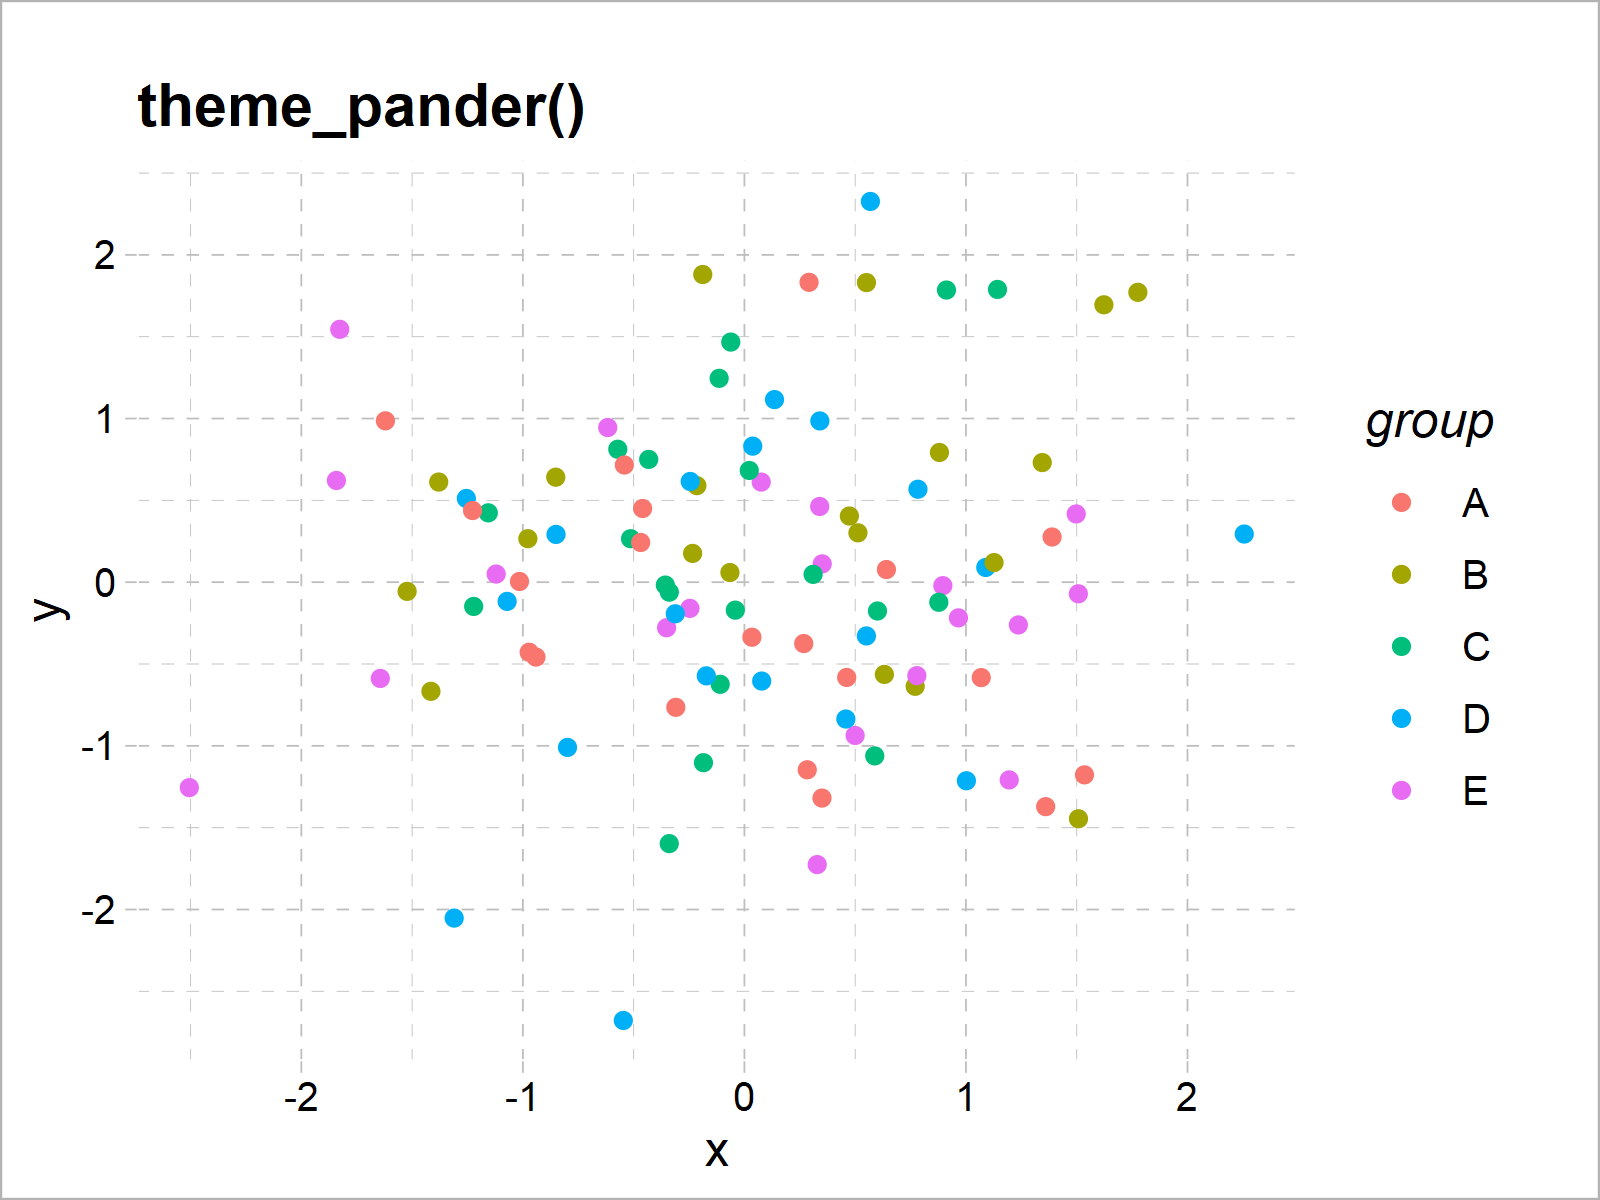
ggp_pander <- ggp + theme_pander() + ggtitle("theme_pander()")
ggp_pander
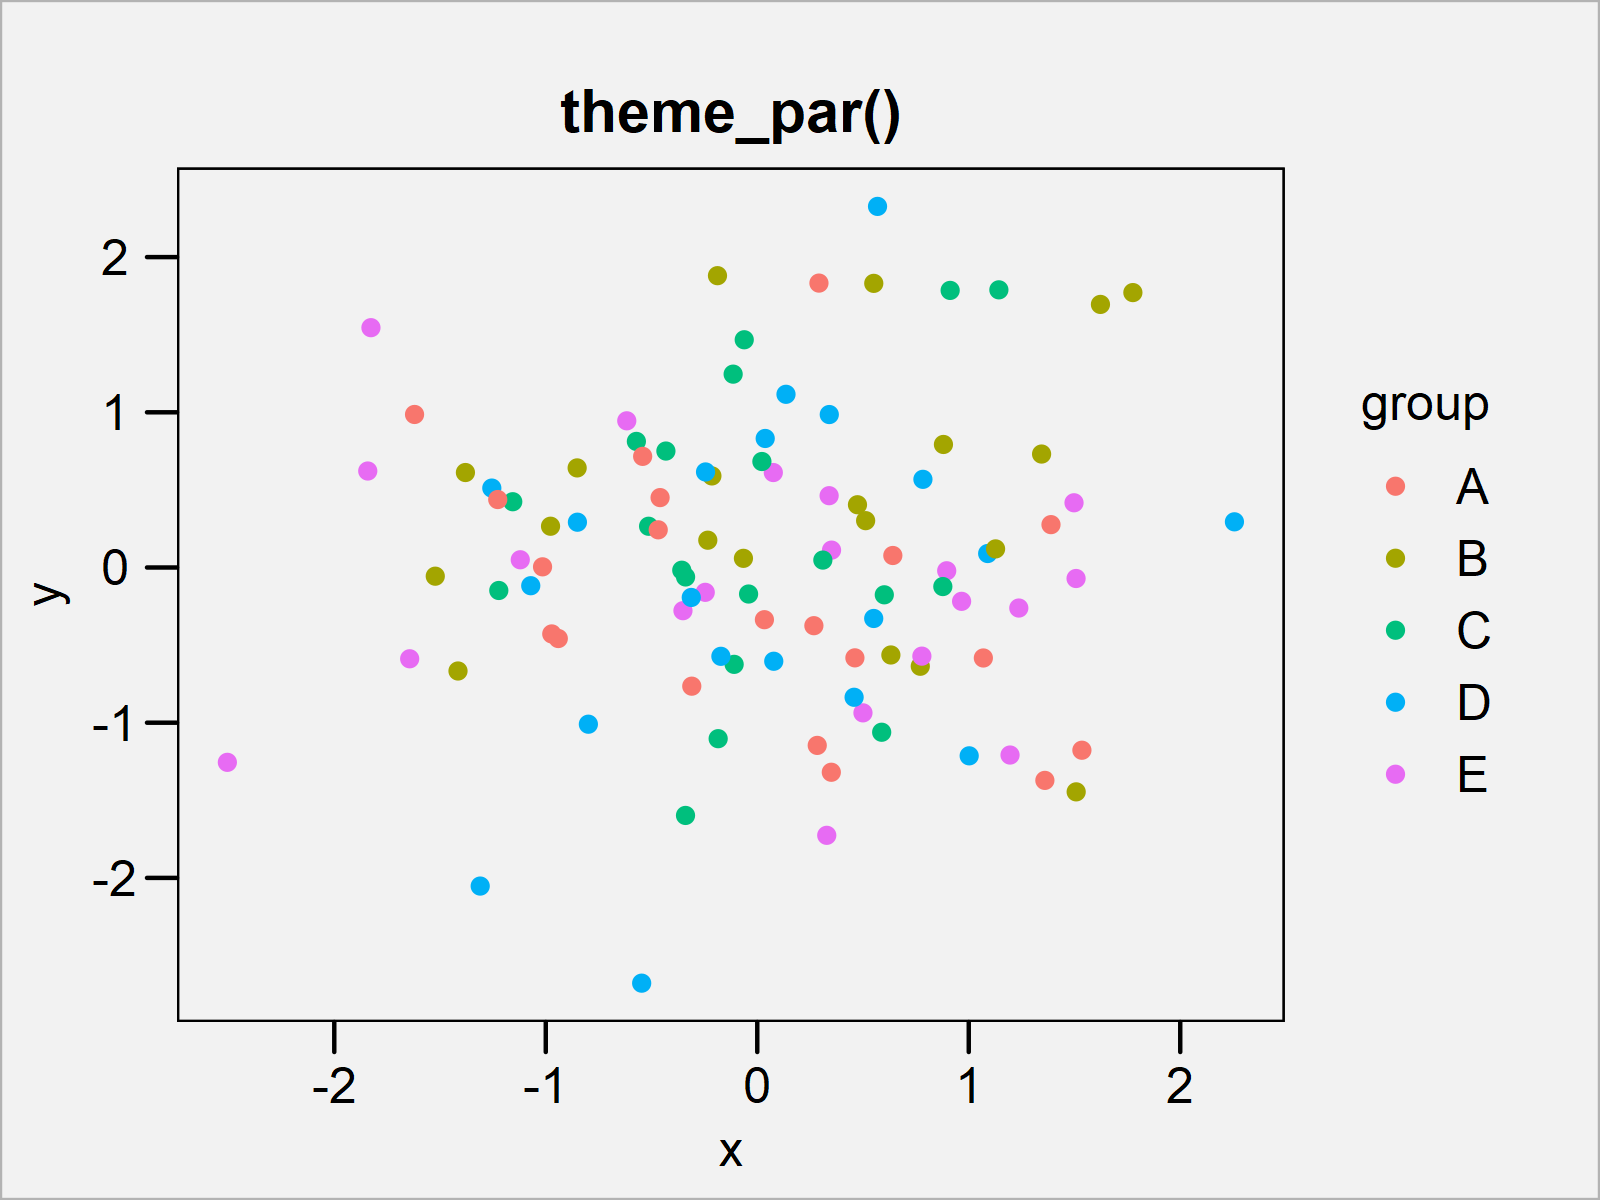
ggp_par <- ggp + theme_par() + ggtitle("theme_par()")
ggp_par
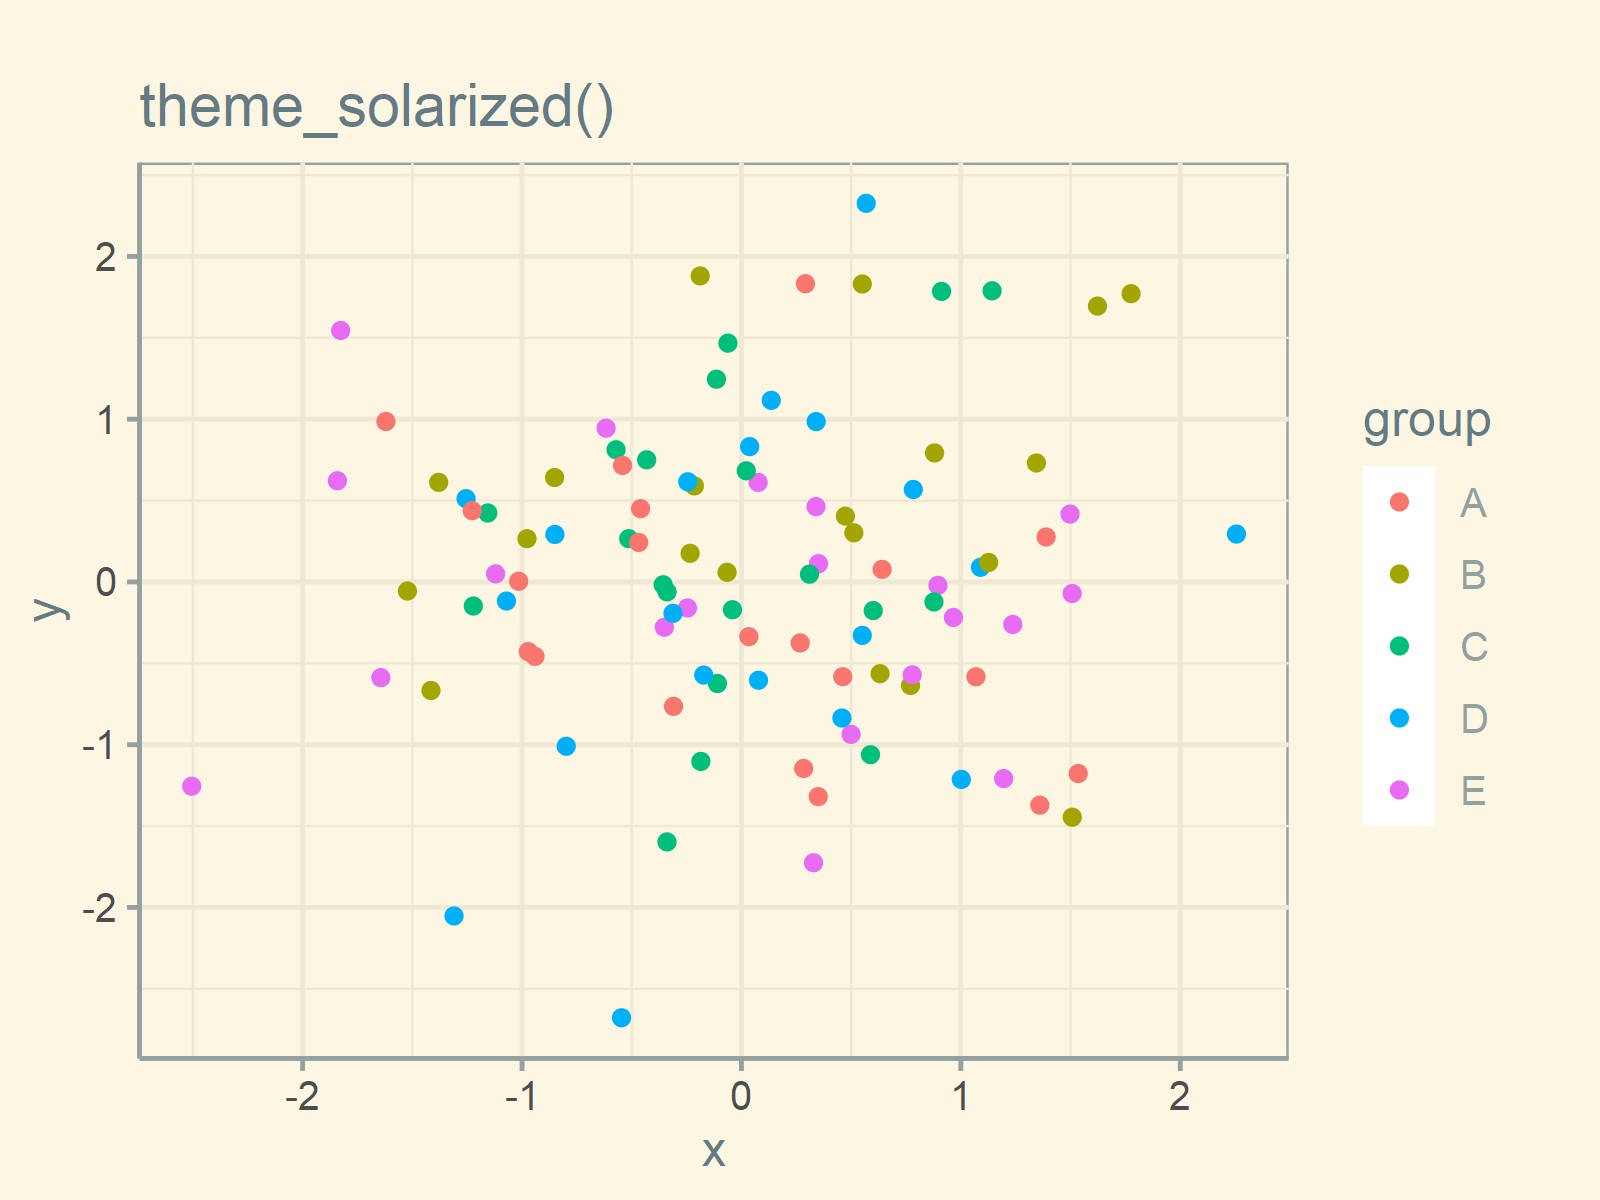
ggp_solarized <- ggp + theme_solarized() + ggtitle("theme_solarized()")
ggp_solarized
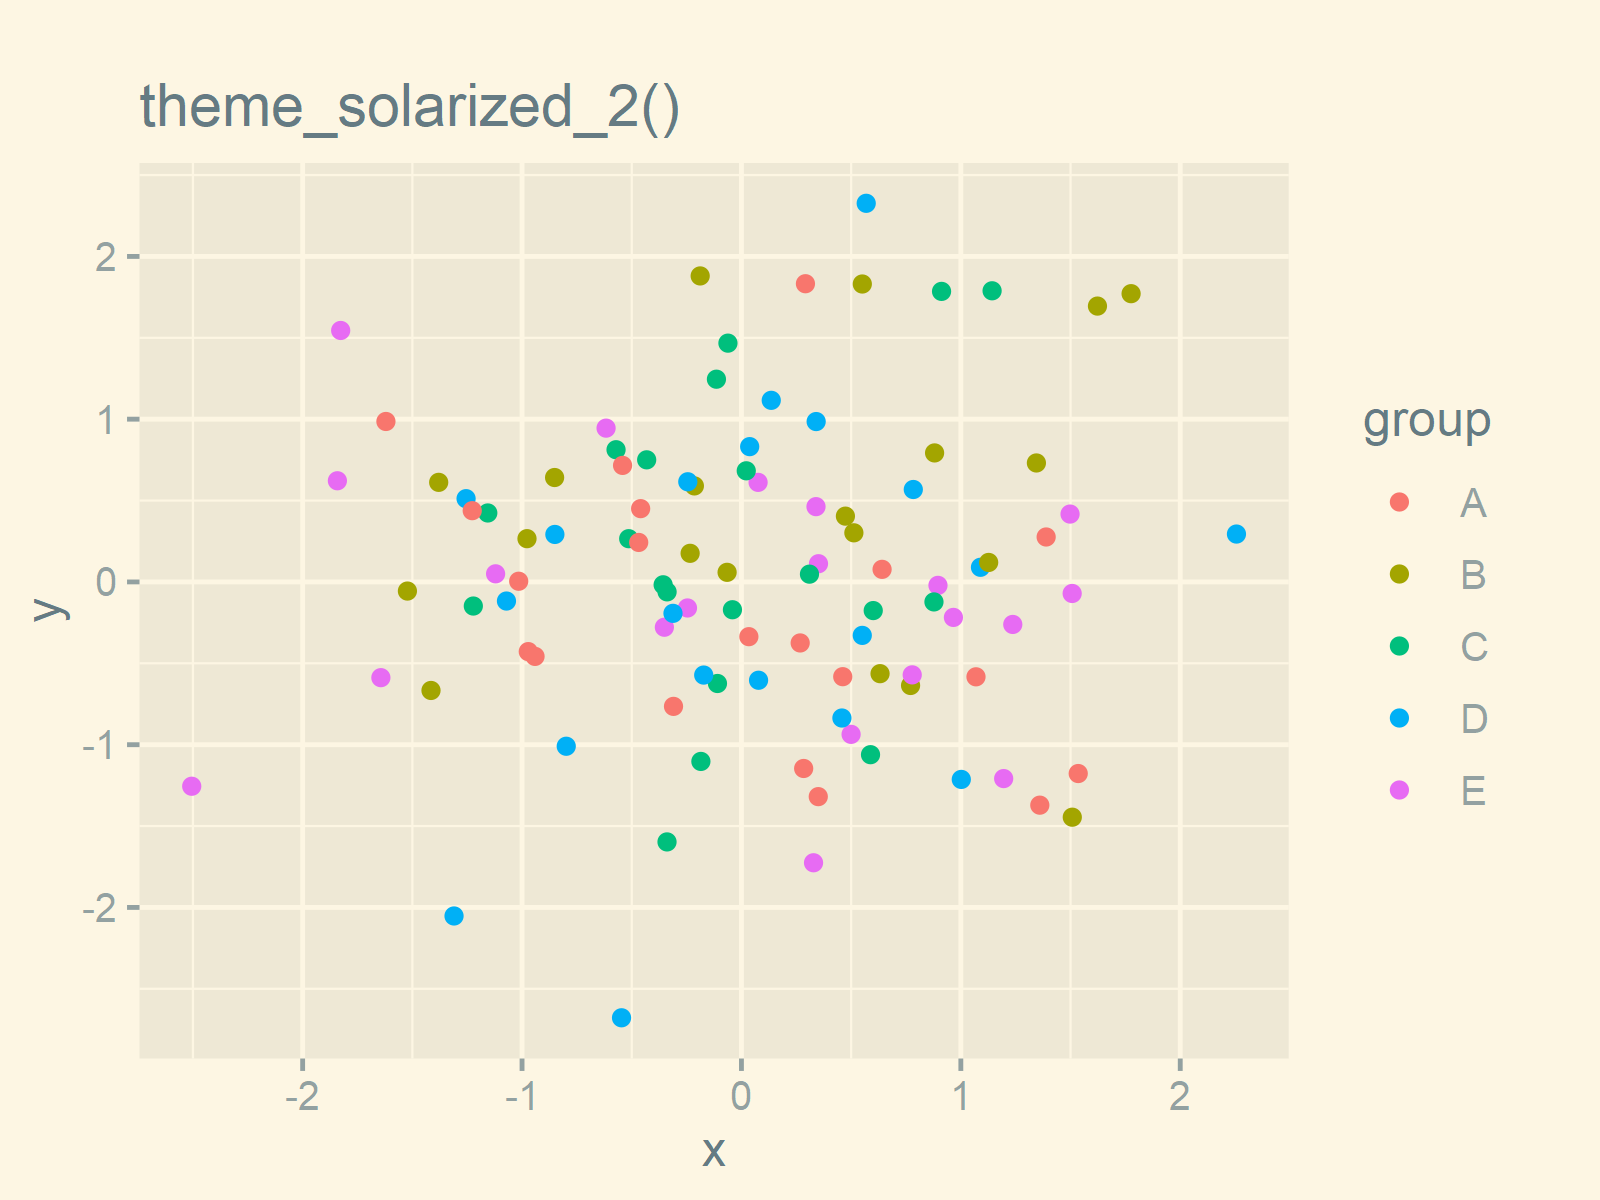
ggp_solarized_2 <- ggp + theme_solarized_2() + ggtitle("theme_solarized_2()")
ggp_solarized_2
ggp_solid <- ggp + theme_solid() + ggtitle("theme_solid()")
ggp_solid
ggp_stata <- ggp + theme_stata() + ggtitle("theme_stata()")
ggp_stata
ggp_tufte <- ggp + theme_tufte() + ggtitle("theme_tufte()")
ggp_tufte
ggp_wsj <- ggp + theme_wsj() + ggtitle("theme_wsj()")
ggp_wsj
As you have seen in this section, the ggthemes package can be used to create many different designs, layouts, and graphical styles. In case you want to learn more about the ggthemes package and its source code, you may also have a look at its GitHub page here.
Video & Further Resources
Do you need further information on the R programming syntax of this article? Then I recommend having a look at the following video on my YouTube channel. I’m explaining the R syntax of this tutorial in the video.
The YouTube video will be added soon.
Furthermore, you can find articles on how to plot different kinds of graphics such as xy-plots, density plots, bargraphs, boxplots, histograms, and line plots using the default ggplot2 themes:
- theme_classic
- theme_bw
- theme_dark
- theme_gray
- theme_light
- theme_linedraw
- theme_minimal
- theme_test
- theme_void
In addition, you might have a look at the other RStudio tutorials on this website:
- ggplot2 Themes in R
- ggthemr Package in R
- theme_economist [ggthemes Package]
- Graphics in R (Gallery with Examples)
- All R Programming Examples
In this R article you have learned how to change the theme of a ggplot2 plot using the ggthemes package. Tell me about it in the comments section below, if you have further questions or comments.


