theme_economist ggplot2 & ggthemes Theme in R (6 Examples)
This article illustrates how to set the ggplot2 theme to the theme_economist in the R programming language.
The article contains these content blocks:
You’re here for the answer, so let’s get straight to the examples…
Example Data & Software Packages
Consider the example data below.
set.seed(12233665)                         # Set random seed
data <- data.frame(x = rnorm(160),         # Create example data frame
                   y = rnorm(160),
                   group = LETTERS[1:4])
head(data)                                 # Print head of example data frame
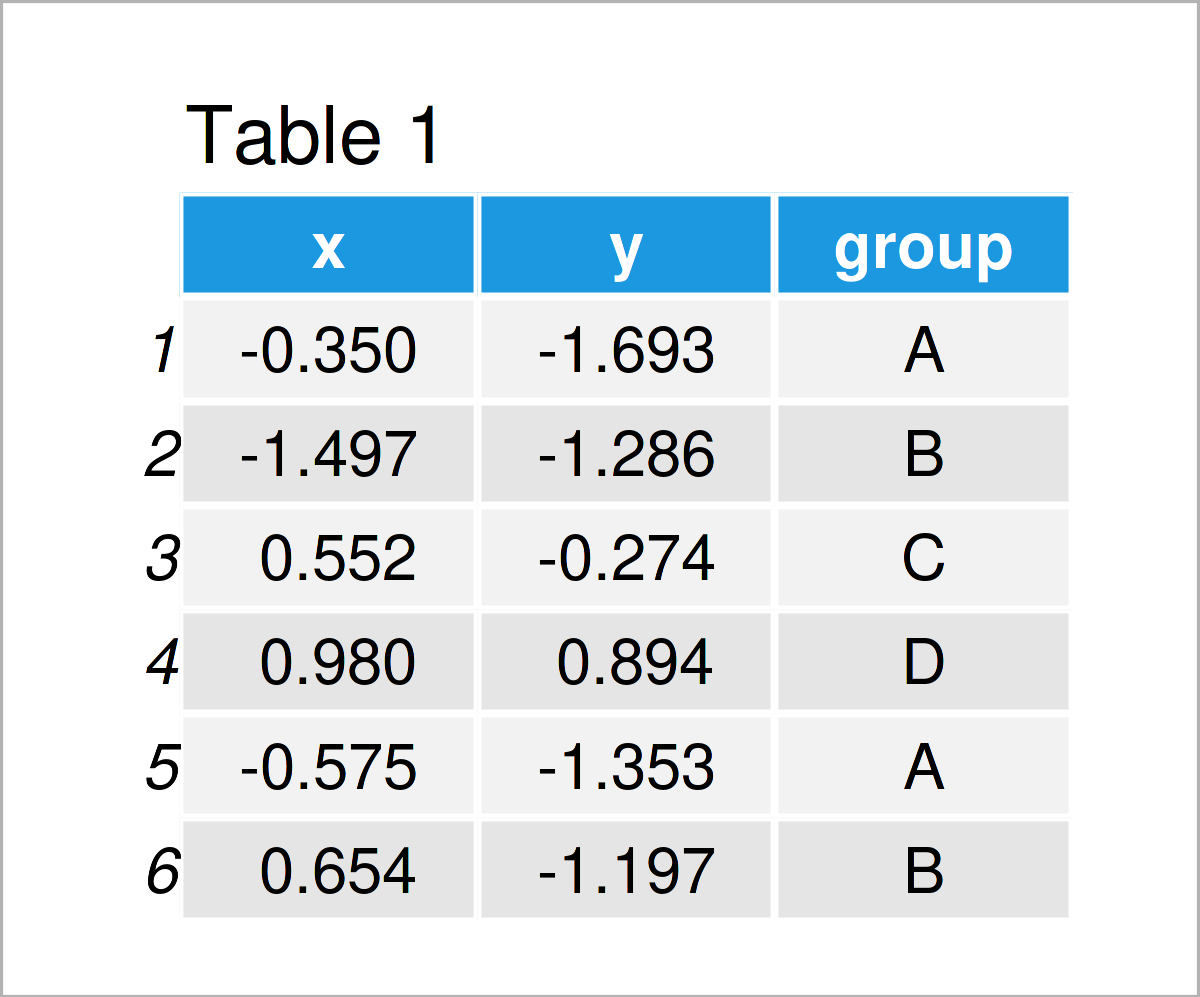
Table 1 shows that our exemplifying data comprises three columns. The variables x and y are numerical, and the variable group is a character.
We also have to install and load the ggplot2 package to R, to be able to use the corresponding functions:
install.packages("ggplot2")                # Install & load ggplot2
library("ggplot2")
Furthermore, we have to install and load the ggthemes package to RStudio. The ggthemes package provides additional themes that can be used with the ggplot2 package:
install.packages("ggthemes")               # Install ggthemes package
library("ggthemes")                        # Load ggthemes package
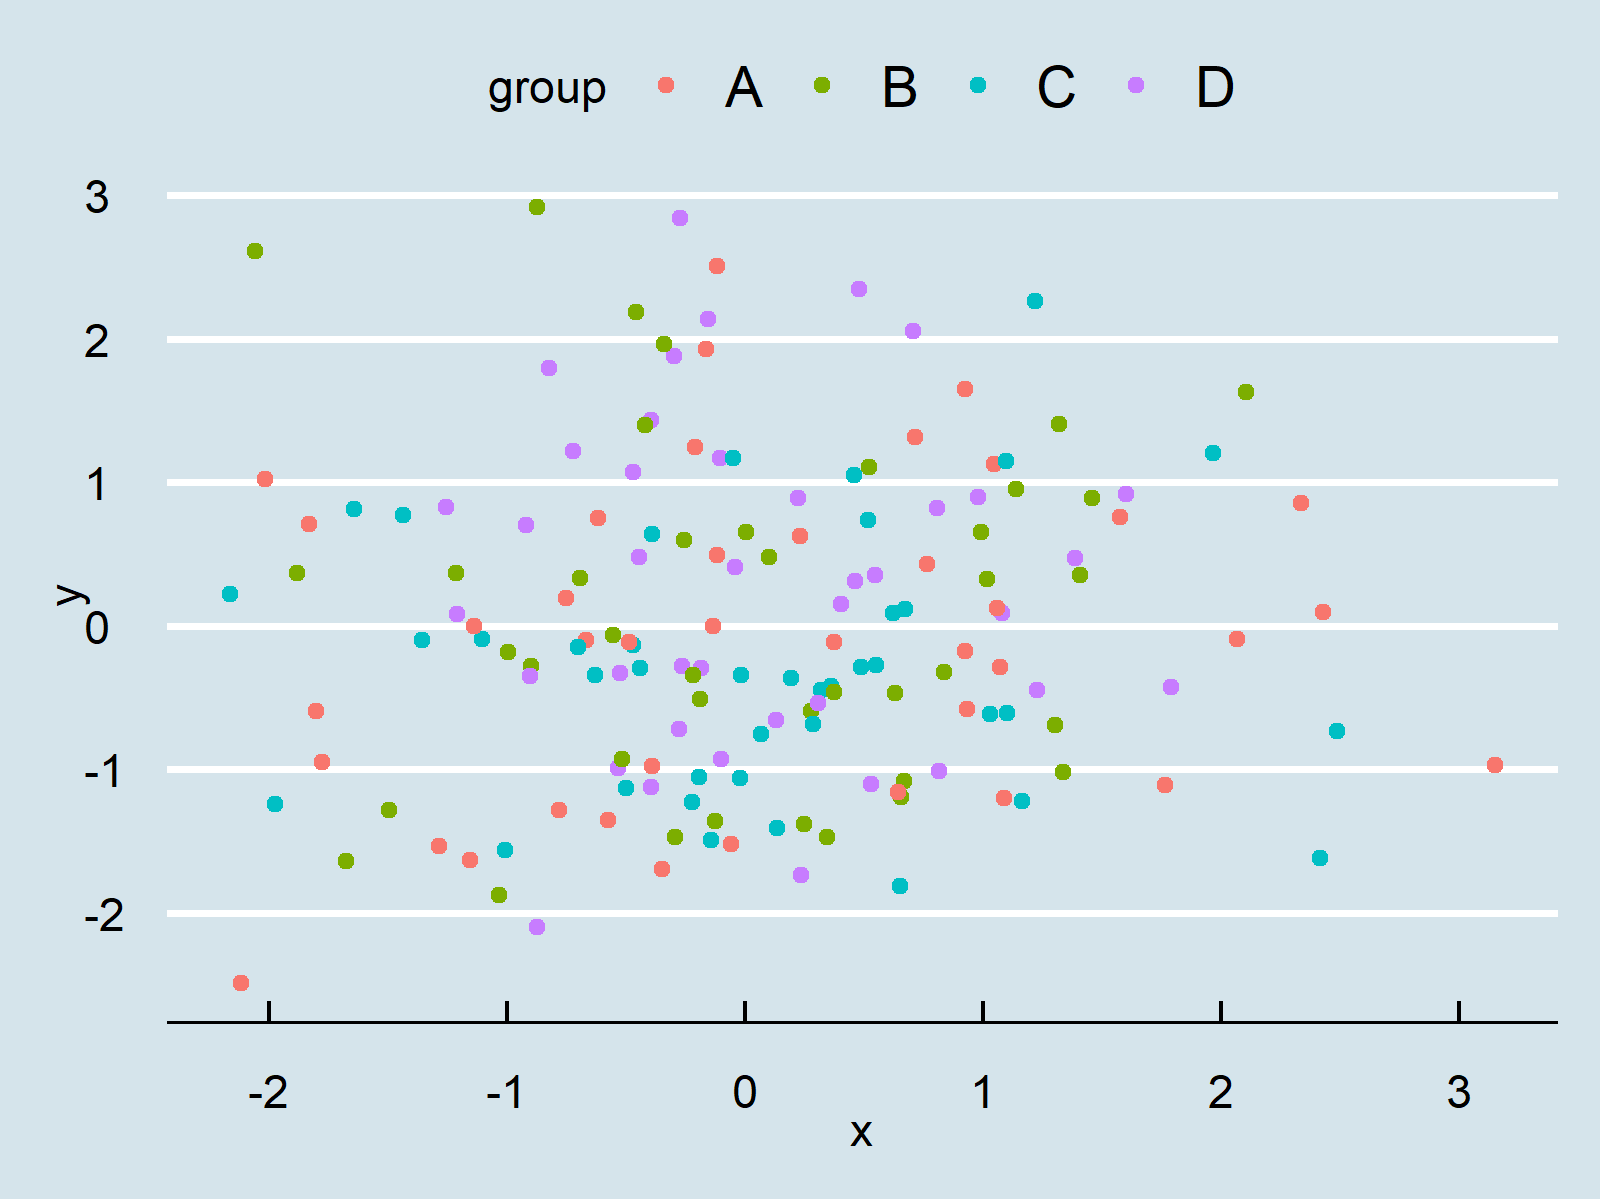
In this tutorial, we’ll draw different types of graphics using the theme_economist theme. This theme can be used to reproduce the style and color theme that is used by The Economist, i.e. the international weekly newspaper.
Let’s do this!
Example 1: Draw ggplot2 Scatterplot Using theme_economist()
ggplot(data,                               # theme_economist scatterplot
       aes(x = x,
           y = y,
           col = group)) +
  geom_point() +
  theme_economist()
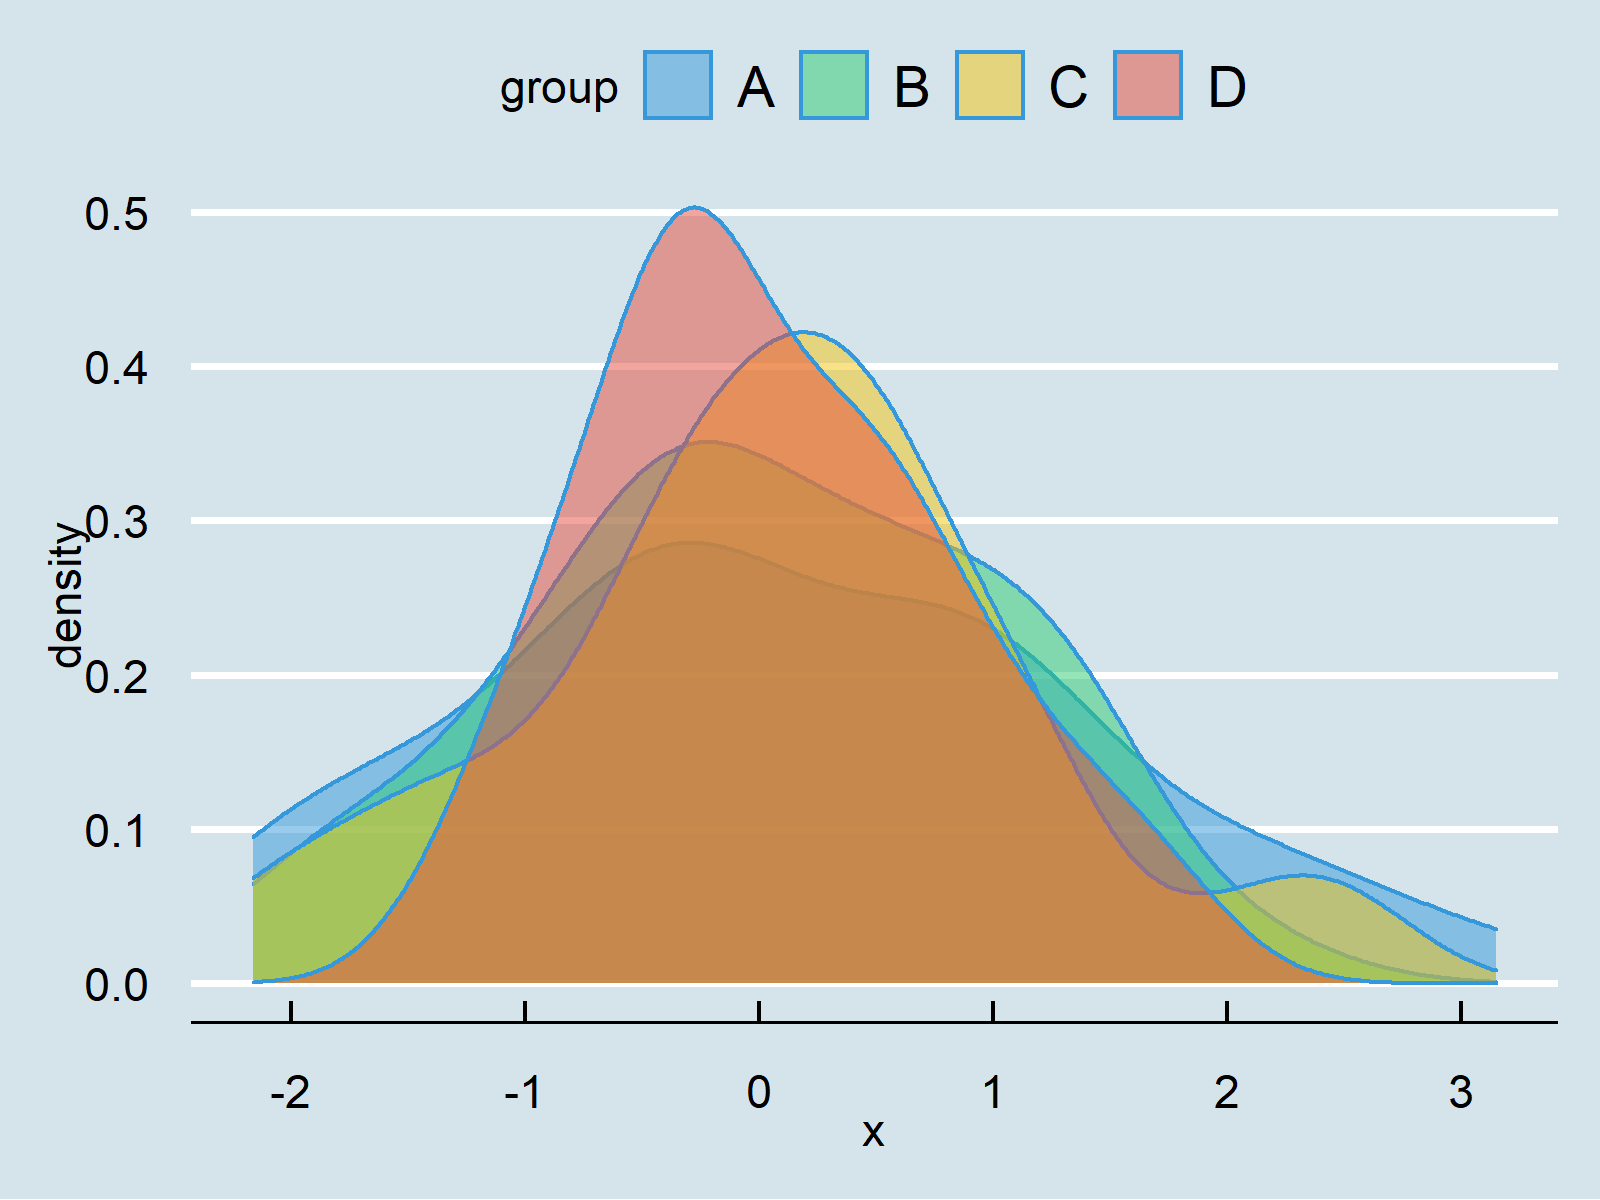
Example 2: Draw ggplot2 Density Plot Using theme_economist()
ggplot(data,                               # theme_economist density plot
       aes(x = x,
           fill = group)) +
  geom_density(alpha = 0.5) +
  theme_economist()
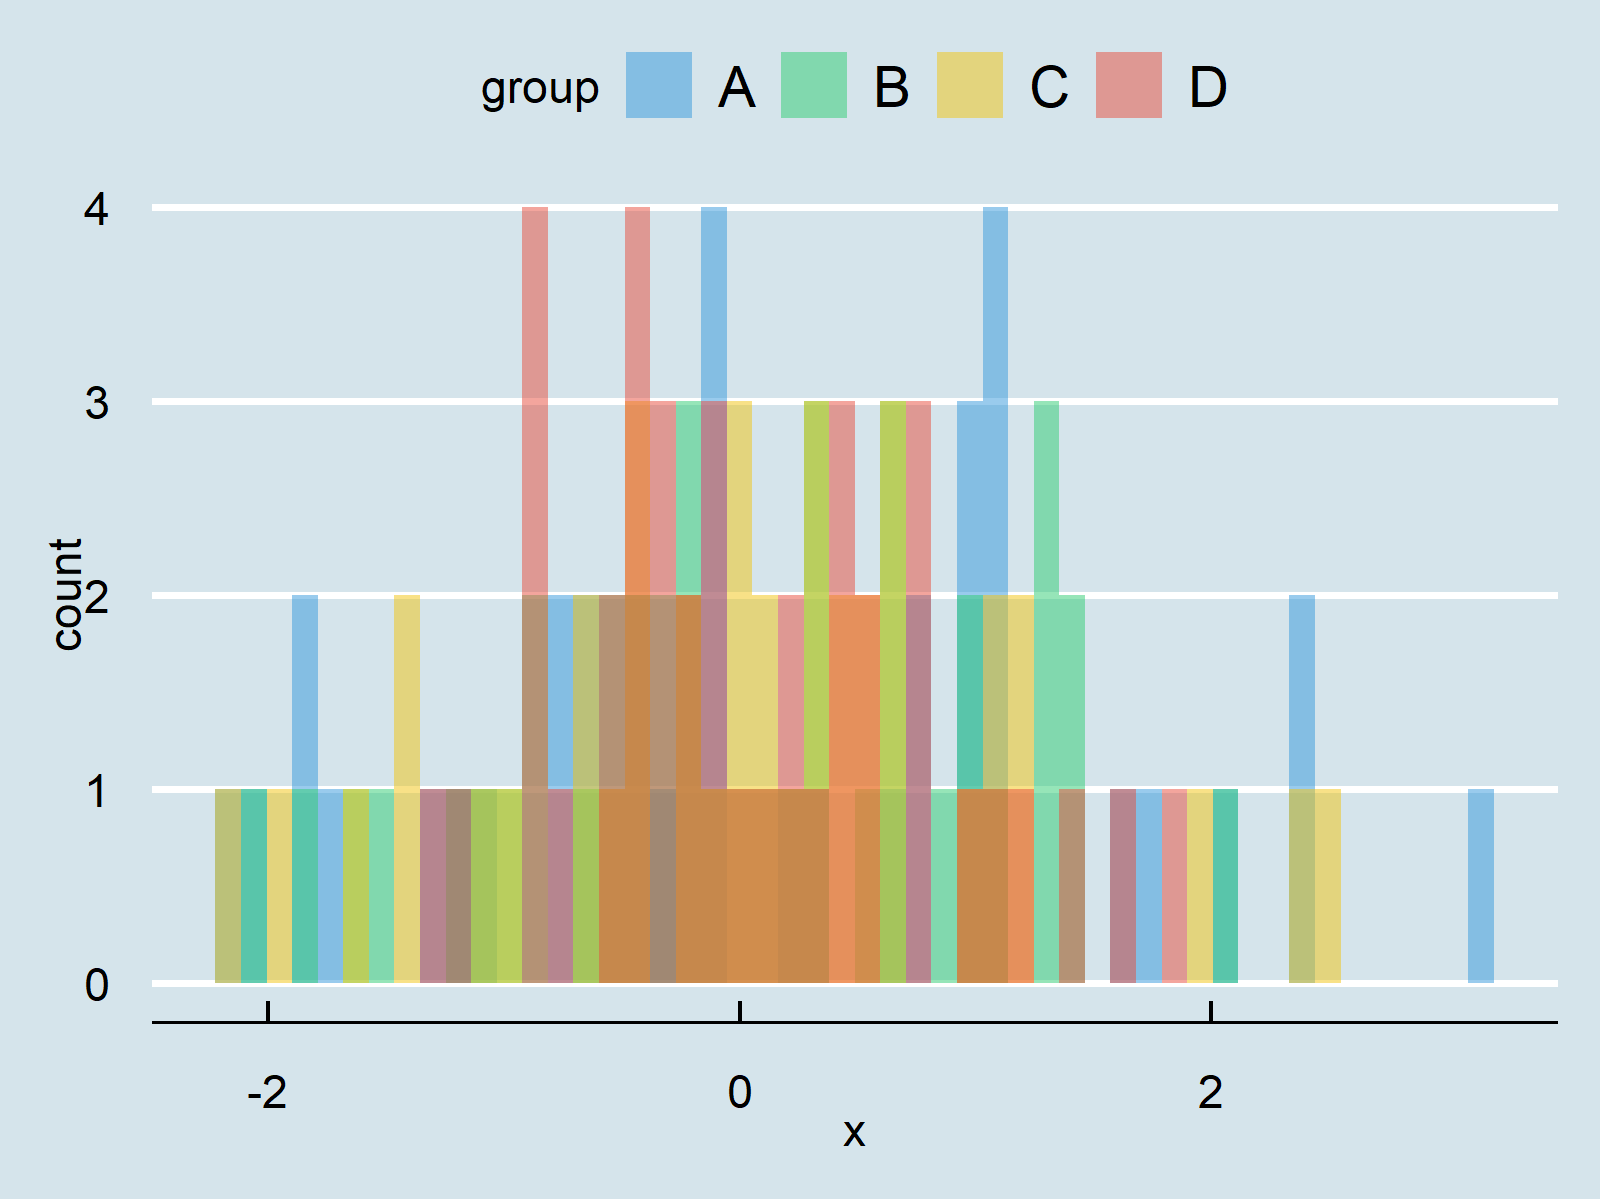
Example 3: Draw ggplot2 Histogram Using theme_economist()
ggplot(data,                               # theme_economist histogram
       aes(x = x,
           fill = group)) +
  geom_histogram(alpha = 0.5,
                 position = "identity",
                 bins = 50) +
  theme_economist()
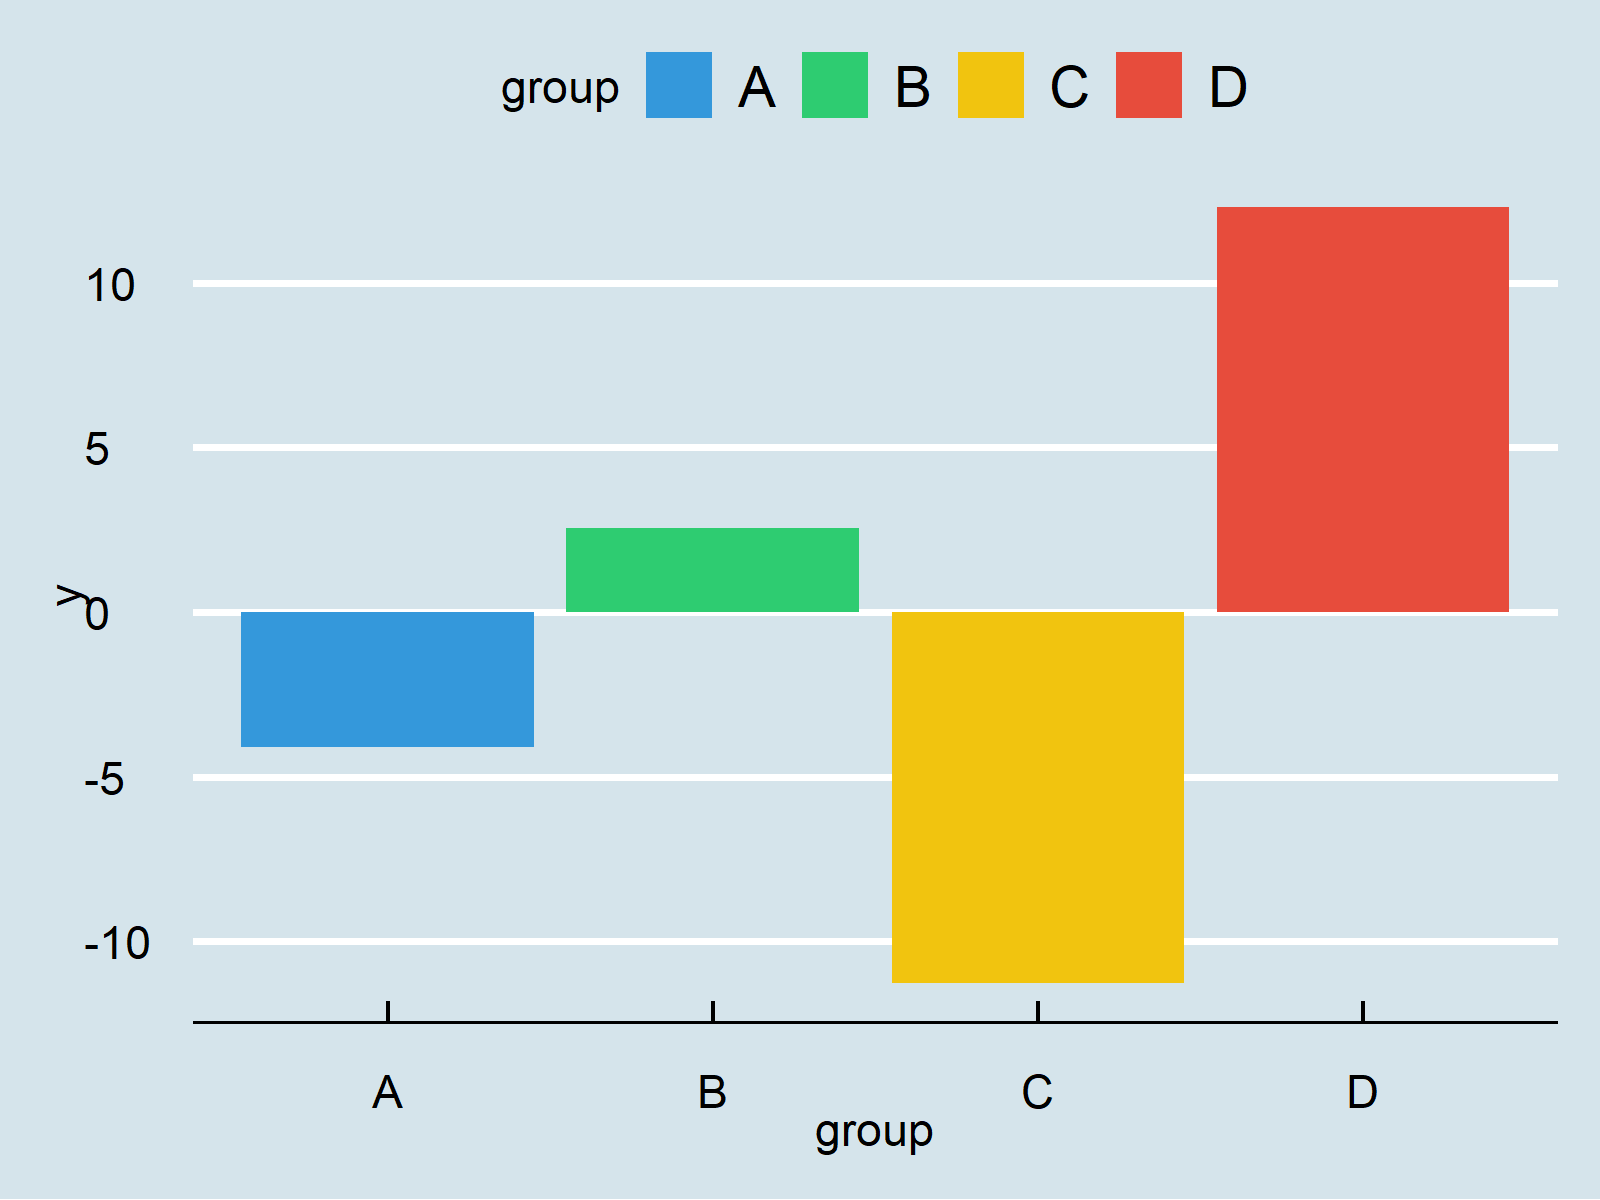
Example 4: Draw ggplot2 Barchart Using theme_economist()
ggplot(aggregate(y ~ group, data, sum),    # theme_economist barplot
       aes(x = group,
           y = y,
           fill = group)) +
  geom_bar(stat = "identity") +
  theme_economist()
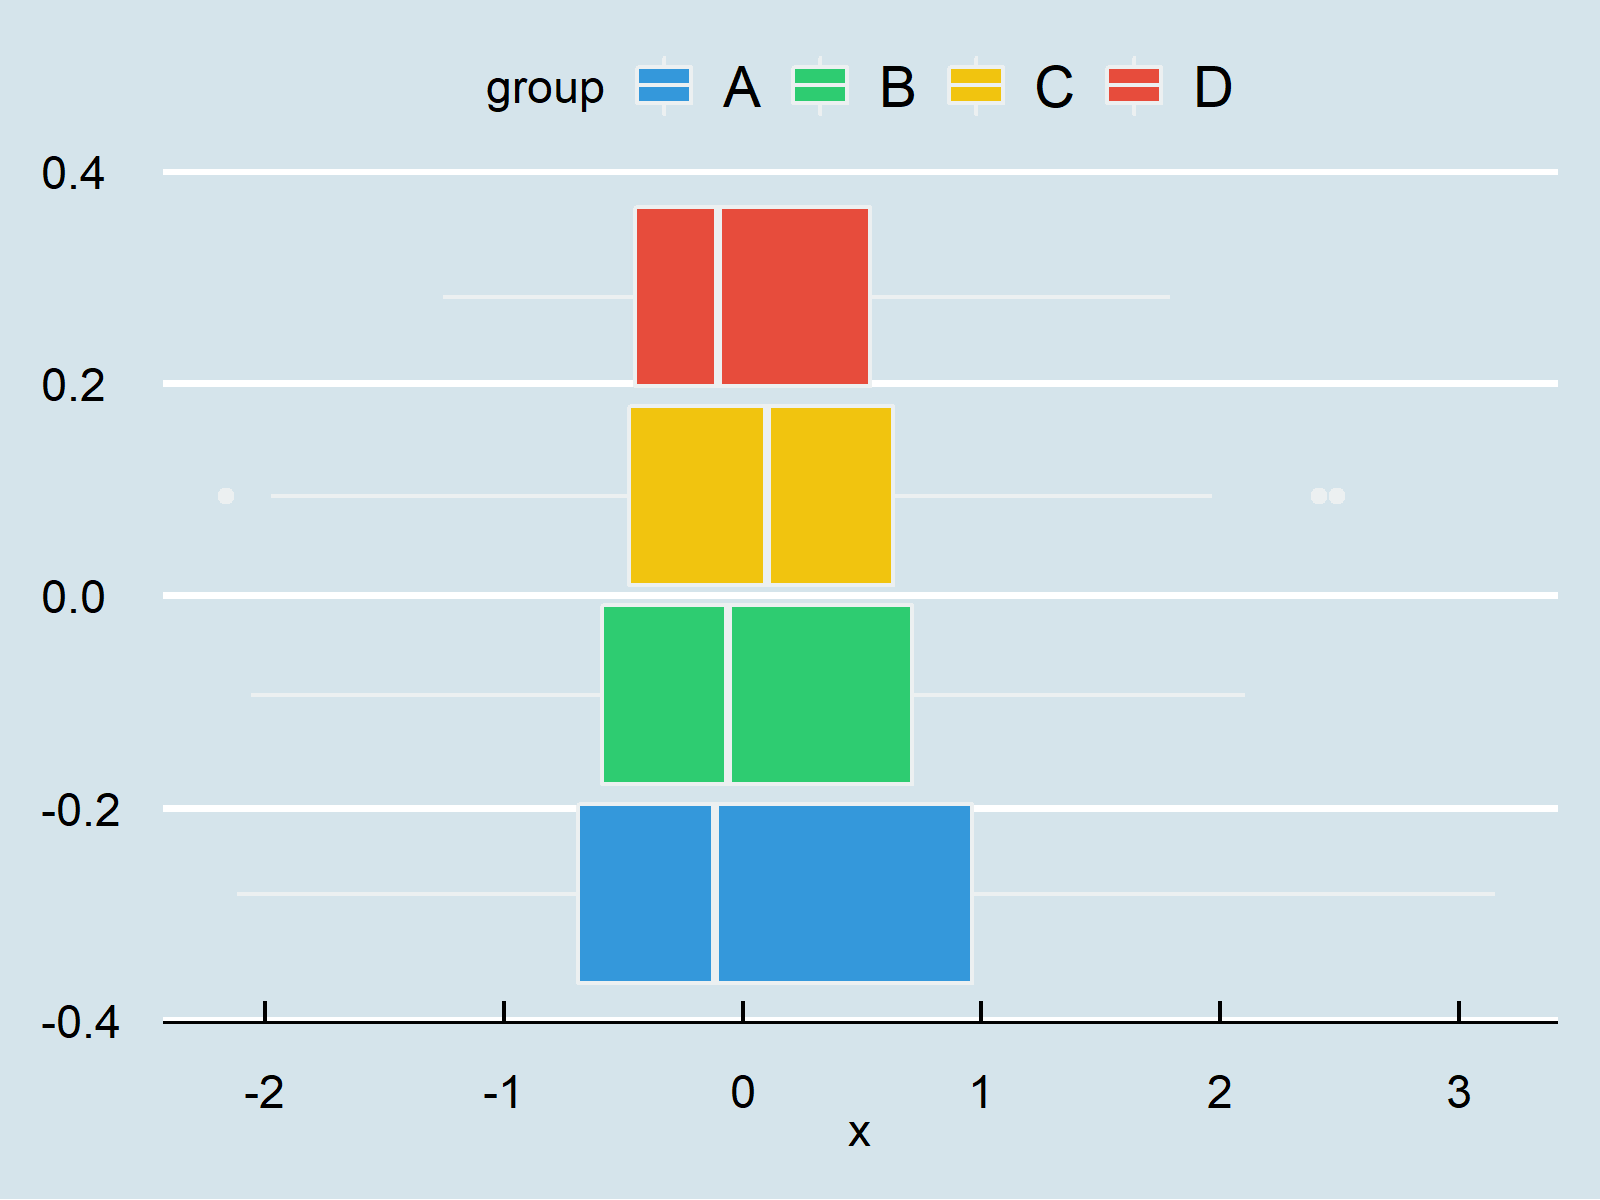
Example 5: Draw ggplot2 Boxplot Using theme_economist()
ggplot(data,                               # theme_economist boxplot
       aes(x = x,
           fill = group)) +
  geom_boxplot() +
  theme_economist()
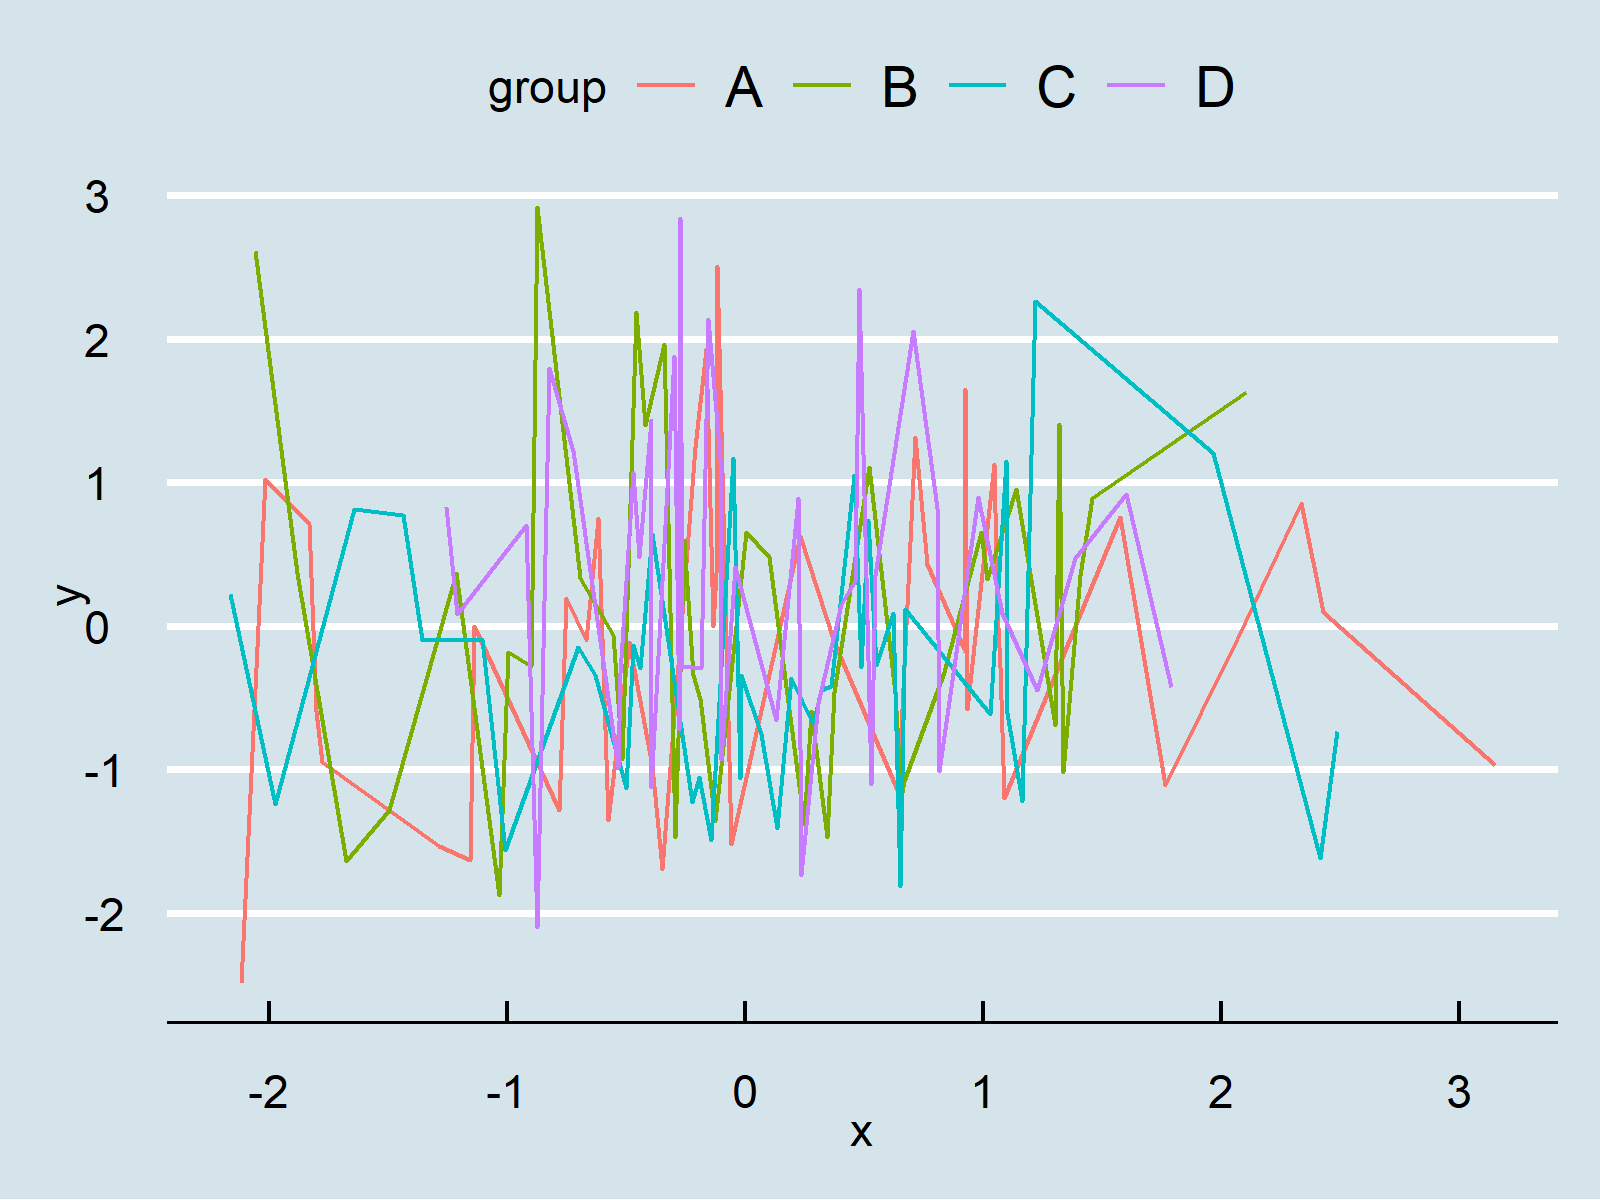
Example 6: Draw ggplot2 Line Plot Using theme_economist()
ggplot(data,                               # theme_economist line plot
       aes(x = x,
           y = y,
           col = group)) +
  geom_line() +
  theme_economist()
Video & Further Resources
In case you want to learn more about the ggplot2 package and data visualization in R, please have a look at the following video tutorial, where I give a detailed introduction with different examples:
On Statistics Globe, you can also find tutorials on how to create different kinds of graphics such as scatterplots, density plots, barcharts, boxplots, histograms, and line plots using the default themes of the ggplot2 package:
- theme_bw
- theme_classic
- theme_dark
- theme_gray
- theme_light
- theme_linedraw
- theme_minimal
- theme_test
- theme_void
In addition, you may want to have a look at some of the other tutorials on my website.
Summary: In this tutorial, I have demonstrated how to apply the theme_economist function to modify the design and layout of a ggplot2 plot in R programming. Don’t hesitate to let me know in the comments section, if you have additional questions and/or comments. Furthermore, please subscribe to my email newsletter in order to get updates on the newest articles.


