Scatterplot in R (10 Examples) | Create XYplot in Base R, ggplot2 & lattice
In this R programming tutorial you’ll learn how to draw scatterplots.
Table of contents:
- Exemplifying Data
- Example 1: Basic Scatterplot in R
- Example 2: Scatterplot with User-Defined Title & Labels
- Example 3: Add Fitting Line to Scatterplot (abline Function)
- Example 4: Add Smooth Fitting Line to Scatterplot (lowess Function)
- Example 5: Modify Color & Point Symbols in Scatterplot
- Example 6: Create Scatterplot with Multiple Groups
- Example 7: Add Legend to Scatterplot
- Example 8: Matrix of Scatterplots
- Example 9: Scatterplot in ggplot2 Package
- Example 10: Scatterplot in lattice Package
- Video & Further Resources
Let’s dive right in:
Exemplifying Data
We’ll use the following two numeric vectors for the following examples of this R (or RStudio) tutorial:
set.seed(42424)                                   # Create random data
x <- rnorm(500)
y <- x + rnorm(500)
Our vectors contain 500 values each and are correlated. Now let’s plot these data!
Example 1: Basic Scatterplot in R
If we want to create a scatterplot (also called XYplot) in Base R, we need to apply the plot() function as shown below:
plot(x, y) # Basic scatterplot
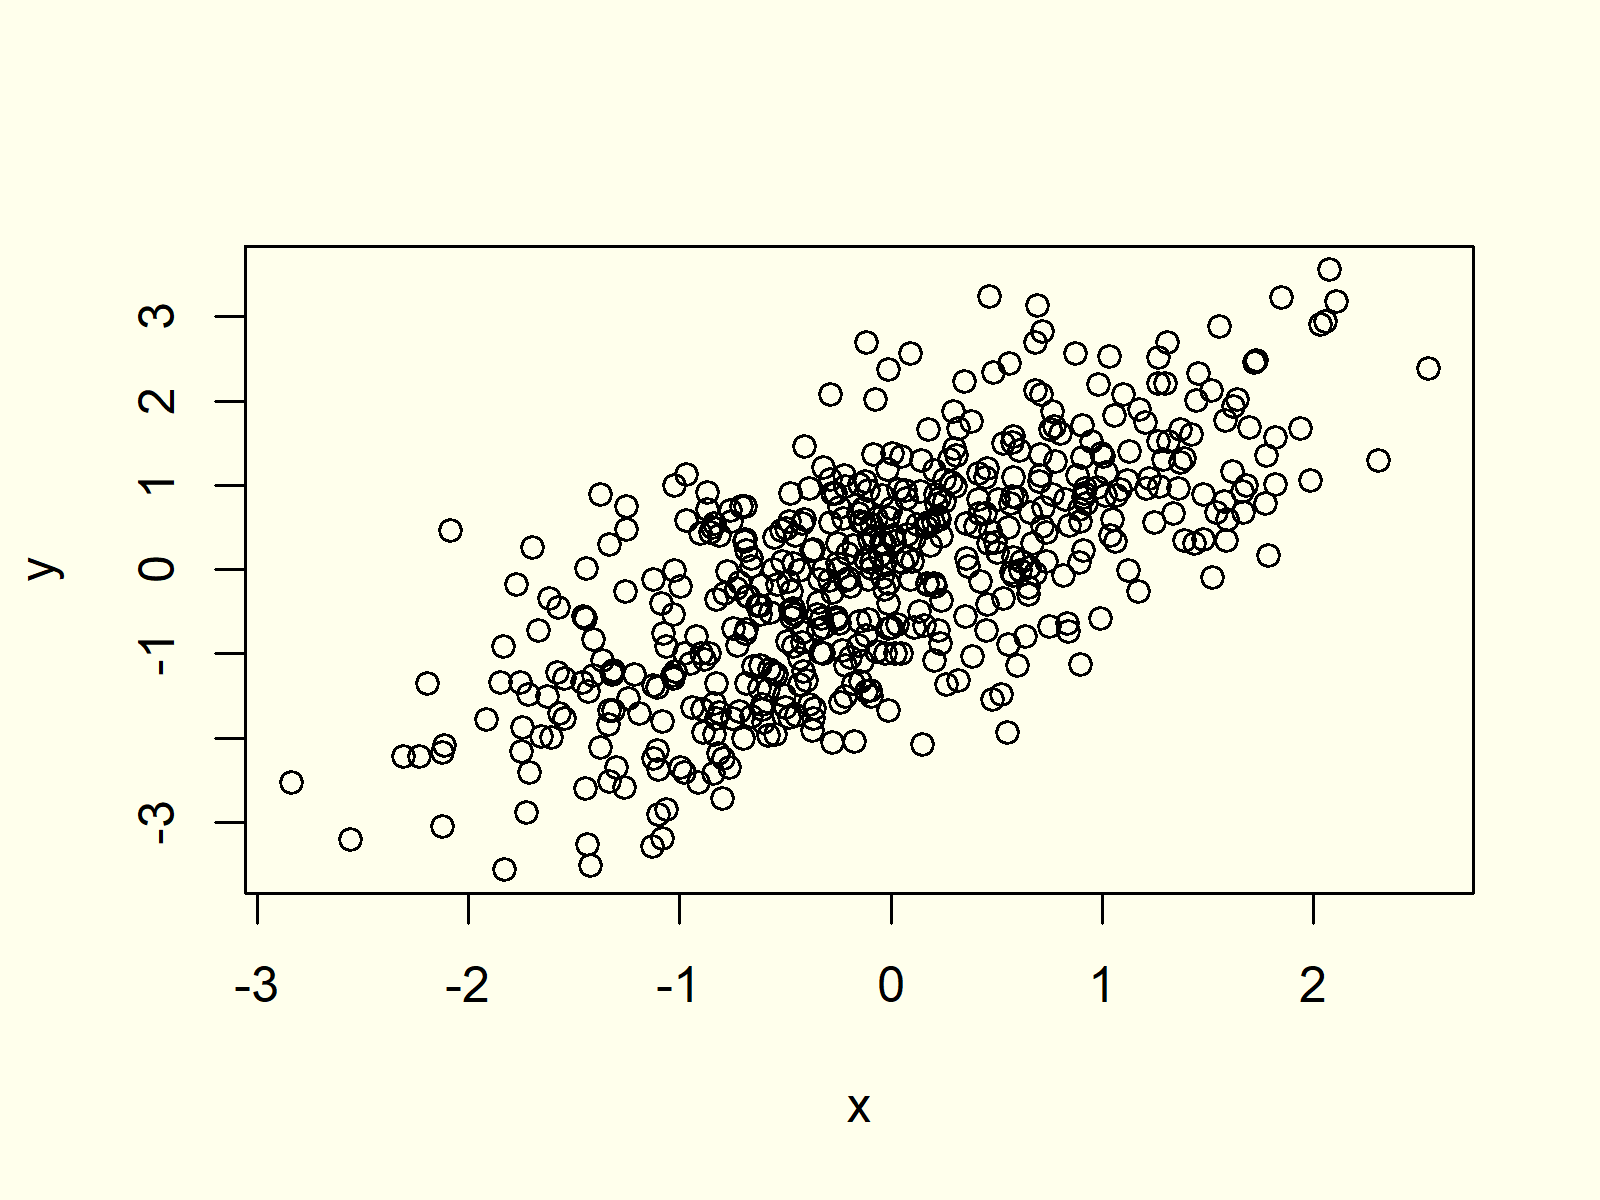
Figure 1: Scatterplot with Default Specifications in Base R.
Figure 1 shows an XYplot of our two input vectors. As you can see, our vectors are correlated.
However, the scatterplot is relatively plain and simple. In the next examples you’ll learn how to adjust the parameters of our scatterplot in R.
Example 2: Scatterplot with User-Defined Title & Labels
In Example 2, we’ll create a main title and change the axis labels of both axes:
plot(x, y,                                        # Scatterplot with manual text
     main = "This is my Scatterplot",
     xlab = "My X-Values",
     ylab = "My Y-Values")
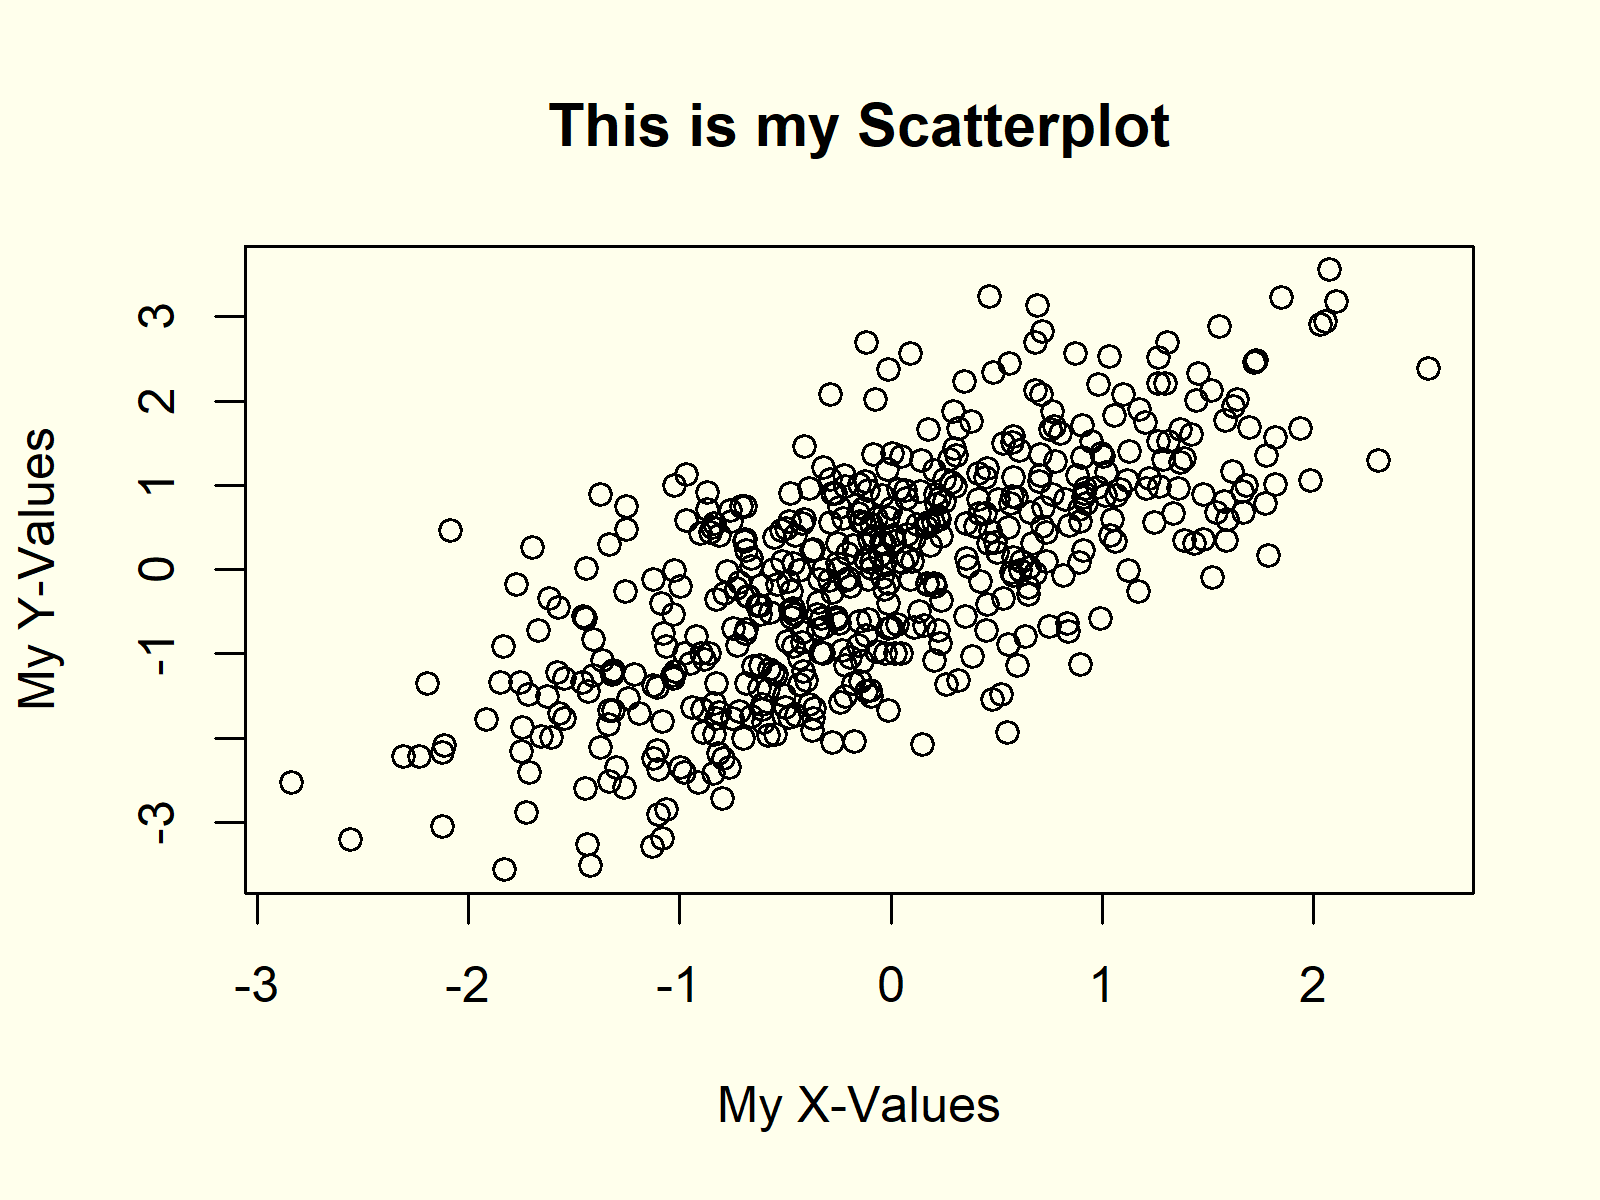
Figure 2: Scatterplot with User-Defined Main Title & Axis Labels.
If you compare Figure 1 and Figure 2, you will see that the title and axes where changed.
Example 3: Add Fitting Line to Scatterplot (abline Function)
Quite often it is useful to add a fitting line (or regression slope) to a XYplot to show the correlation of the two input variables.
In the R programming language, we can do that with the abline function:
plot(x, y)                                        # Scatterplot with fitting line
abline(lm(y ~ x), col = "red")
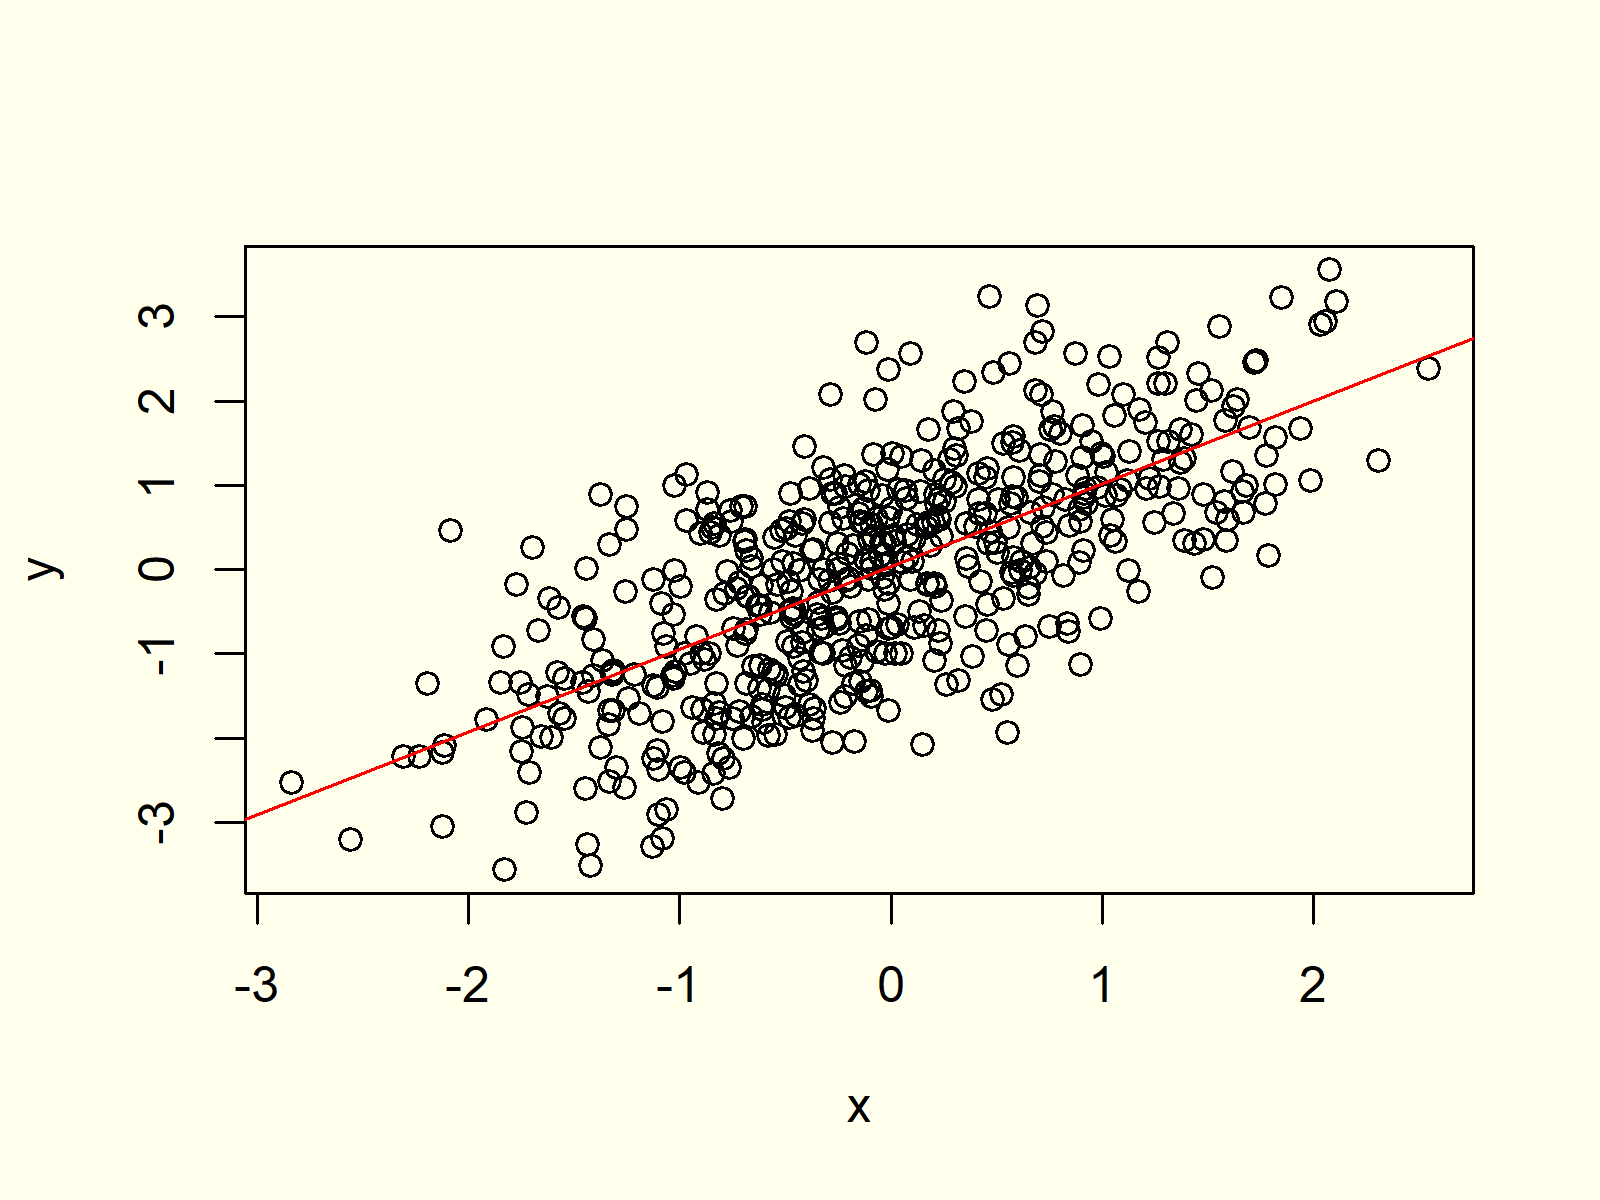
Figure 3: Scatterplot with Straight Fitting Line.
In Figure 3 you can see a red regression line, which overlays our original scatterplot.
Example 4: Add Smooth Fitting Line to Scatterplot (lowess Function)
In Example 3, we added a straight fitting line. However, it is also possible to draw a smooth fitting line with the lowess function.
plot(x, y)                                        # Scatterplot with smooth fitting line
lines(lowess(x, y), col = "green")
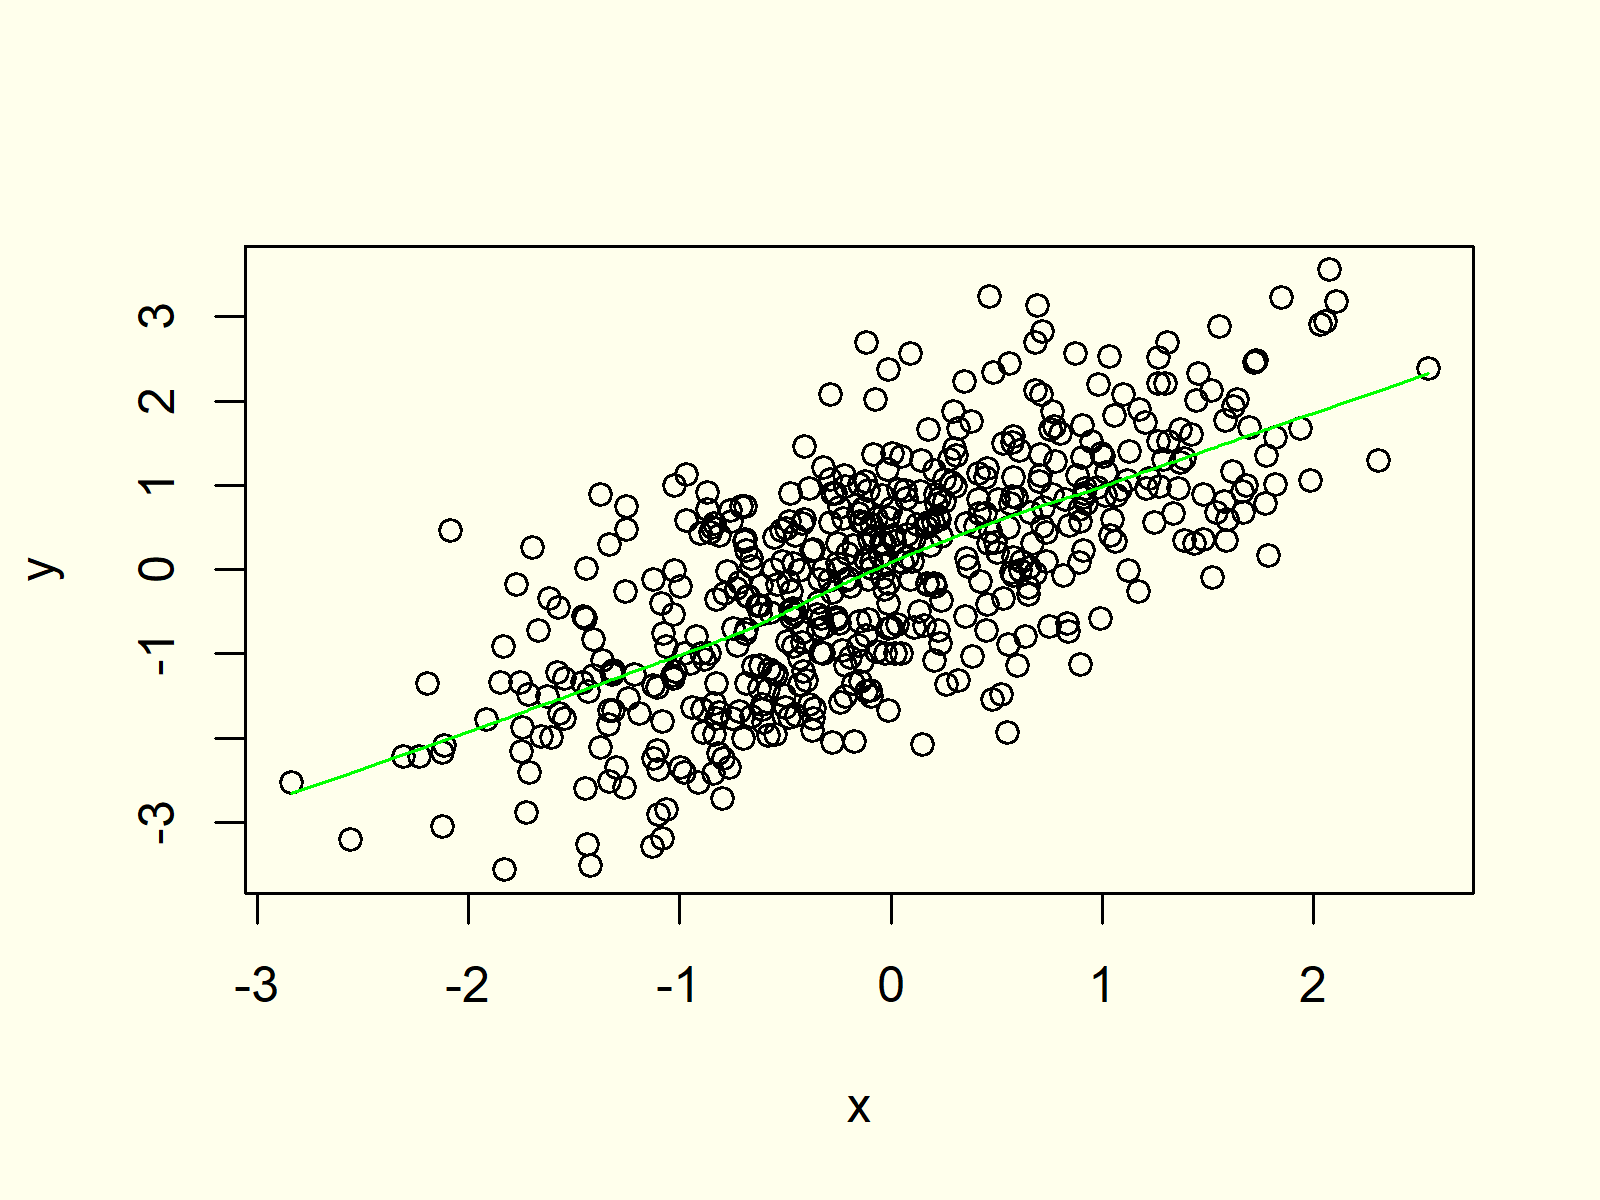
Figure 4: Scatterplot with Smooth Fitting Line.
Have a close look at the green line in Figure 4. It is not perfectly straight due to the random variation in our data.
Example 5: Modify Color & Point Symbols in Scatterplot
The plot function provides several options to change the design of our XYplot. For instance, we can use the pch argument to adjust the point symbols or the col argument to change the color of the points:
plot(x, y,                                        # Scatterplot with color & symbols
     pch = 16,
     col = "#1b98e0")
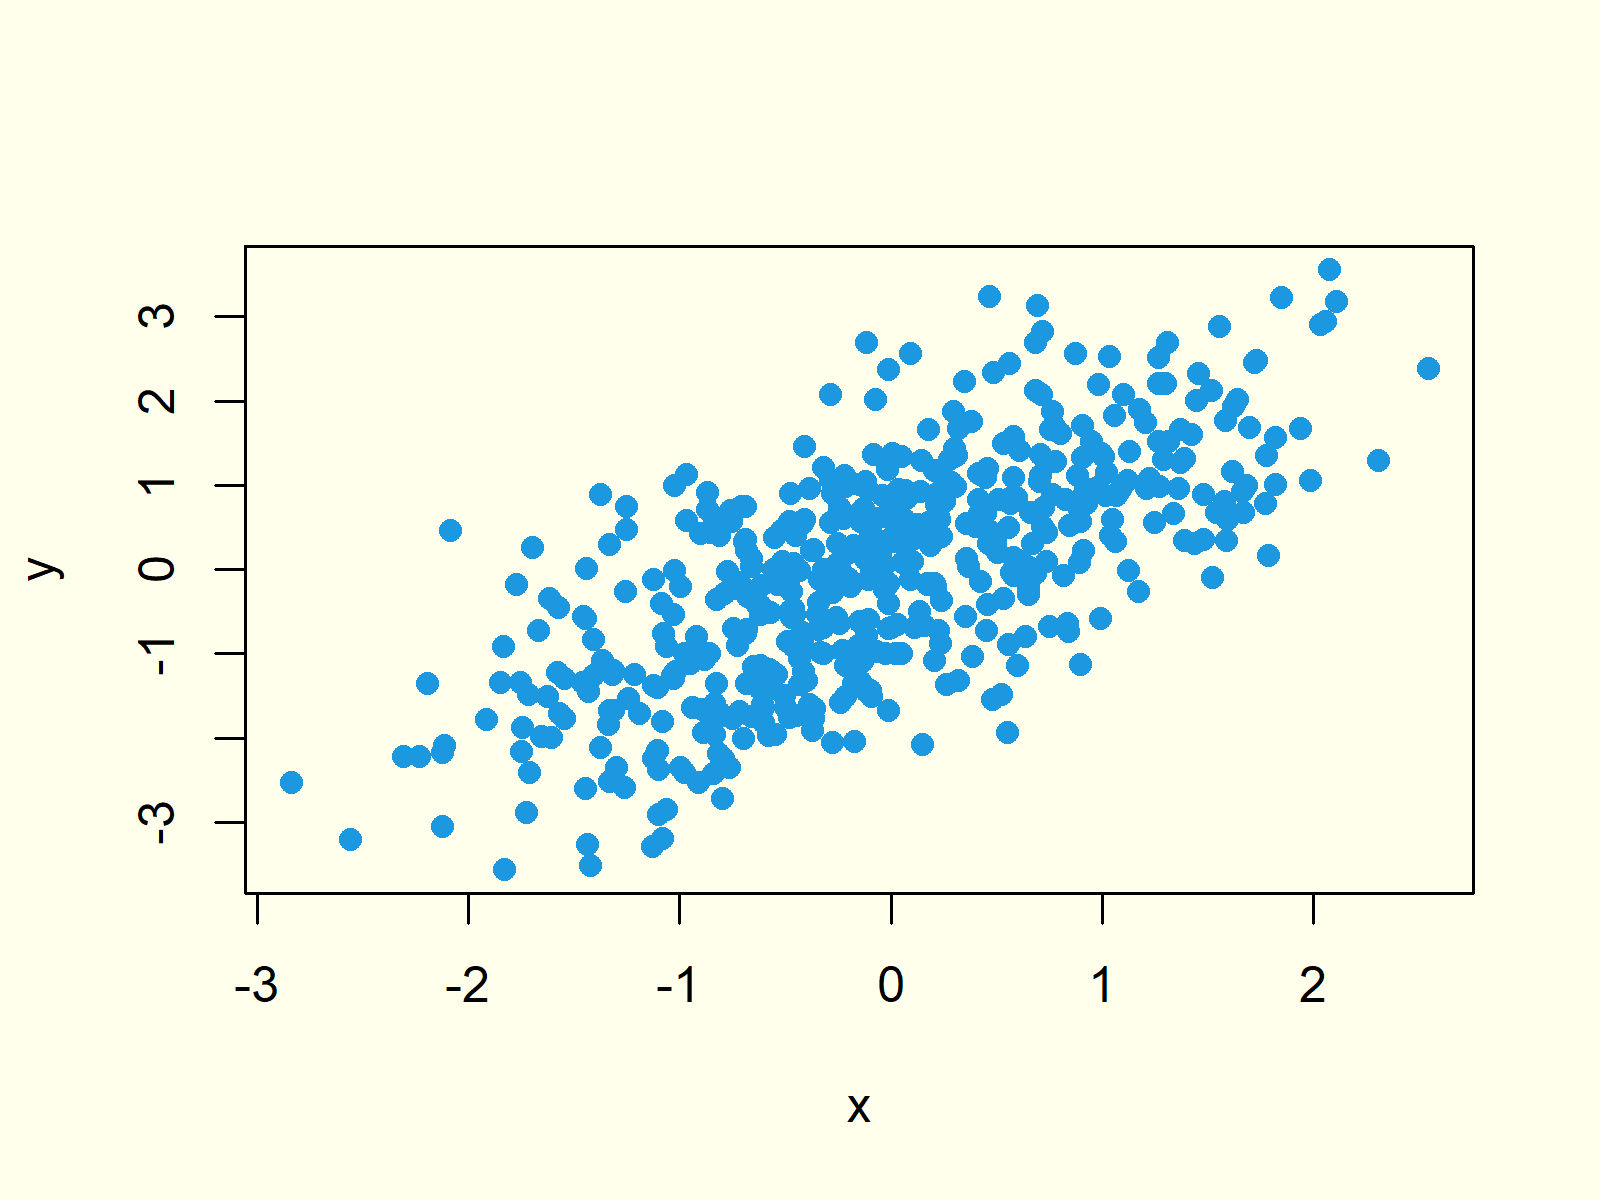
Figure 5: Scatterplot with Different Color & Point Symbols.
Example 6: Create Scatterplot with Multiple Groups
We can also use the design features of the plot function to represent different groups in a single scatterplot. Consider the following grouping variable:
group <- rbinom(500, 1, 0.3) + 1 # Create grouping variable
Now, we can use our grouping variable to specify a point symbol for each point…
group_pch <- group                                # Create variable for symbols
group_pch[group_pch == 1] <- 16
group_pch[group_pch == 2] <- 8
…and to create an indicator for the color of each point:
group_col <- group                                # Create variable for colors
group_col[group_col == 1] <- "red"
group_col[group_col == 2] <- "green"
If we now use our symbol- and color-indicators within the plot function, we can draw multiple scatterplots in the same graphic:
plot(x, y,                                        # Scatterplot with two groups
     pch = group_pch,
     col = group_col)
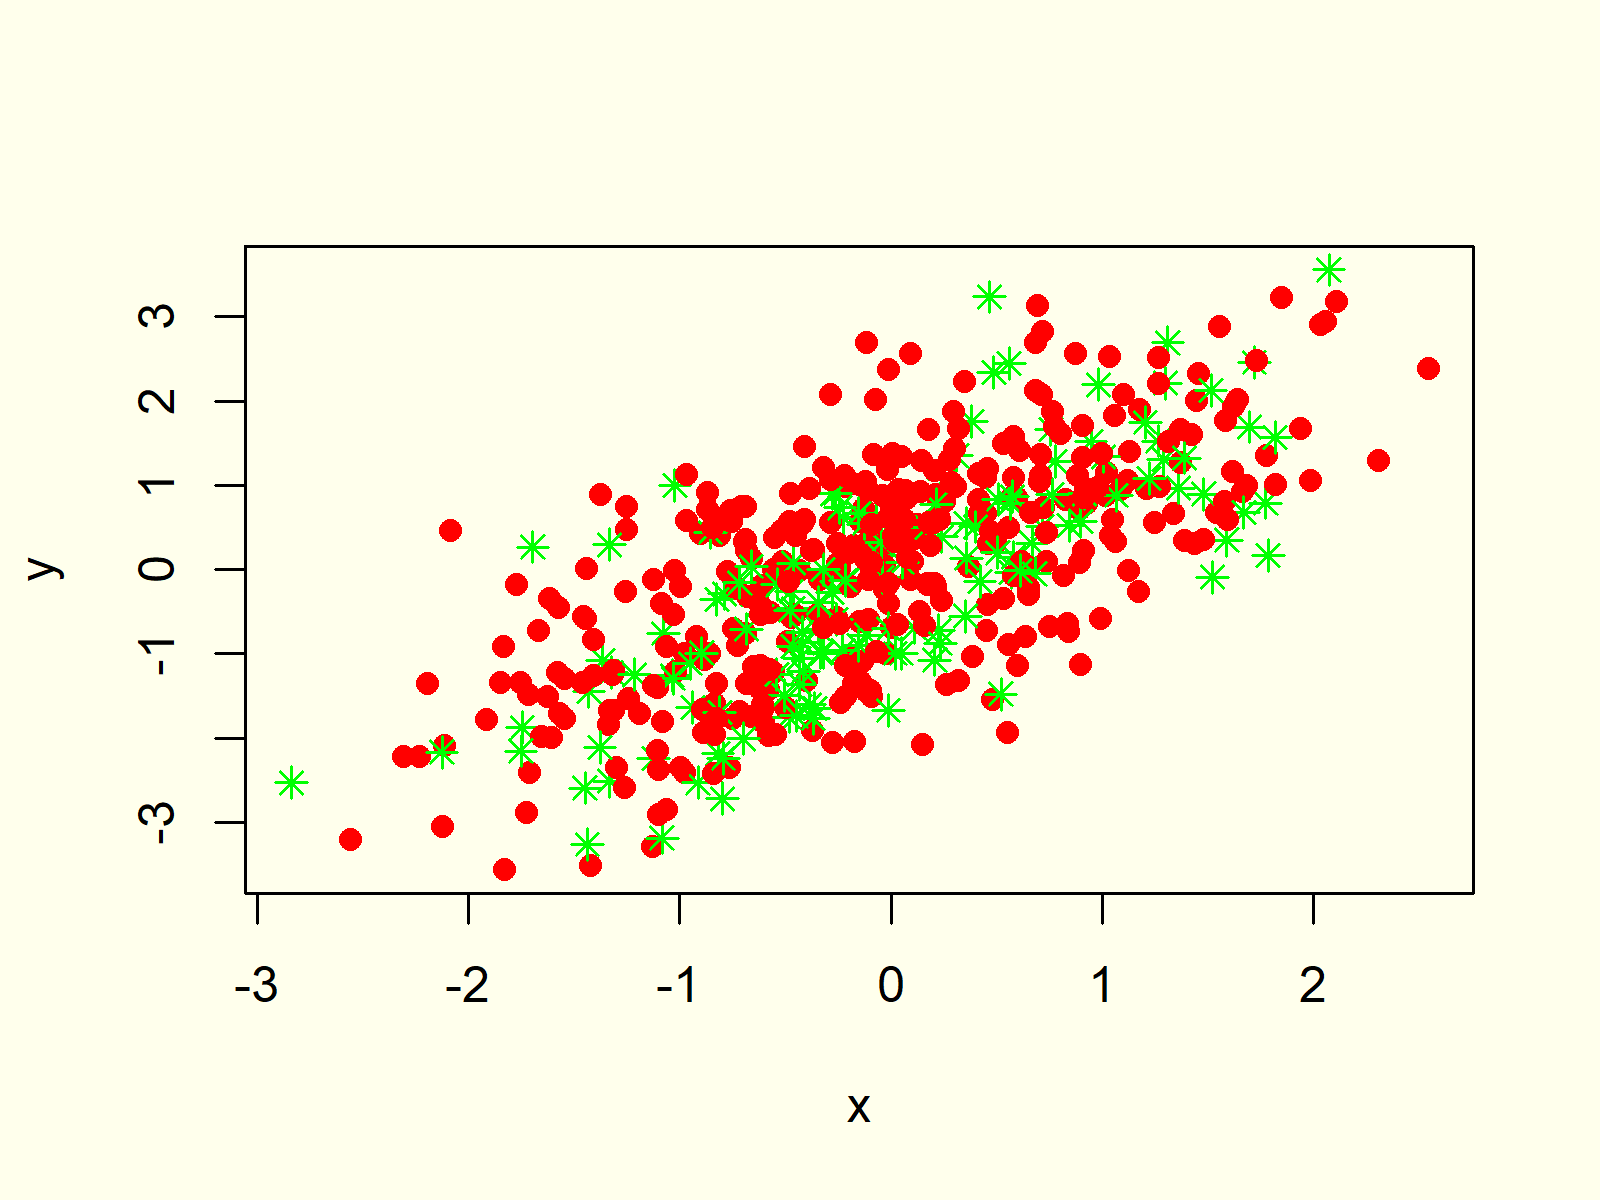
Figure 6: Multiple Scatterplots in Same Graphic.
Looks good, but at this point the reader of our graph cannot know which color represents which group… Let’s add a legend!
Example 7: Add Legend to Scatterplot
We can add a legend to our graph, which we have created in Example 6, with the legend function:
legend("topleft",                                 # Add legend to scatterplot
       legend = c("Group 1", "Group 2"),
       col = c("red", "green"),
       pch = c(16, 8))
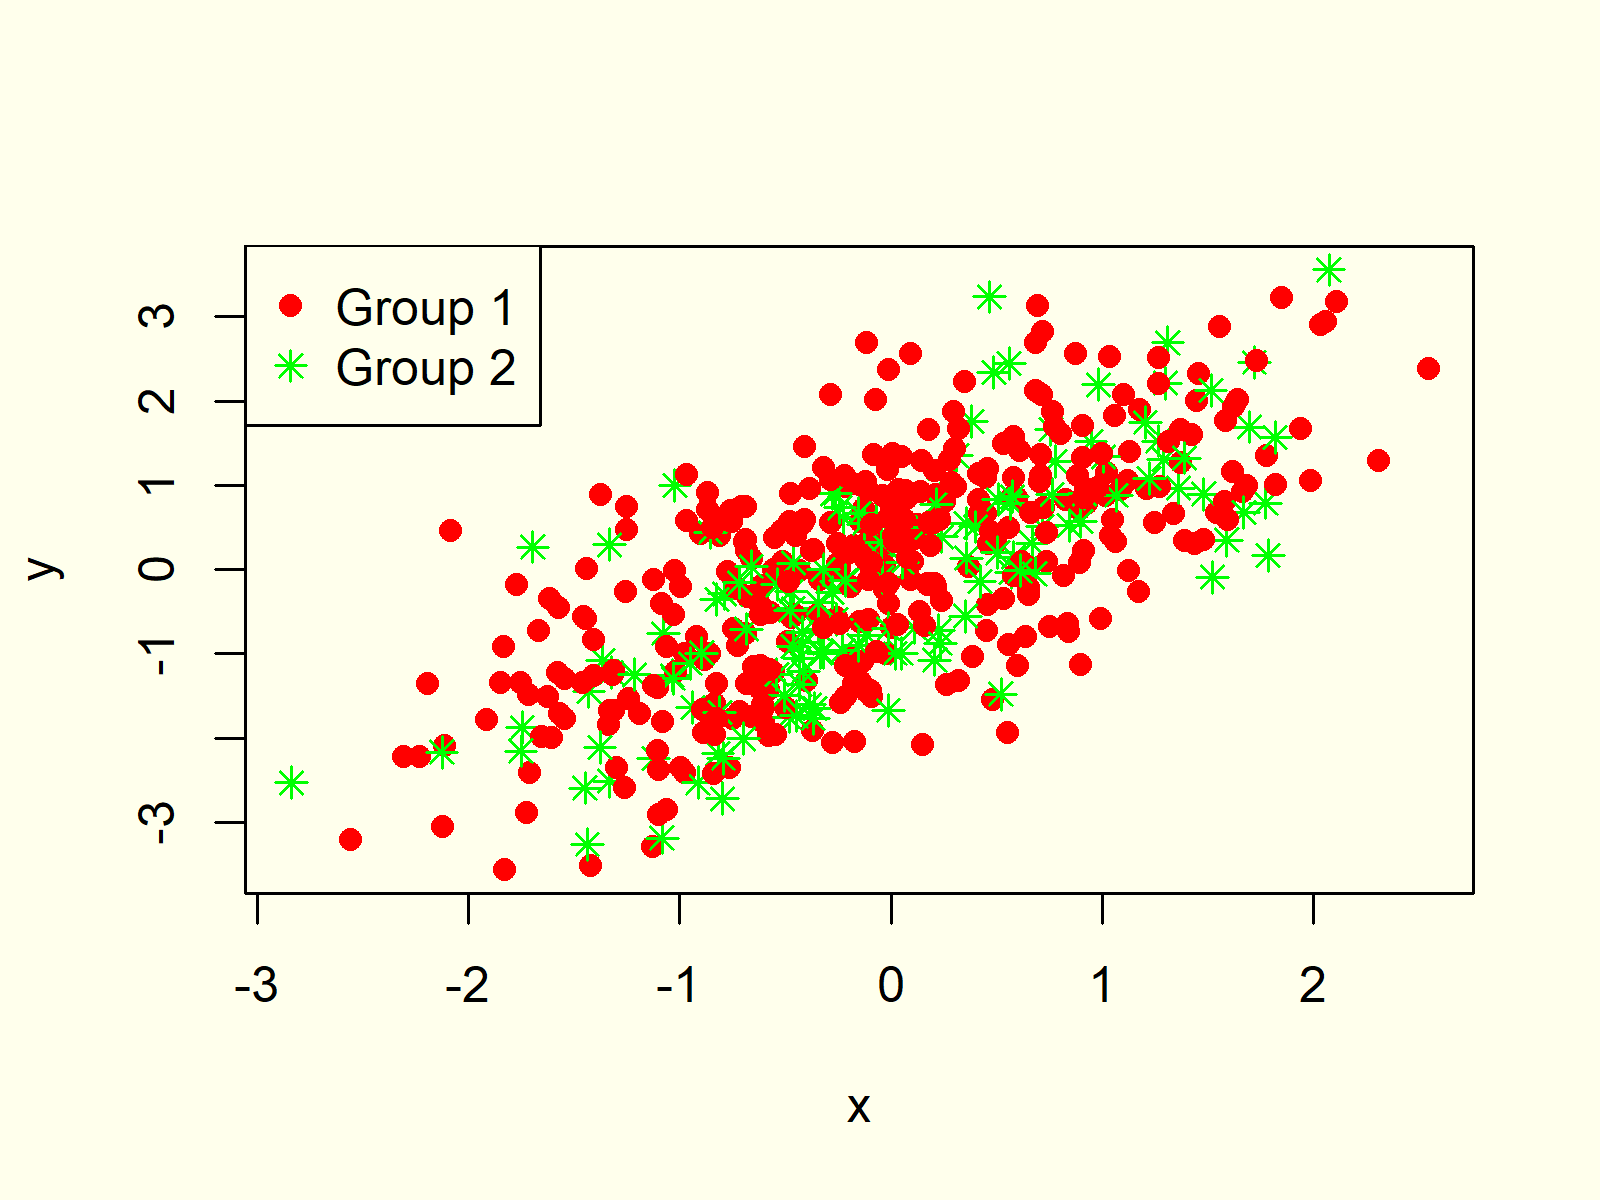
Figure 7: Scatterplot with Legend.
Figure 7 is exactly the same as Figure 6, but this time it’s visualizing the two groups in a legend.
Example 8: Matrix of Scatterplots
If we want to visualize several XYplots at once, we can also create a matrix of scatterplots. In Base R, we can do this based on the pairs function.
However, first we need to extend our example data. With the following R syntax, we can create a uniformly distributed random vector and store this vector together with our two example vectors x and y in the same data frame:
z <- runif(500)                                   # Create third random variable
data <- data.frame(x, y, z)                       # Add all vectors to data frame
Now, we can apply the pairs function in order to draw a scatterplot matrix:
pairs(data) # Create matrix of scatterplots
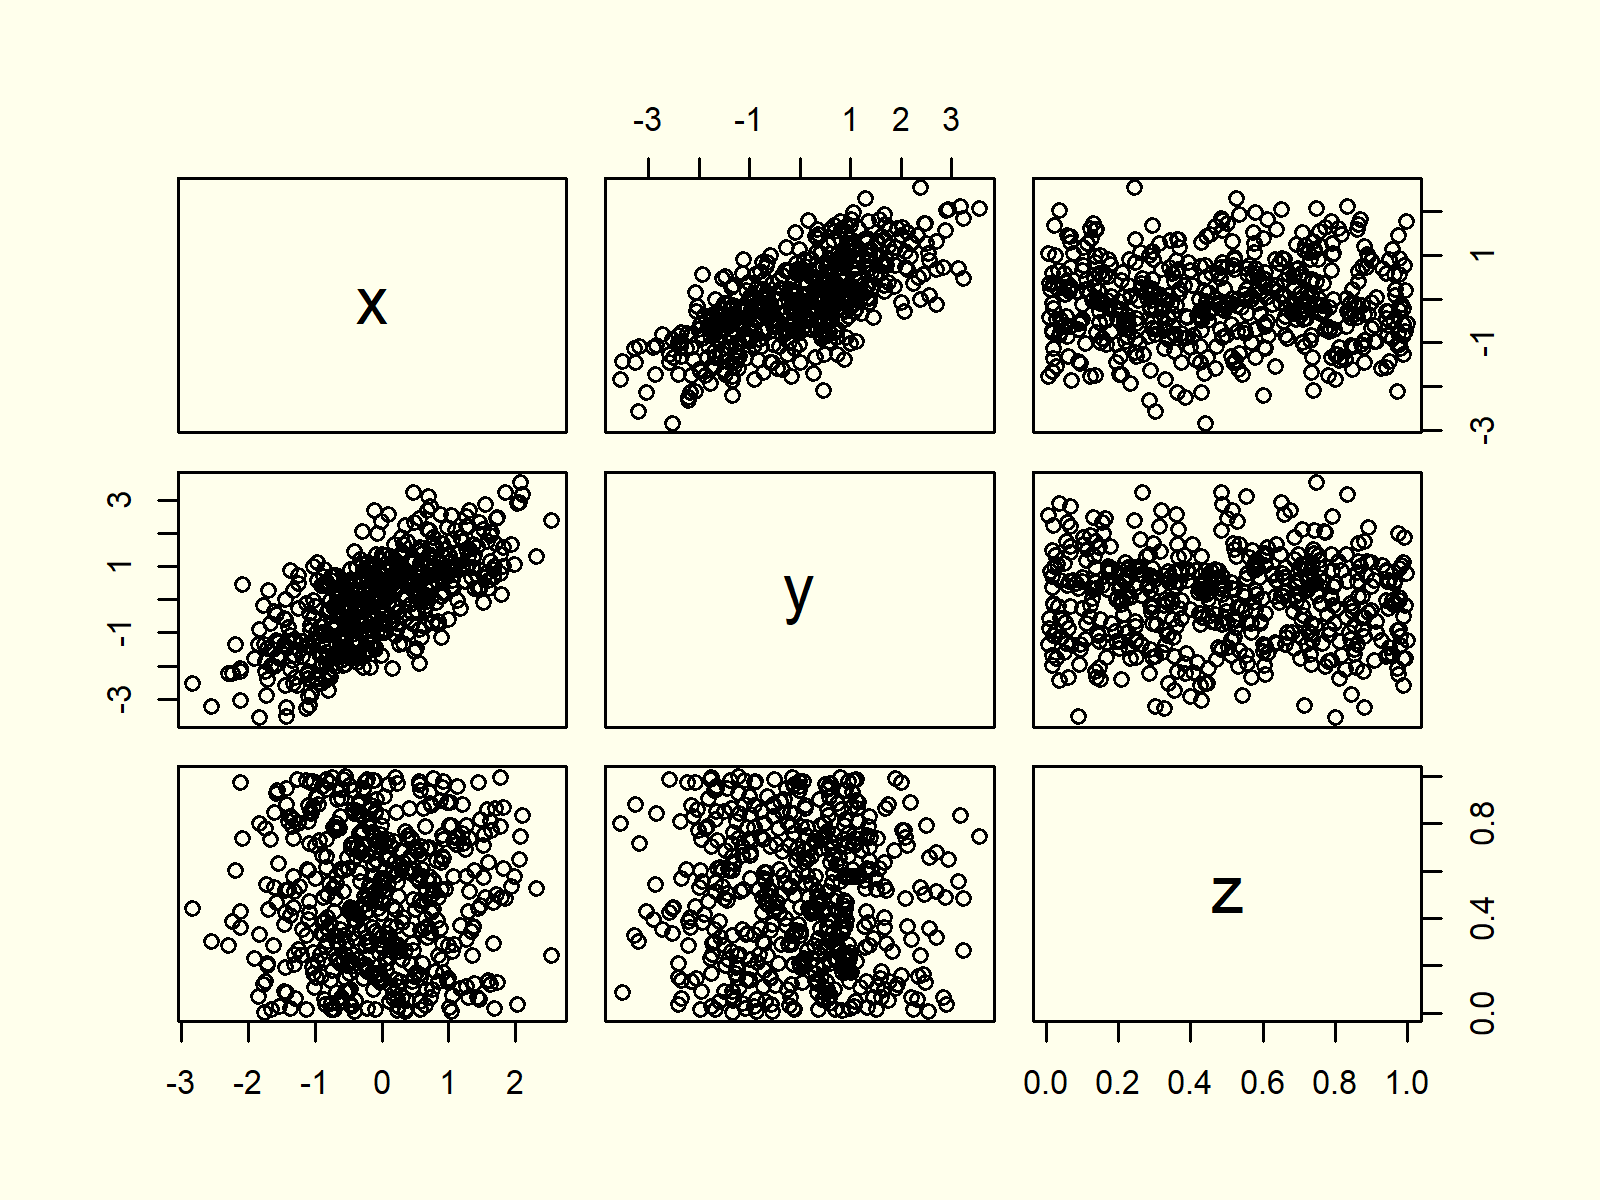
Figure 8: Scatterplot Matrix Created with pairs() Function.
As you can see based on Figure 8, each cell of our scatterplot matrix represents the dependency between two of our variables.
Example 9: Scatterplot in ggplot2 Package
So far, we have created all scatterplots with the base installation of R. However, there are several packages, which also provide functions for the creation of scatterplots.
In this example, I’ll show you how to draw a scatterplot with the ggplot2 package. Let’s install and load the package:
install.packages("ggplot2")                       # Install ggplot2 package
library("ggplot2")                                # Load ggplot2 package
Now, we can use the ggplot and geom_point functions to draw a ggplot2 scatterplot in R:
ggplot(data, aes(x = x, y = y)) +                 # Scatterplot in ggplot2
  geom_point()
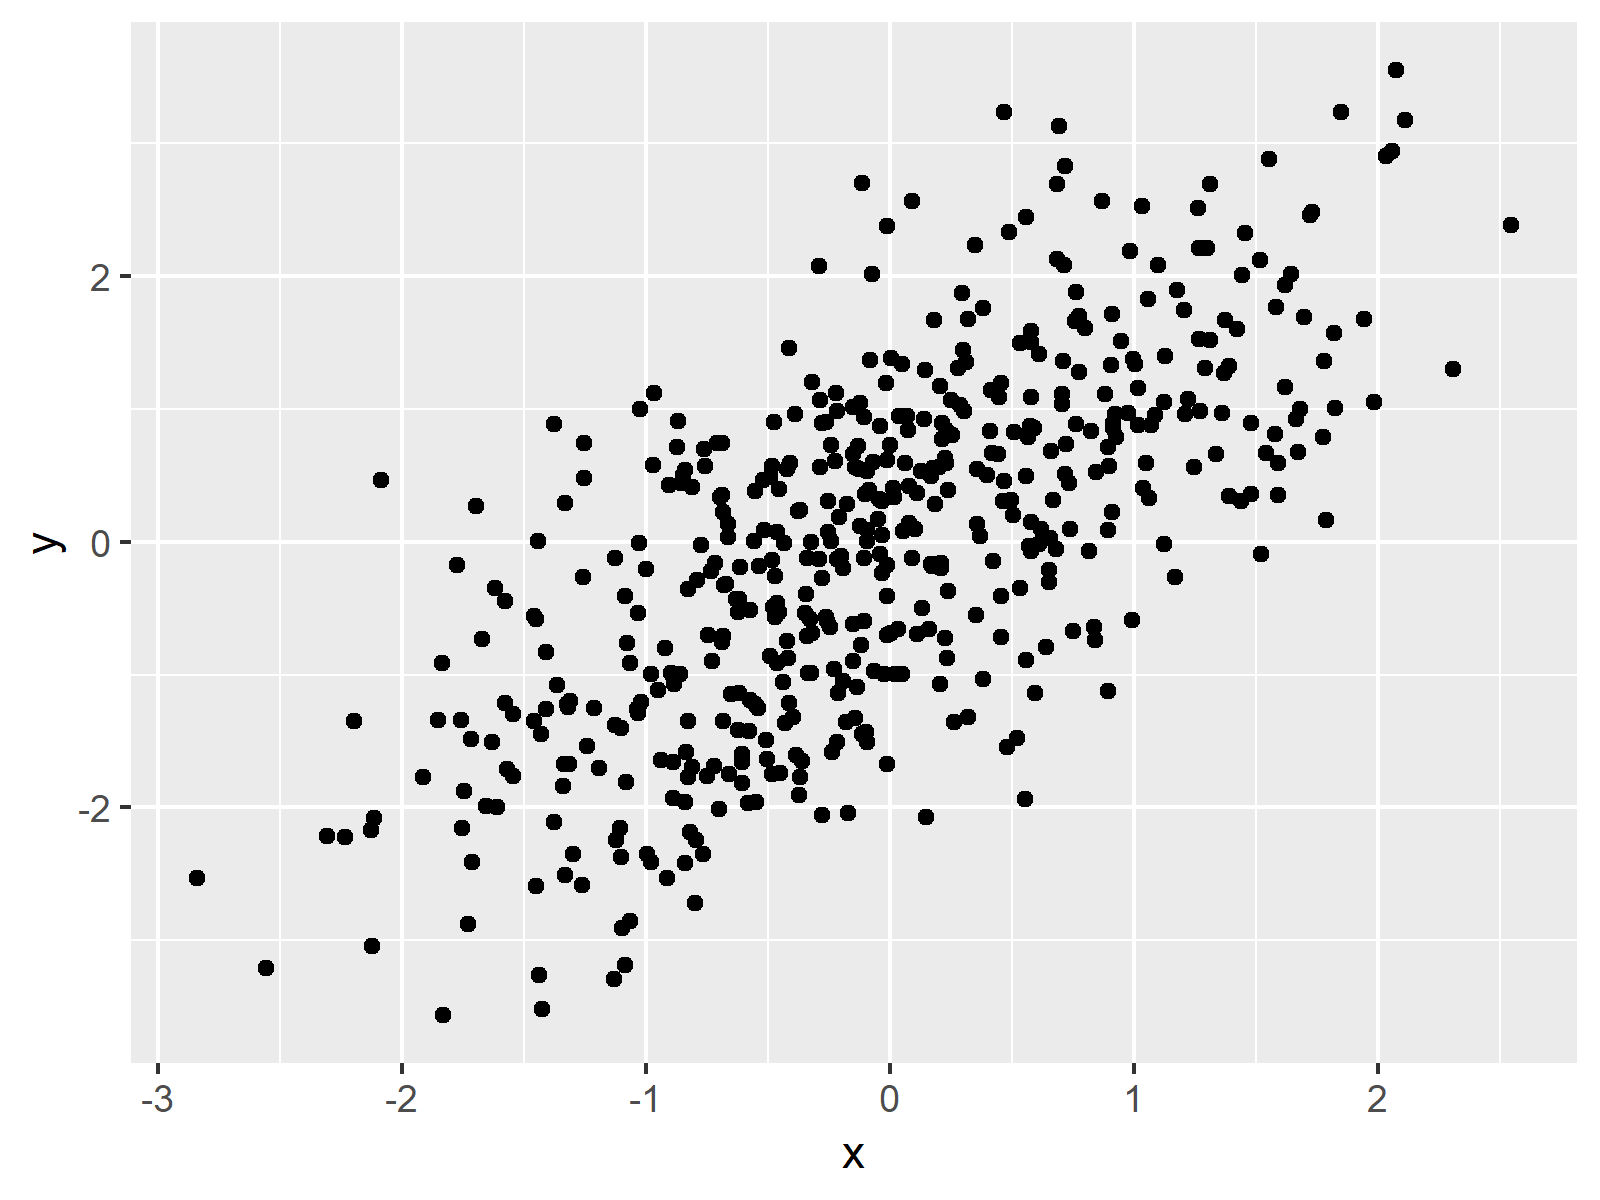
Figure 9: Scatterplot Created with the ggplot2 Package.
Figure 9 contains the same XYplot as already shown in Example 1. This time, however, the scatterplot is visualized in the typical ggplot2 style.
Example 10: Scatterplot in lattice Package
Another popular package for the drawing of scatterplots is the lattice package. First, we need to install and load the lattice package:
install.packages("lattice")                       # Install lattice package
library("lattice")                                # Load lattice package
The lattice package contains the xyplot command, which is used as follows:
xyplot(y ~ x, data) # Scatterplot in lattice
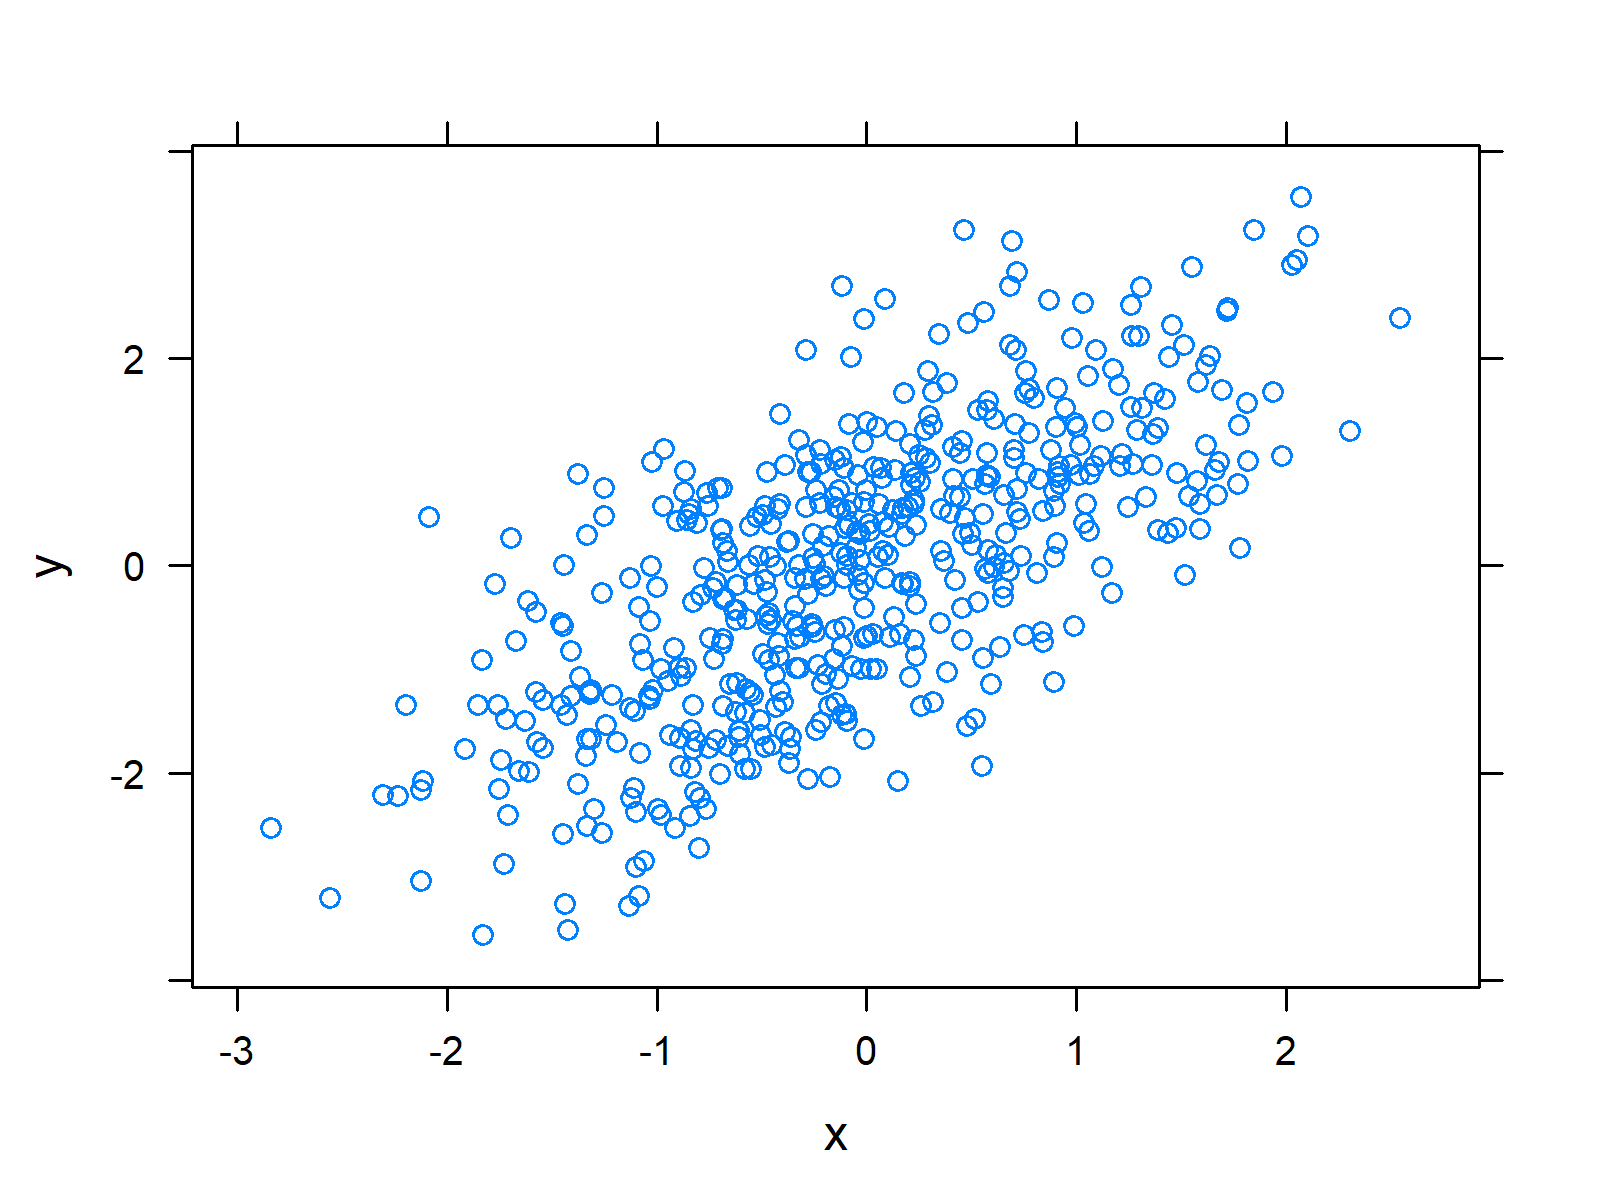
Figure 10: Scatterplot Created with the lattice Package.
Again the same picture as in Examples 1 and 9, but this time with a lattice design.
Video & Further Resources
Have a look at the following video of my YouTube channel. In the video, I’m showing the R programming syntax of this tutorial:
The YouTube video will be added soon.
Furthermore, you could read the related tutorials on my website. You can find some other tutorials about the plotting of data here.
- The plot Function in R
- lowess() R Smoothing Function
- R pairs & ggpairs Plot Functions
- Rotate Axis Labels of Base R Plot
- Remove Axis Values of Scatterplot in Base R
- Set Aspect Ratio of Scatterplot
- Create Pretty Axis Text
- Add Legend to ggplot2 Scatterplot
- Remove Axis Labels & Ticks of ggplot2 Plot
- abline Function in R
- R Graphics Gallery
- R Functions List (+ Examples)
- The R Programming Language
In this tutorial you learned how to make a scatterplot in RStudio, i.e. the R programming language. If you have additional questions or comments, let me know in the comments section.


10 Comments. Leave new
Great. Easy to follow and understand.
Thanks a lot for the awesome feedback Noah! 🙂
Great job! I was wondering if you can make a dynamic scatterplot?
Hey Araz,
Thanks a lot for the kind feedback, glad you like the tutorial!
I have no article on dynamic plots yet (this is planned for the future). However, you may have a look at the gganimate package for more info on this.
Regards,
Joachim
thank you for every thing.
You are very welcome Dilshad, glad you like my tutorials! 🙂
mega, hat mir sehr bei meiner ba geholfen!
Hallo Maren,
Danke sehr. Ich freu mich, dass es dir geholfen hat.
Liebe Grüsse,
Cansu
can you describe how to add 2 fold error lines around the abline
Hello Rizwan,
You can check our tutorial: Add Regression Line to ggplot2 Plot in R. I hope it helps!
Regards,
Cansu