Rotate Axis Labels of Base R Plot (3 Examples)
In this article, I’ll explain how to rotate axis labels of a Base R plot in the R programming language.
The content of the post is structured as follows:
- Example Data
- Example 1: Rotate Axis Labels Horizontally
- Example 2: Rotate Axis Labels Perpendicular to the Axis
- Example 3: Rotate Axis Labels Vertically
- Video, Further Resources & Summary
Let’s get started…
Example Data
In the examples of this R tutorial, we’ll use the following example data:
set.seed(77777)        # Create example data
x <- rnorm(1000)
y <- rnorm(1000)
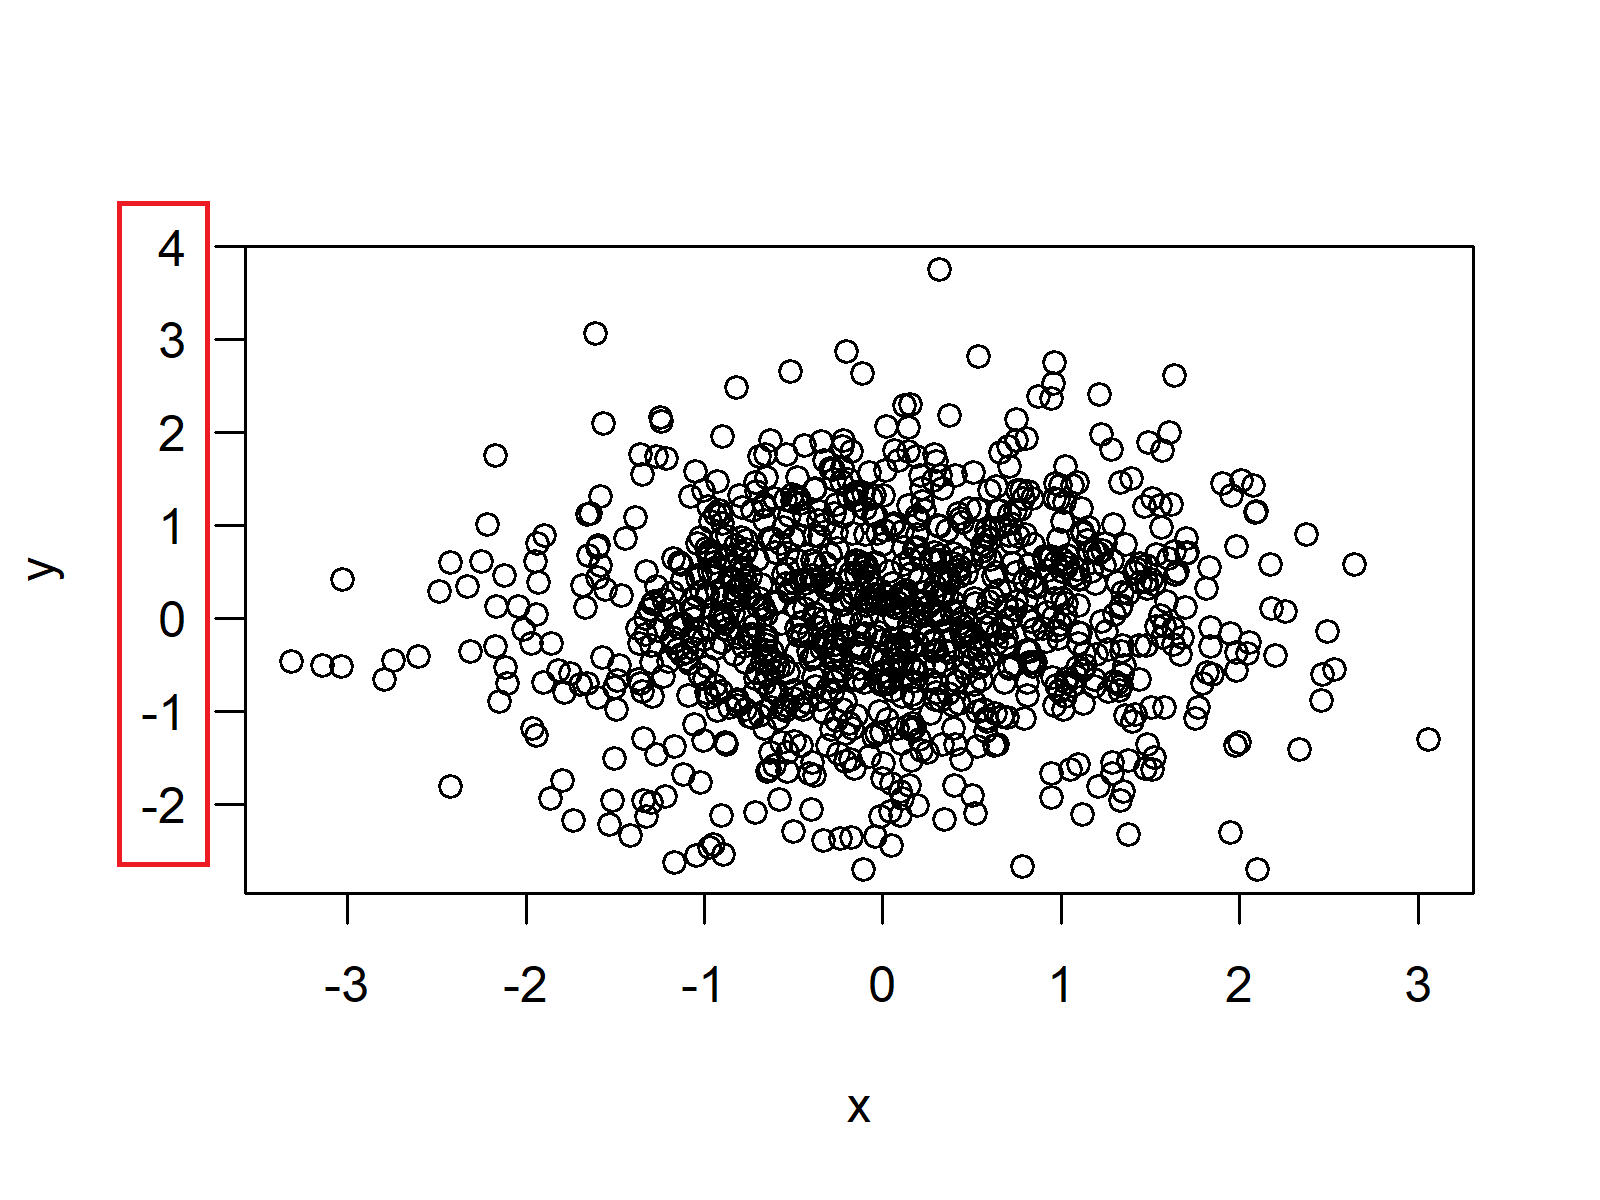
The default plot looks as follows:
plot(x, y) # Default plot - parallel to the axis

Figure 1: Base R Plot with Default Specifications.
The axis labels of the x-axis have a horizontal orientation and the y-axis labels have a vertical orientation.
Example 1: Rotate Axis Labels Horizontally
In order to change the angle of the axis labels of a Base R plot, we can use the las argument of the plot function. If we want to rotate our axis labels to a horizontal position, we have to specify las = 1:
plot(x, y, las = 1) # Horizontal labels

Figure 2: Horizontal Angle of Axis Labels.
Note that we can modify the las argument in any kind plot of Base R. In this example, we illustrated the las argument based on a scatterplot. However, we could also apply this R syntax for a barplot, histogram, boxplot, and so on…
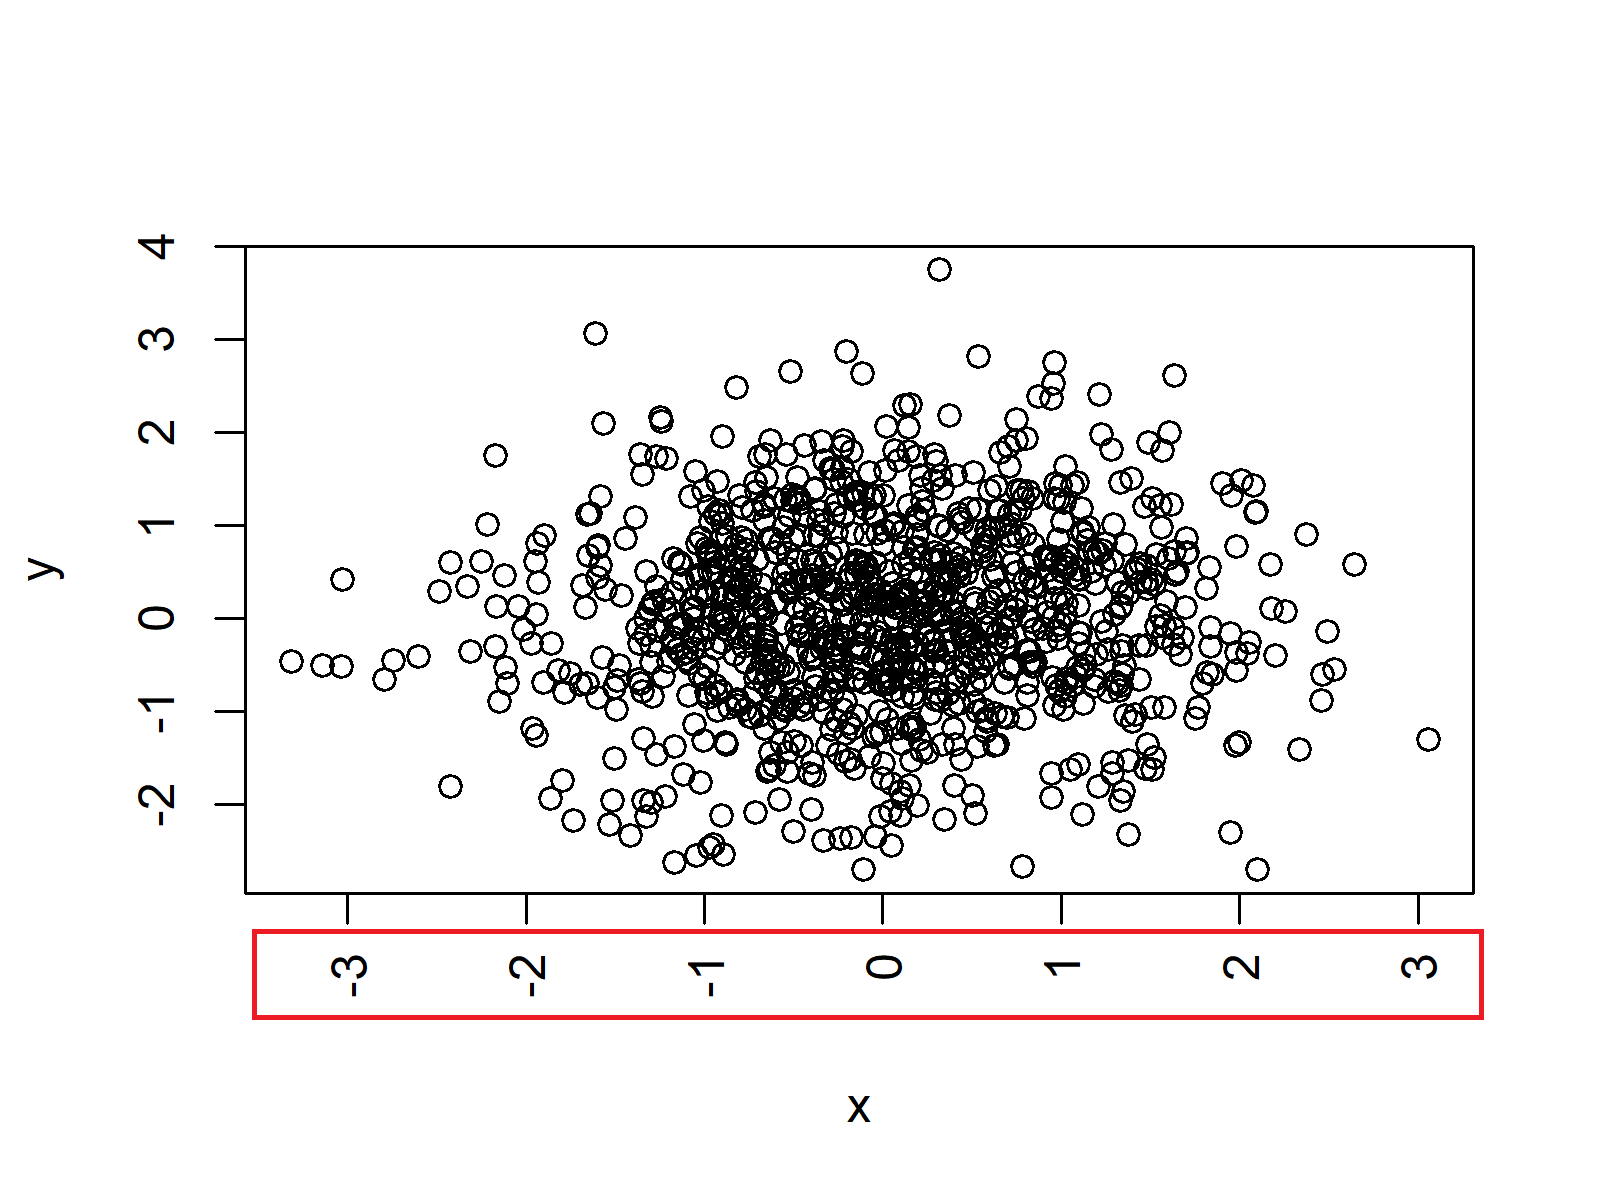
Example 2: Rotate Axis Labels Perpendicular to the Axis
If we want to show our axis labels in a perpendicular angle to the Axis, we have to specify las = 2:
plot(x, y, las = 2) # Perpendicular to the axis

Figure 3: Labels Perpendicular to the Axis.
Example 3: Rotate Axis Labels Vertically
For vertical axis labels, we need to specify las = 3:
plot(x, y, las = 3) # Vertical labels

Figure 4: Vertical Angle of Axis Labels.
Video, Further Resources & Summary
Have a look at the following video of my YouTube channel. In the video, I explain the R programming syntax of this article in R:
In addition to the video, you could read the related articles on https://statisticsglobe.com/.
- Remove Axis Values of Plot in Base R
- axis() Function in R
- Rotate Axis Labels of ggplot2 Plot
- R Graphics Gallery
- The R Programming Language
In this post you learned how to adjust the angles of axis text with a different degree of rotation in R programming. Don’t hesitate to let me know in the comments, if you have any further questions.


