abline Function in R (6 Examples)
In this tutorial, I’ll illustrate how to draw lines to plots using the abline function in R programming.
The article consists of the following information:
So without further ado, let’s dive right in:
Definition & Basic R Syntax of abline Function
Definition: The abline R function adds straight lines to a plot.
Basic R Syntax: You can find the basic R programming syntax of the abline function below.
abline(h = 1) # Basic R syntax of abline function
In the following, I’ll show six examples for the application of the abline function in R.
Creation of Example Data
Have a look at the following example data.
set.seed(9764355)              # Create example data
x <- rnorm(1000)
y <- rnorm(1000) + 0.4 * x
The previous R code created two vectors containing 1000 numeric values each. The two vectors are correlated.
Next, we can plot our example data:
plot(x, y) # Create plot without lines
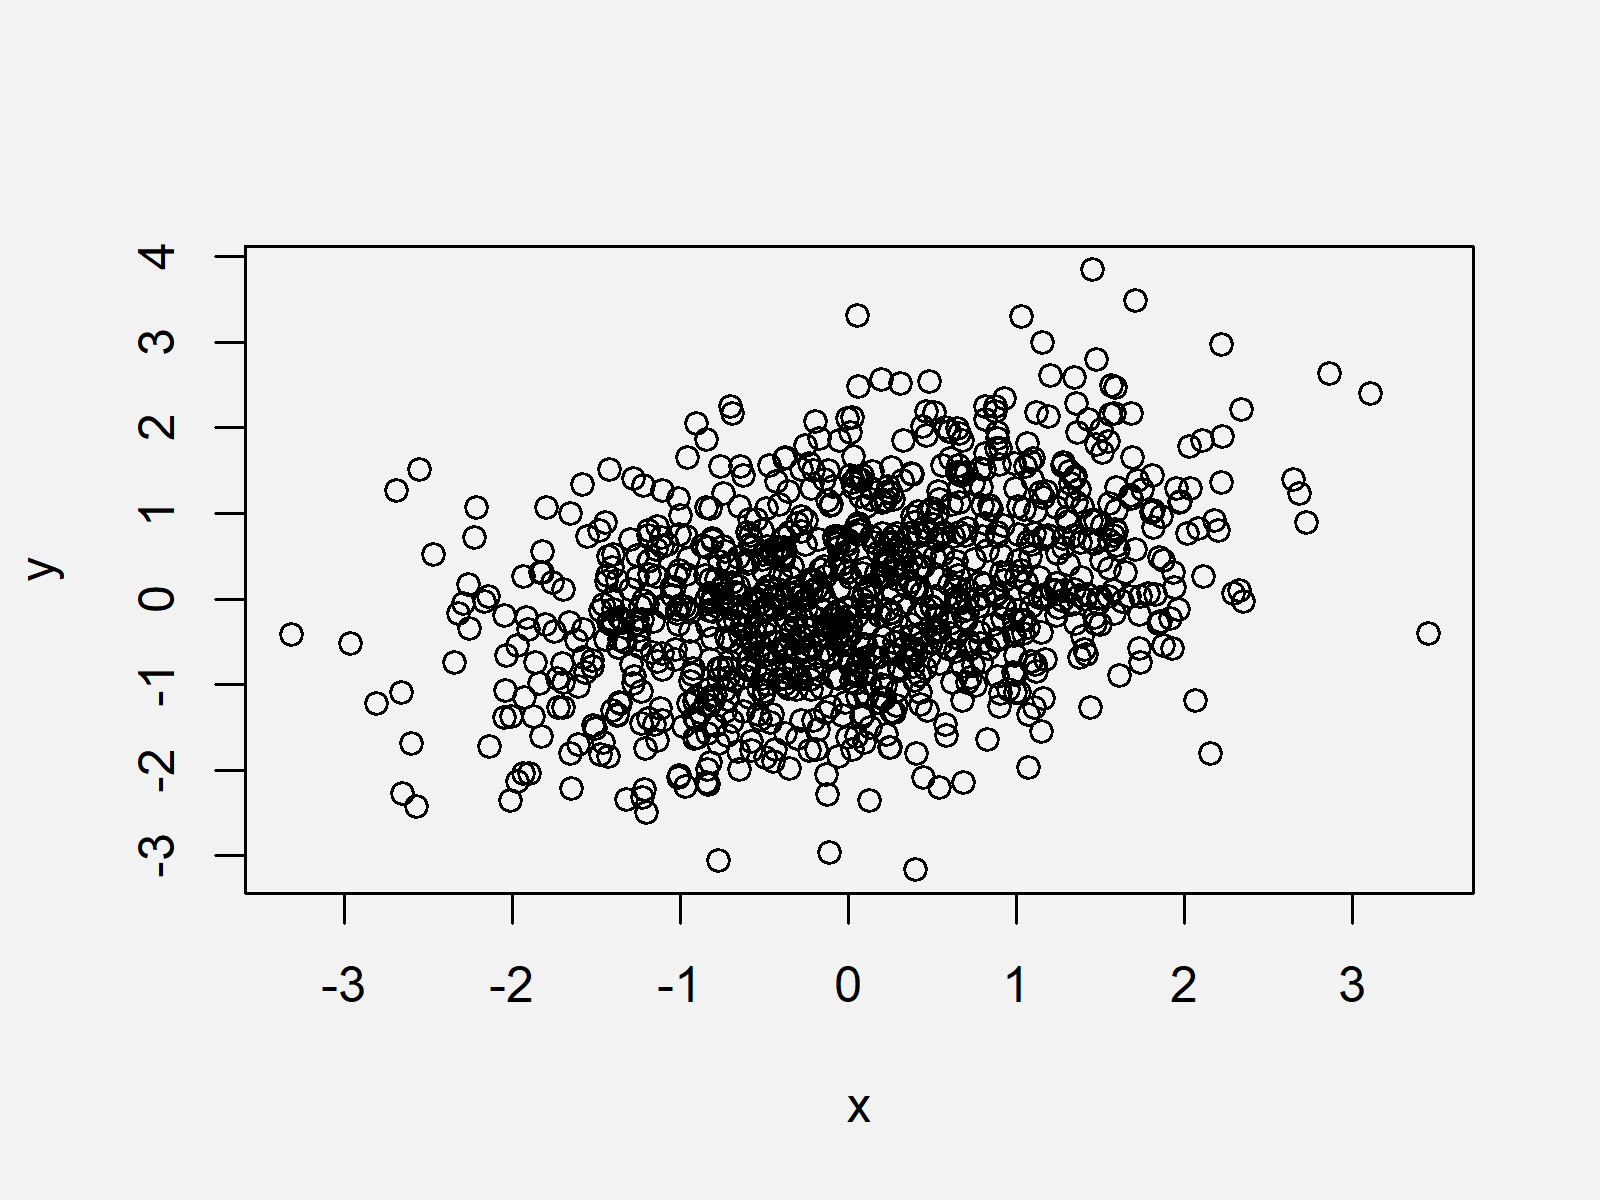
As shown in Figure 1, the previous R syntax created a scatterplot without any lines. Note that we could also use any other type of graphic in this tutorial (e.g. boxplots, barcharts, histograms, line charts and so on).
Example 1: Draw Horizontal Line to Plot Using abline Function
In this Example, I’ll explain how to add a horizontal line to our example plot using the abline function. For this task, we need to specify the h argument within the abline command:
plot(x, y)                     # Create plot without lines
abline(h = 1.3)                # Add horizontal line
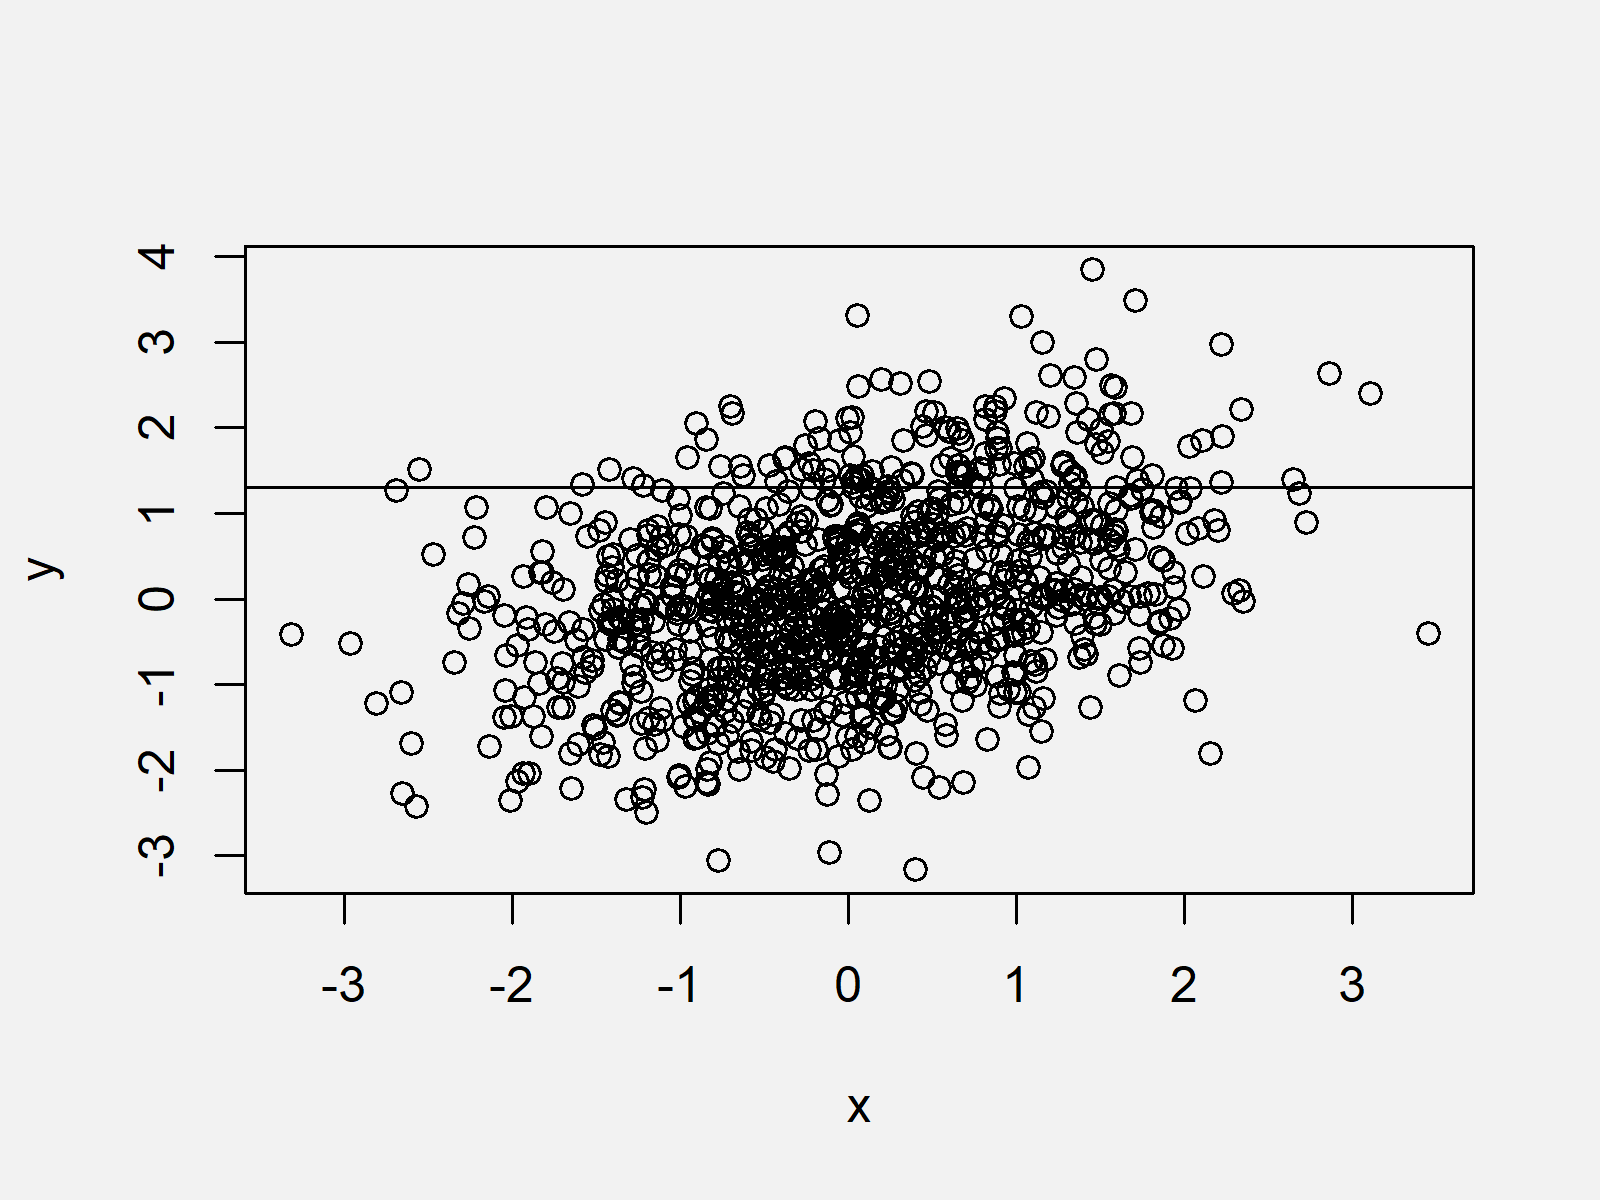
As shown in Figure 2, we created a graphic with a straight line at the y-axis position 1.3.
Example 2: Draw Vertical Line to Plot Using abline Function
In this Section, I’ll illustrate how to draw a vertical line to a plot. Similar to Example 1, we simply need to specify the v argument within the abline function:
plot(x, y)                     # Create plot without lines
abline(v = 1.3)                # Add vertical line
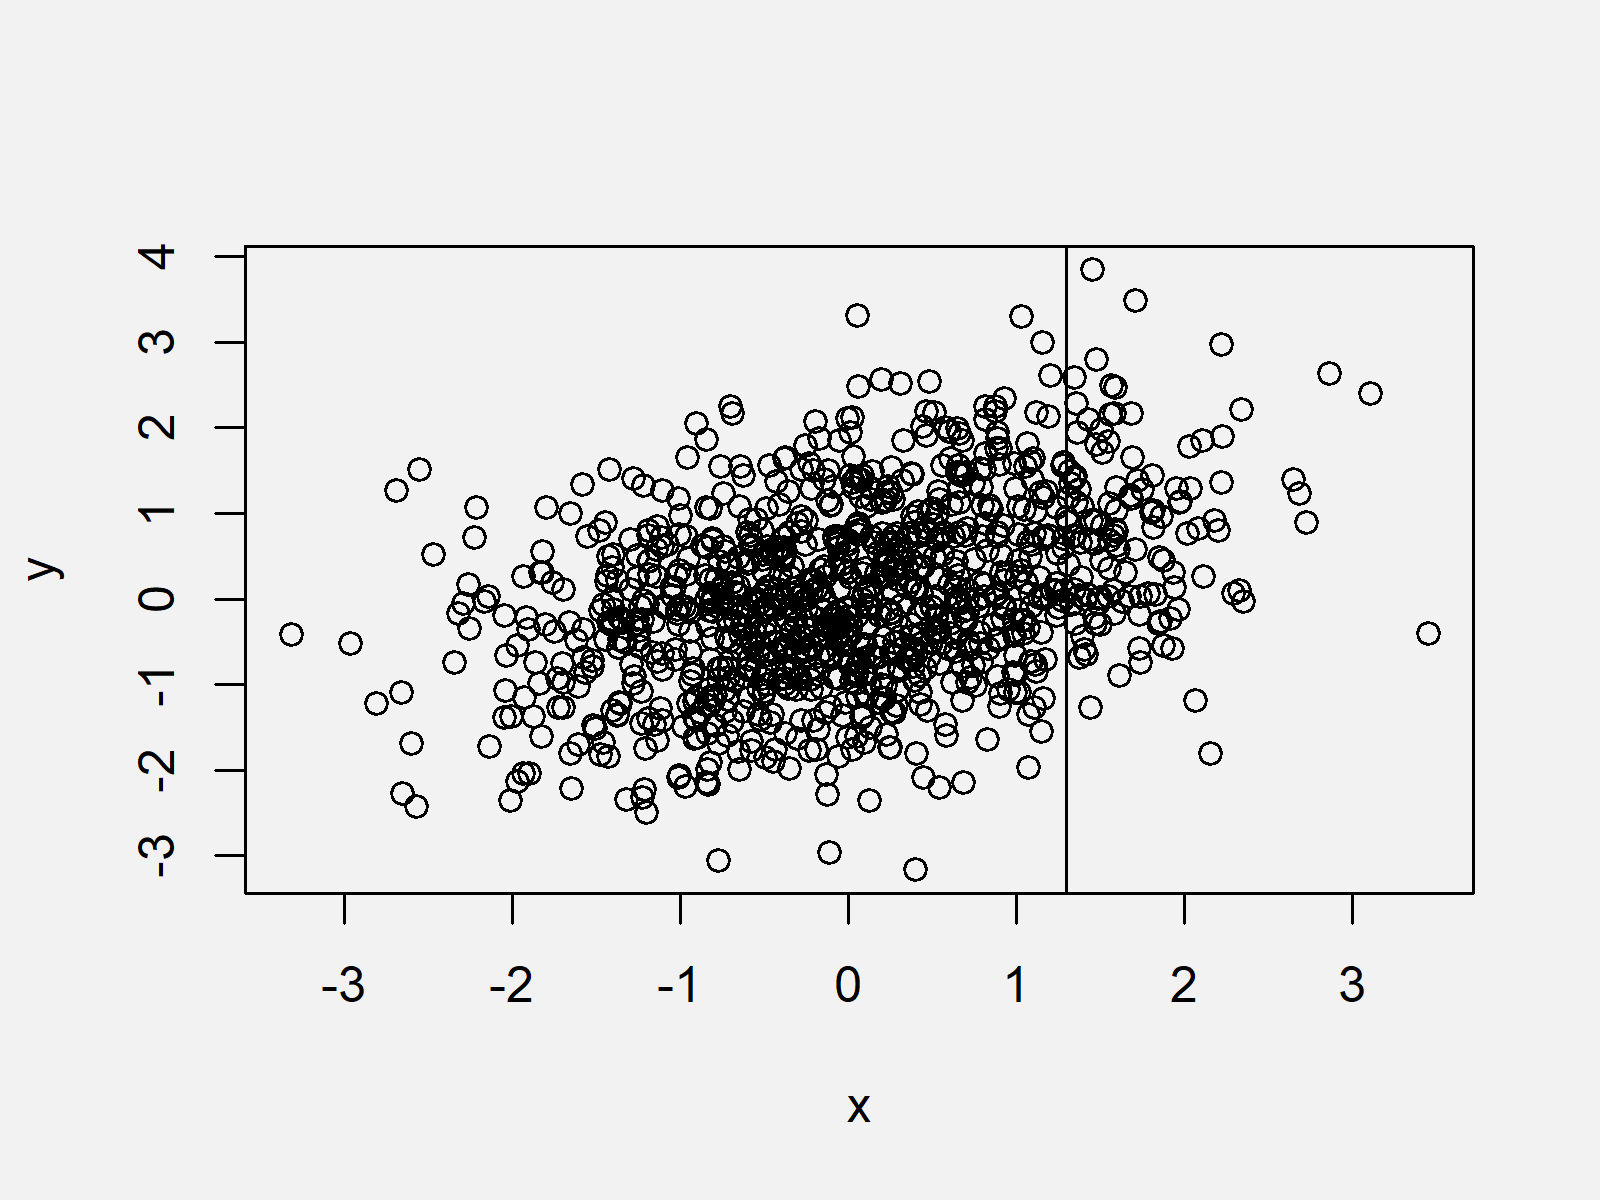
Figure 3 shows the output of the previously shown syntax: A xy-plot with a vertical line at the x-axis position 1.3.
Example 3: Draw Multiple Lines to Plot Using abline Function
This Section illustrates how to add multiple straight lines to a graph. In this example, we are drawing a vertical line and a horizontal line to our plot:
plot(x, y)                     # Create plot without lines
abline(v = 1.3)                # Add horizontal line
abline(h = 1.3)                # Add vertical line
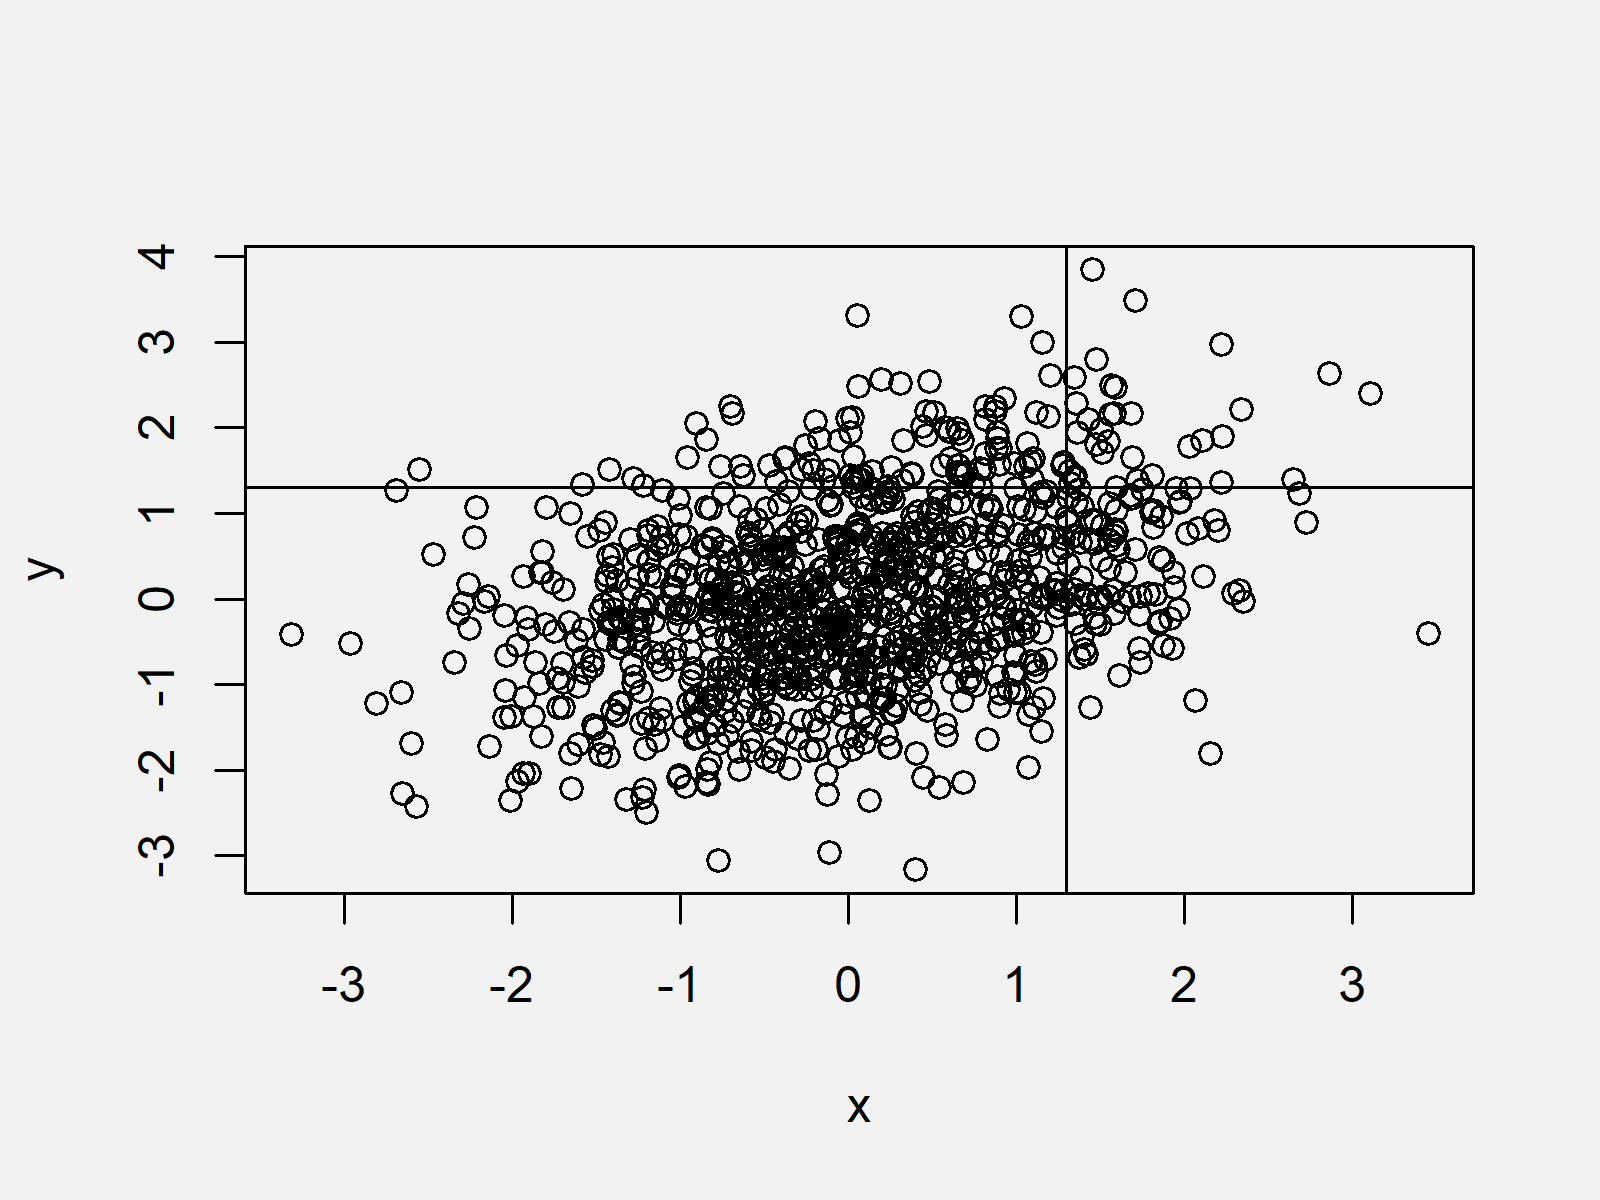
As shown in Figure 4, the previously shown R syntax created a plot with two lines.
Example 4: Modify Color, Type & Thickness of Line Using abline Function
The following R syntax explains how to change the color, the line type, and the line thickness. We can adjust the color using the col argument, the line type using the lty argument, and the line width using the lwd argument:
plot(x, y)                     # Create plot without lines
abline(v = 1.3,                # Add vertical line
       col = "red",            # Modify color
       lty = "dashed",         # Modify line type
       lwd = 5)                # Modify thickness
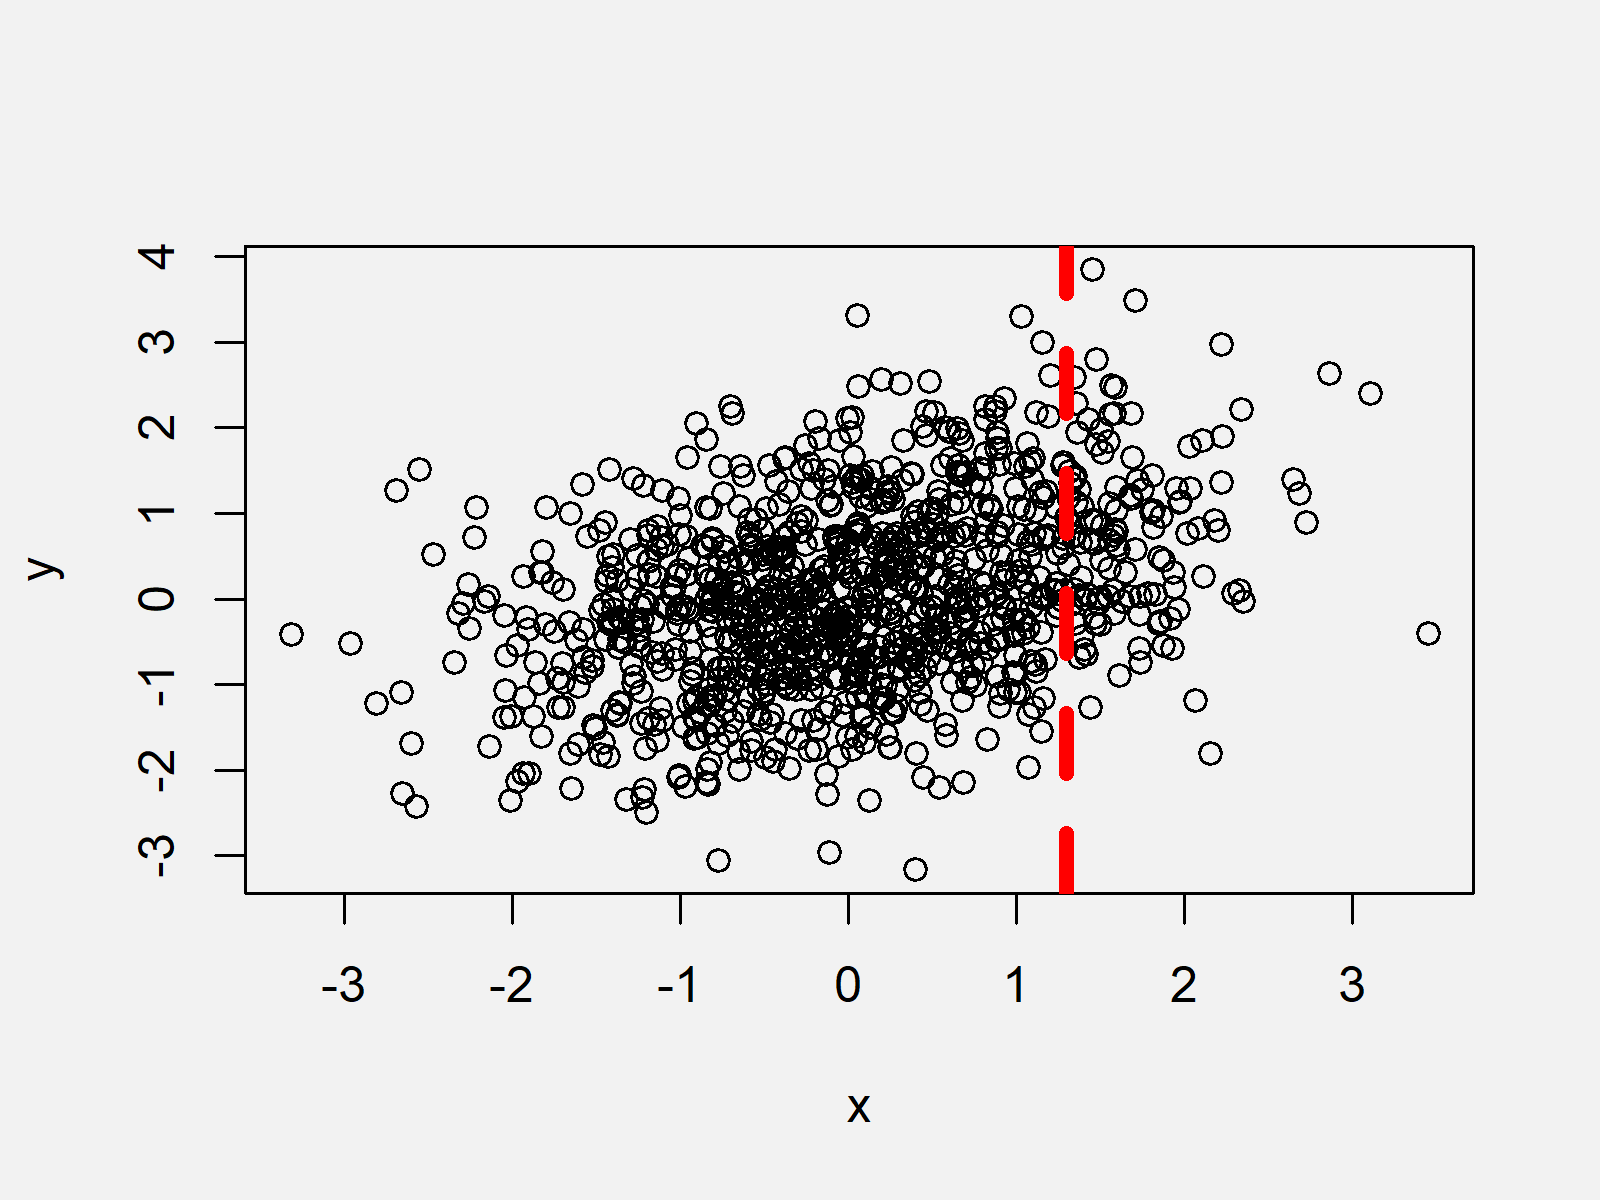
As shown in Figure 5, the previous syntax created a scatterplot containing a thick red line with a dashed line type.
Example 5: Draw Line with Intercept & Slope Using abline Function
So far, we have only used the h and v arguments to specify the positioning of our lines. In Example 5, I’ll illustrate how to draw a straight line based on an intercept (also called constant) and a slope. We can specify the intercept with the a argument and the slope with the b argument of the abline function:
plot(x, y)                     # Create plot without lines
abline(a = 0, b = 0.75)        # Add line with intercept & slope
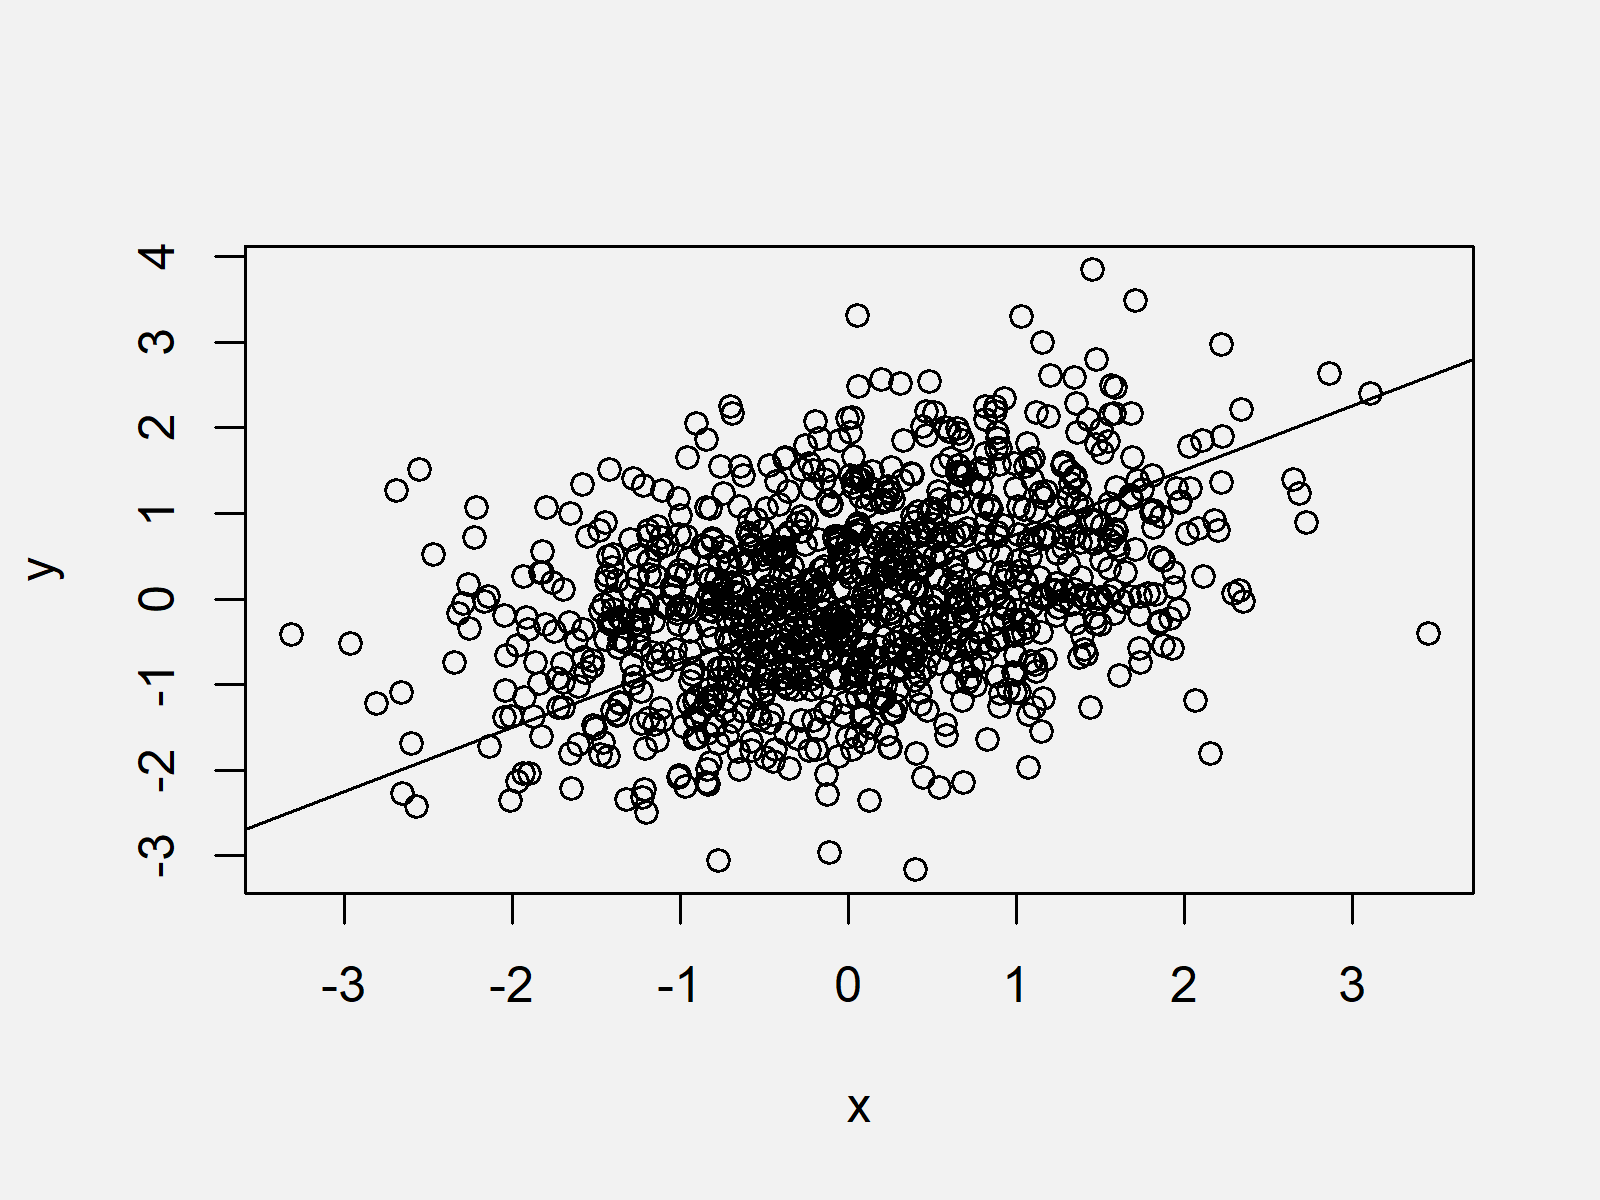
As shown in Figure 6, we created a graphic with a skewed straight line with the previous R syntax.
Example 6: Draw Regression Line to Plot Using abline Function
In the previous example, we defined the intercept and slope manually. In this Example, I’ll illustrate how to use the intercept and slope of a linear regression model. The linear regression can be modeled with the lm function. We simply need to set the reg argument of the abline function to be equal to the output of the lm function:
plot(x, y)                     # Create plot without lines
abline(reg = lm(y ~ x))        # Add regression line
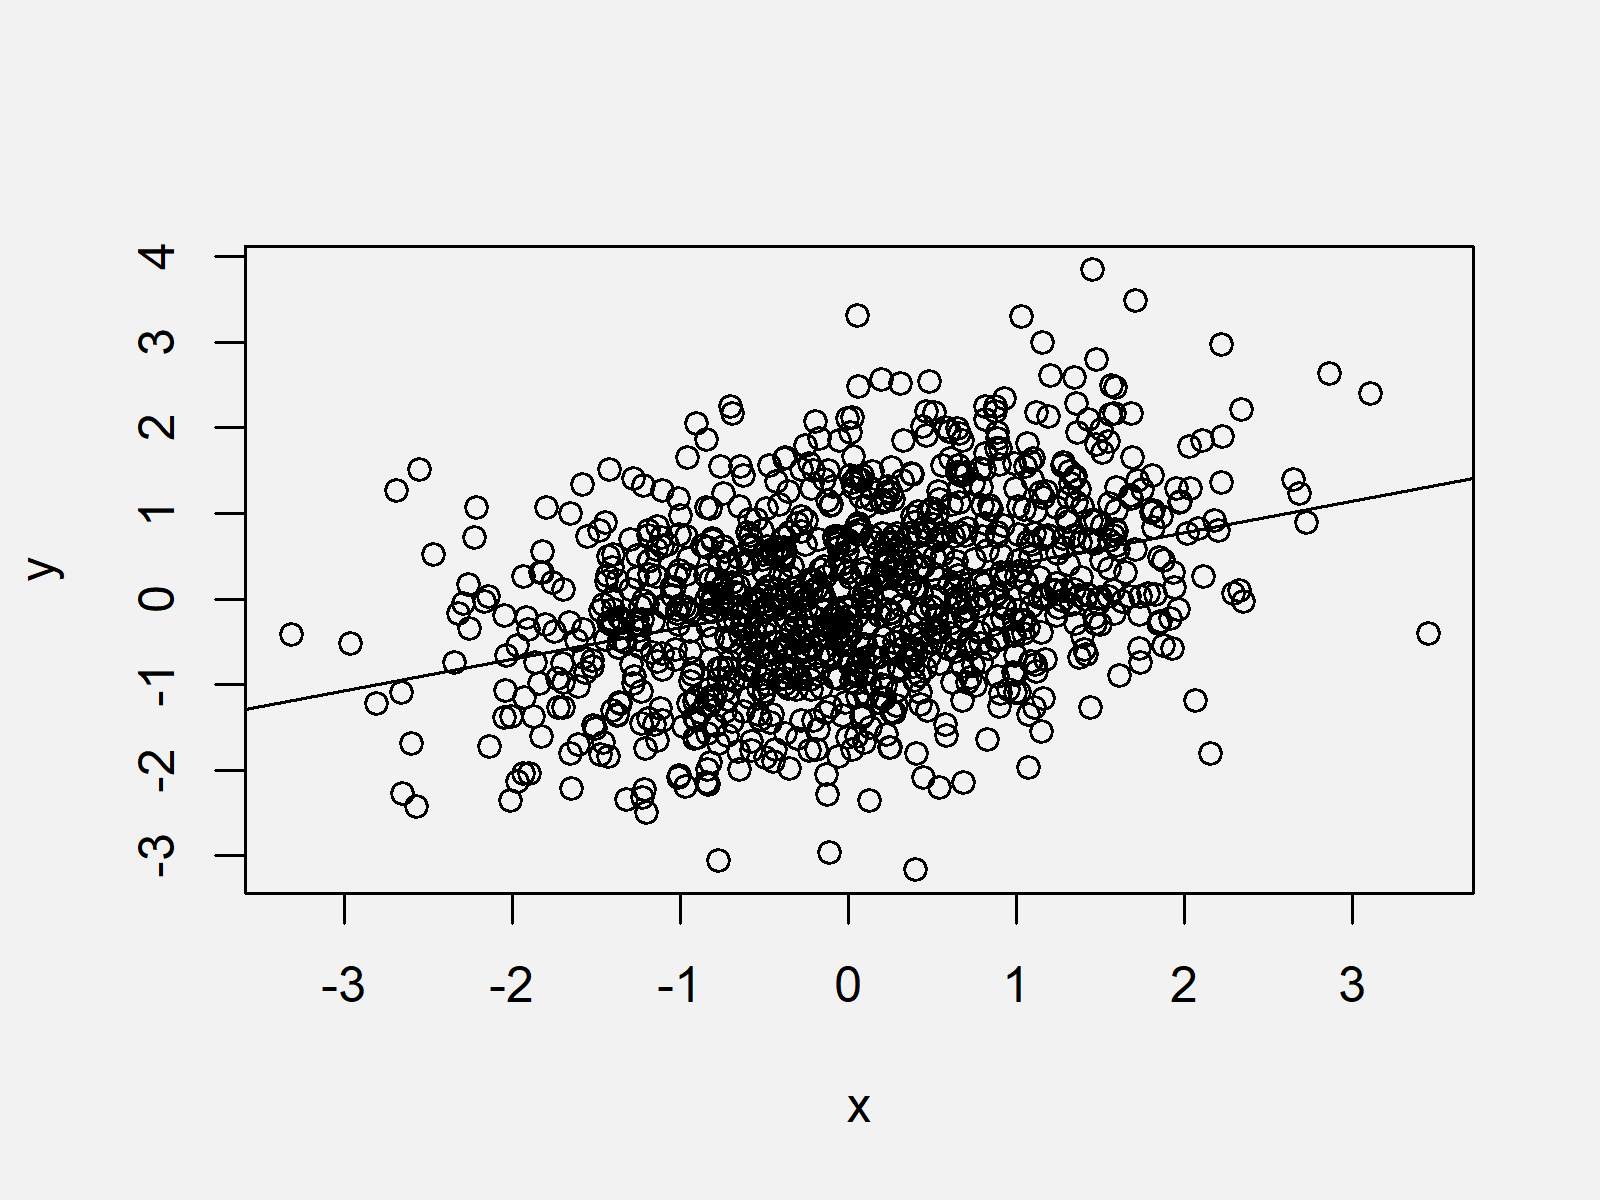
As shown in Figure 7, we plotted a scatterplot with regression line with the previous syntax.
Video & Further Resources
Would you like to know more about drawing lines to graphs? Then you could watch the following video of my YouTube channel. I’m explaining the R programming syntax of this tutorial in the video.
Furthermore, you may read the other articles which I have published on Statistics Globe.
- Draw Multiple Graphs & Lines in Same Plot
- Create Line Graph & Chart in RStudio
- Control Line Color & Type in ggplot2 Plot Legend
- Add Regression Line to ggplot2 Plot
- Draw Vertical Line to X-Axis of Class Date in ggplot2 Plot
- R Graphics Gallery
- R Functions List (+ Examples)
- The R Programming Language
This tutorial illustrated how to apply the abline function in R programming. In case you have additional questions, please let me know in the comments.


8 Comments. Leave new
great function for teaching – easy to implement
Absolutely Denny, this function is great! 🙂
Although am still going through without trying, your tutorials are promising. Wiil come bck to do details ater
Hi Stephen,
that’s great to hear. Feel free to check out the other tutorials.
Regards,
Matthias
it is very useful and learning also easy in this way, i enjoyed doing this
Hi Pavithra,
thanks for the nice comment, glad you like the tutorial.
Regards,
Matthias
hello dany this function is good explanation.
Hello Fahad,
thanks for the compliment, hope the tutorial was helpful.
Regards,
Matthias