Remove Axis Values of Plot in Base R (3 Examples)
In this tutorial, I’ll show how to remove axis values of a plot in Base R.
The article contains three examples for the removal of axis values. To be more precise, the tutorial contains these topics:
- Creating Example Data
- Example 1: Remove X-Axis Values of Plot in R
- Example 2: Remove Y-Axis Values of Plot in R
- Example 3: Remove Values of Both Axes of Plot in R
- Video, Further Resources & Summary
If you want to know more about these contents, keep reading:
Creating Example Data
In the examples of this R tutorial, we’ll use the following example data:
set.seed(159)                           # Create example data
x <- rnorm(100)
y <- x + rnorm(100)
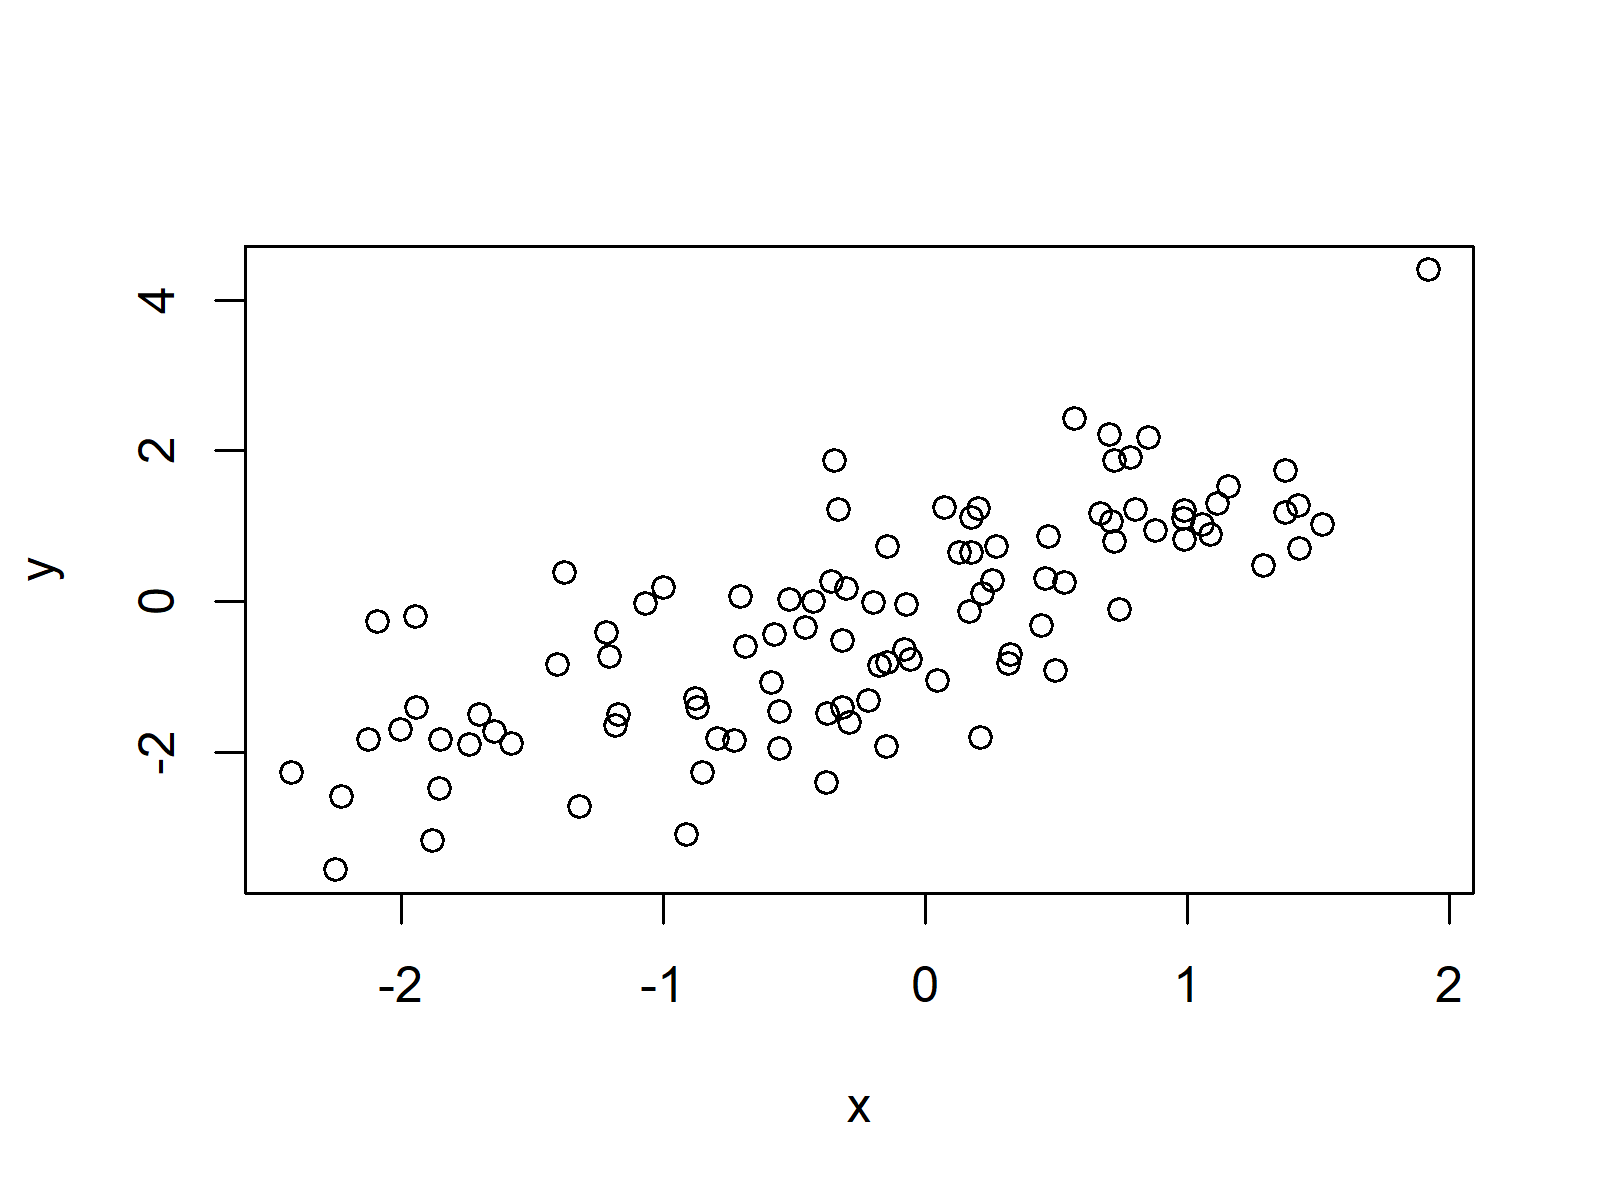
We can draw a Base R plot of this data with the following line of code:
plot(x, y) # Default plot with axis values

Figure 1: Default Plot in Base R.
Figure 1 shows how the default plot looks like. There are values on both axes of the plot.
Example 1: Remove X-Axis Values of Plot in R
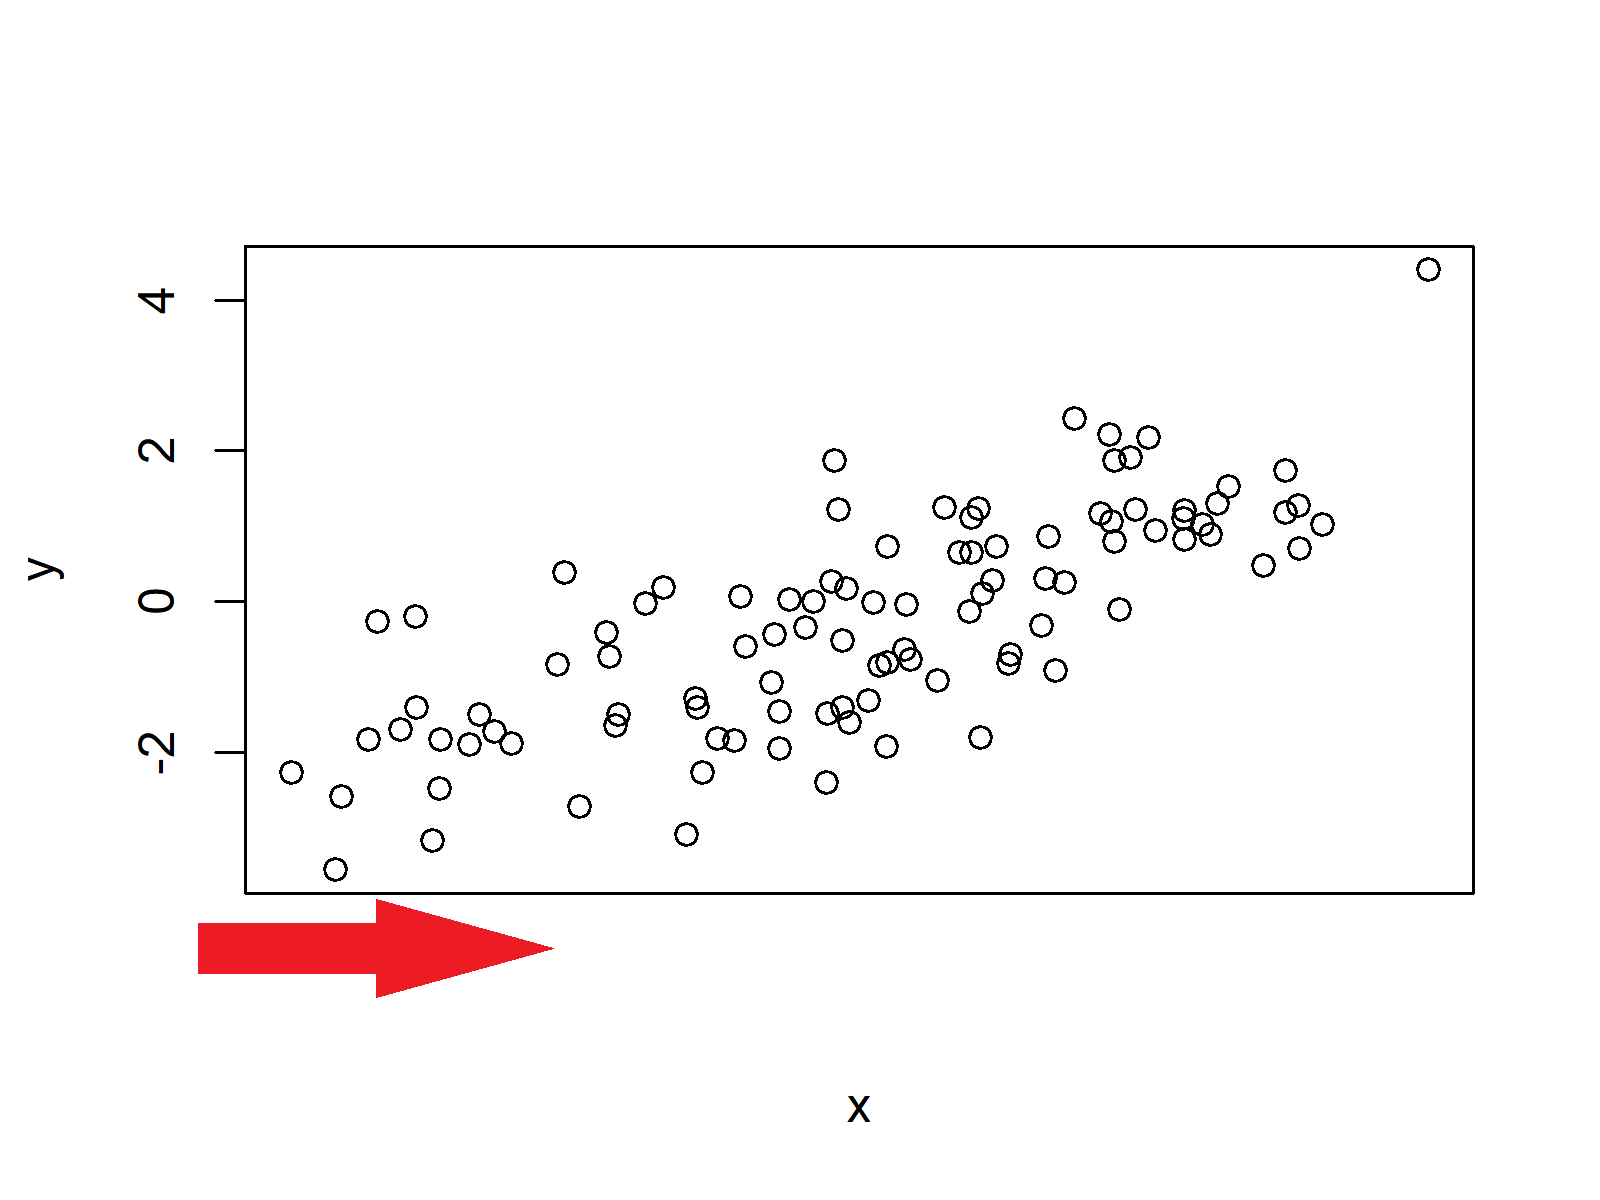
If we want to remove the x-axis values of our plot, we can set the xaxt argument to be equal to “n”. Have a look at the following R syntax:
plot(x, y, xaxt = "n") # Remove x-axis values

Figure 2: Plot without Values on X-Axis.
As you can see based on Figure 2, the values of the x-axis were deleted.
Example 2: Remove Y-Axis Values of Plot in R
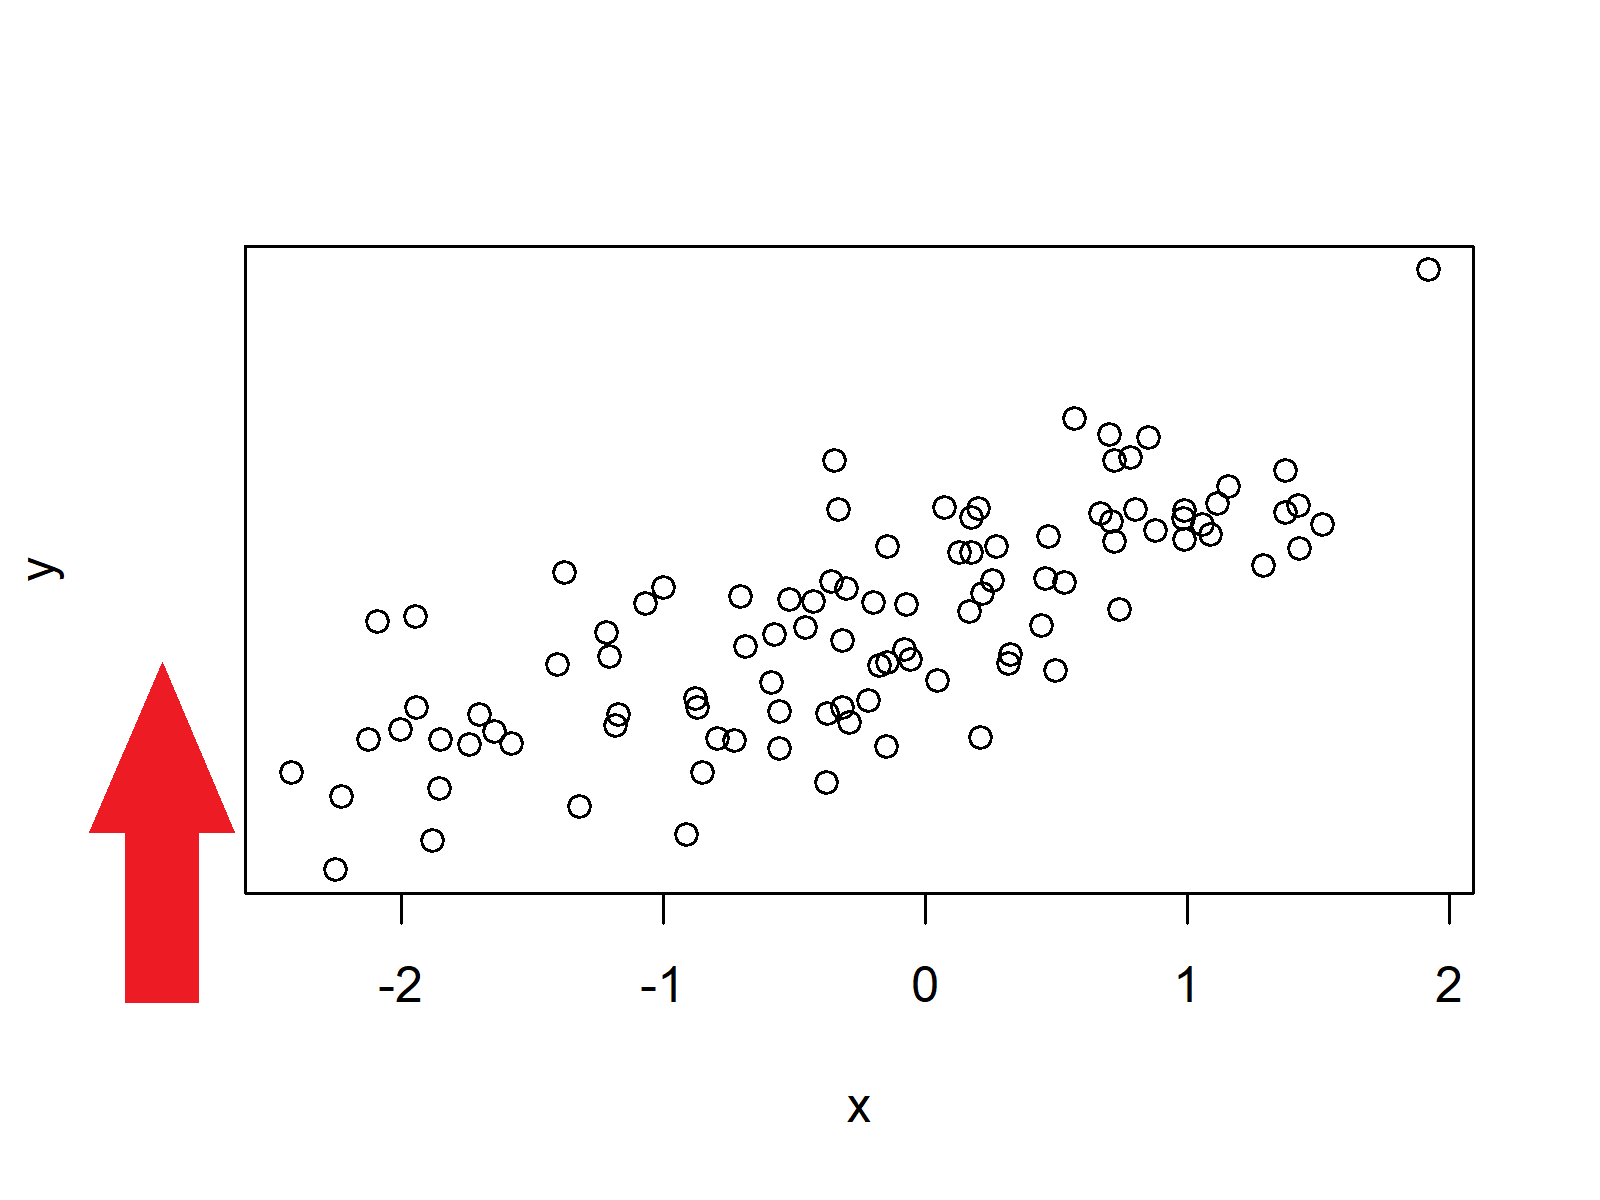
Similar to Example 1, we can use the yaxt argument to remove the values on the y-axis:
plot(x, y, yaxt = "n") # Remove y-axis values

Figure 3: Plot without Values on Y-Axis.
Example 3: Remove Values of Both Axes of Plot in R
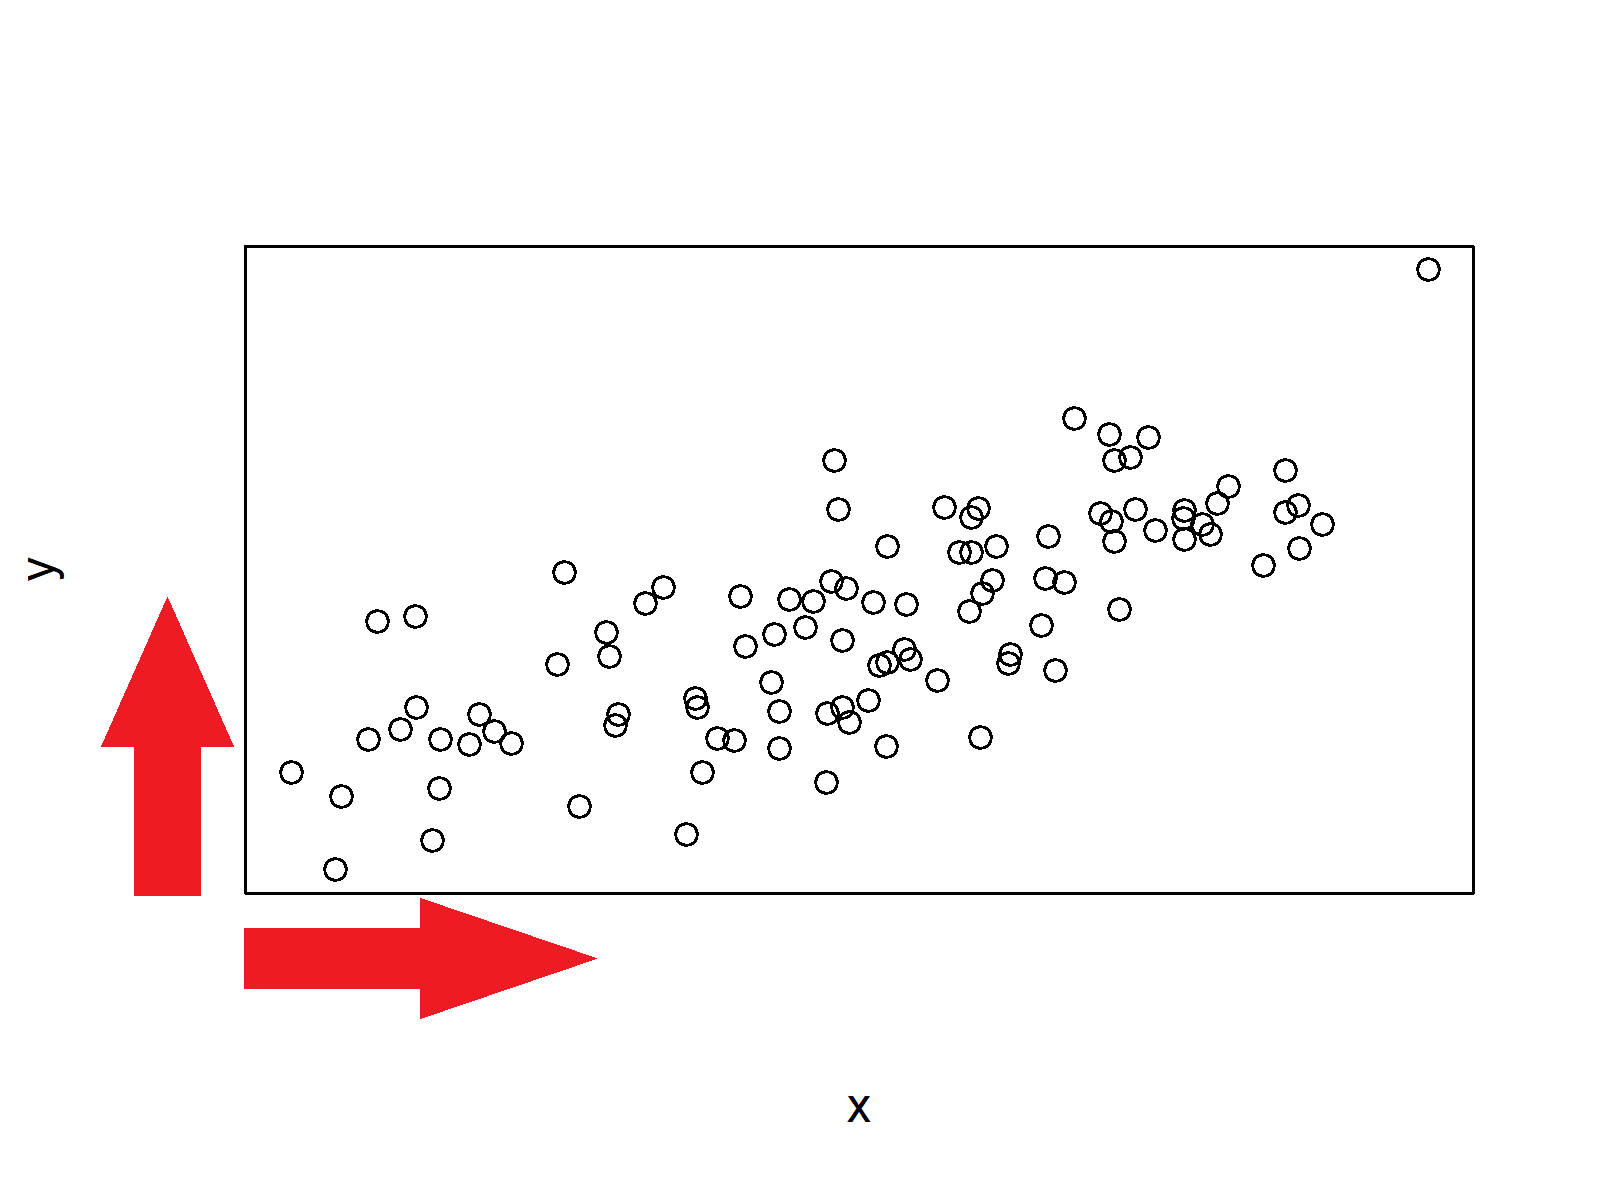
In case we want to delete all values on both axes of our plot, we can apply the xaxt and yaxt arguments simultaneously:
plot(x, y, xaxt = "n", yaxt = "n") # Remove values of both axes

Figure 4: Plot without Values on Both Axes.
Note that all examples of this tutorial relied on the scatterplot that we have created in the beginning of this page. However, we could apply the same logic to any kind of Base R plot (e.g. line plots, histograms, barplots and so on…).
Video, Further Resources & Summary
Have a look at the following video of my YouTube channel. In the video, I illustrate the R codes of this tutorial:
Furthermore, you could read the related RStudio tutorials on this website.
- Remove Axis Labels & Ticks of ggplot2 Plot
- Rotate Axis Labels of Base R Plot
- axis() Function in R
- R Graphics Gallery
- The R Programming Language
To summarize: In this article you learned how to hide axis elements of a Base R plot in the R programming language. Don’t hesitate to let me know in the comments, if you have any additional questions.


2 Comments. Leave new
Muchas gracias. ?Como puedo iniciar sesion?
Hey, Thanks for the comment. I don’t understand your question though 🙂 Regards, Joachim