R pretty Function | 3 Example Codes (Interval Sequence & Set Axis Labels of Plot)
Basic R Syntax:
pretty(x)
The pretty R function computes a sequence of equally spaced round values. The basic R syntax for the pretty command is illustrated above.
In this R tutorial, I’m going to show you three examples for the application of pretty in the R programming language.
So without further ado, let’s get started…
Example 1: Default Application of pretty()
The R pretty function is quite easy to apply. I’ll show you the default usage of pretty() based on a simplified example.
Let’s first create an example vector:
x <- 1:100 # Create example vector
Our example vector contains all integer numbers from 1 to 100.
Now, let’s apply pretty with the default options to this integer vector:
pretty(x)                                     # Apply pretty function to vector
# 0  20  40  60  80 100
As you can see, pretty() converted our vector to five intervals of equal length.
That was easy. However, you can specify additional options within the pretty function…
Example 2: Specify n-option Within pretty in R
One of the options that pretty provides is the n-option, which specifies the desired number of intervals.
By default, this option is set to n = 5 (as you have seen in Example 1). However, we can modify this default specification with the following line of code:
pretty(x, n = 10)                              # Apply pretty with modified intervals
# 0  10  20  30  40  50  60  70  80  90 100
We set n = 10, leading to an interval vector consisting of ten intervals.
So, how can we use this in practice?
Example 3: Plot With Pretty Axis Labels
The R pretty function is quite often used to modify the axis of base plots. Let’s create a second example vector…
y <- 1:100 # Create second example vector
…and the let’s plot our data in a scatterplot:
plot(x, y,                                     # Create plot of two vectors
     main = "Default Axis Labels")             # Default axis labels

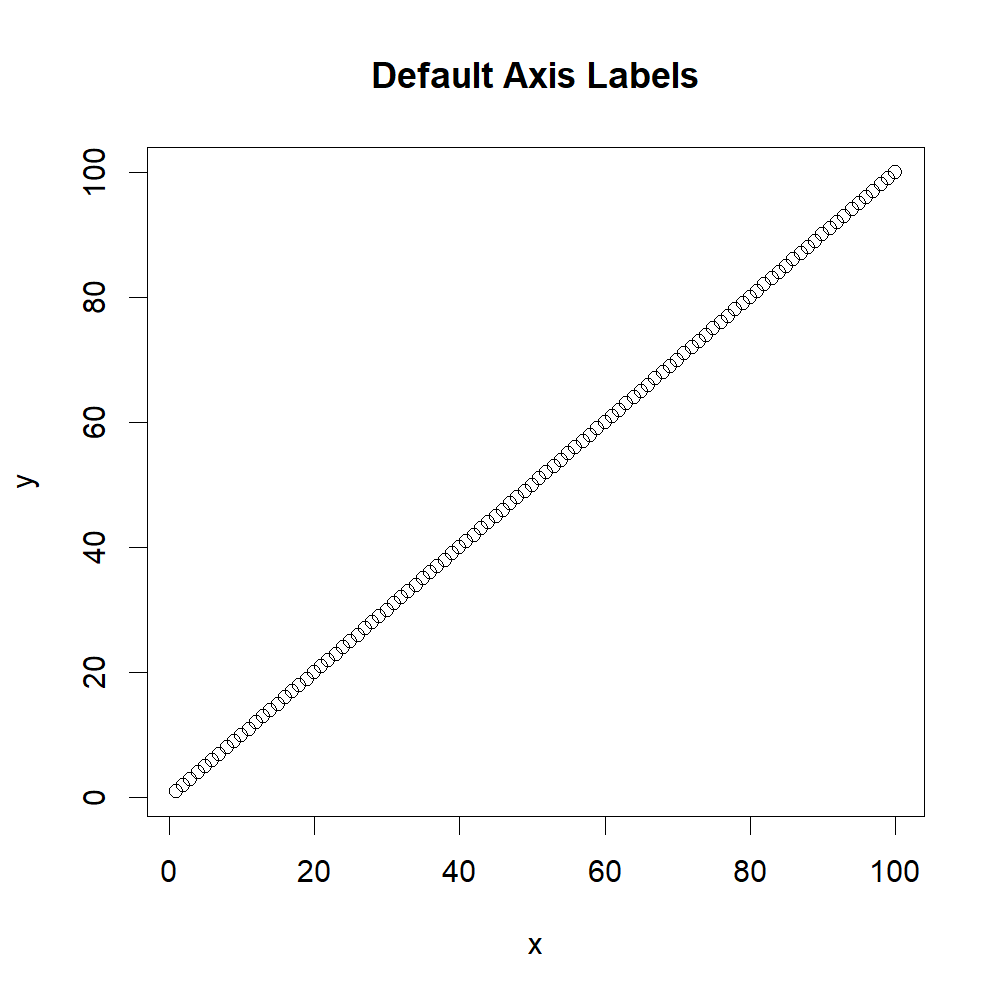
Figure 1: R Plot With Default Axis Labels.
As you can see, our two vectors x and y both consist of the integer numbers from 1 to 100. When we plot these data, our x- and y-axes have the labels 0, 20, 40, 60, 80, and 100 (i.e. five intervals).
Let’s assume that we want like to modify the number of intervals. Then, we first need to create a graphic without any axes:
plot(x, y,                                     # Create plot of two vectors
     xaxt = "n", yaxt = "n",                   # Delete axis labels
     main = "Pretty Axis Labels")

Figure 2: R Plot Without Default Axis Labels.
And then we can use the axis() function in combination with pretty() in order to change the number of intervals:
axis(side = 1, pretty(x, n = 20))              # Add modified x-axis labels via pretty()
axis(side = 2, pretty(y, n = 3))               # Add modified y-axis labels via pretty()

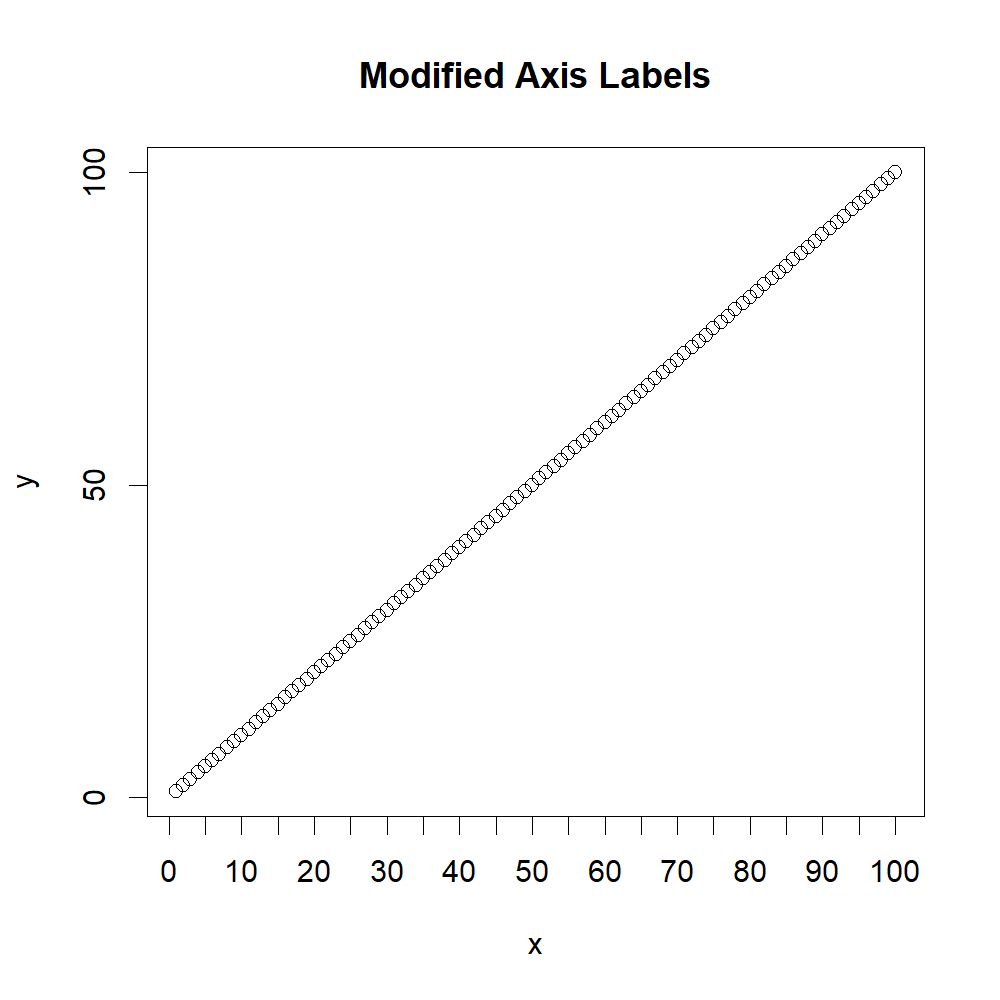
Figure 3: R Plot With Modified Axis Labels Via pretty() Function.
As you can see, I have changed the desired number of intervals to 20 for the x-axis and to 3 for the y-axis.
If you want, you can change many other options within the pretty R function as well. Just type ?pretty to your RStudio console to print an overview of all available options (e.g. min.n, shrink.sml, high.u.bias, u5.bias, eps.correct…).
Video Tutorial & Further Options to Customize R Plots
Have a look at the following video on my YouTube channel. In the video, I demonstrate the content of this tutorial:
Of course, there are many other possibilities how you can modify the axes of your R graphs. You can find a basic overview in the following video of the DataCamp YouTube channel:
Further Reading


