
Cansu Kebabcı | Statistician & Data Scientist
Note: Cansu Kebabcı was a Statistics Globe team member from November 2022 to February 2024. The following information might be outdated. Cansu has provided outstanding content to the Statistics Globe website and YouTube channel, so make sure to check out the list of her tutorials below.

Hello, my name is Cansu Kebabcı. I graduated from the master’s program in Statistics and Data Science at KU Leuven in 2022. I am thrilled to take the first step in my data scientist career within Statistics Globe, as I have been an enthusiast of tutoring in statistics and statistical programming since my bachelor’s years. I took teaching assistant roles at Sabanci University in fundamental concepts of statistics and applied statistics courses.
From my point of view, tutoring is a unique experience in which learning and teaching go hand in hand. To grow together in the knowledge of statistical methodology and programming, I will be sharing R, Python and statistical methodology tutorials on Statistics Globe.
Besides writing tutorials, I am also responsible for editing the tutorials written by our lovely team and responding to your questions and comments on the Statistics Globe’s webpage and YouTube channel.
It would be awesome if we could connect through the comments section below my and other team members’ tutorials. Please don’t hesitate to ask questions or leave suggestions for the upcoming tutorials.
Cansu’s Articles on Statistics Globe
You may find a list of tutorials that Cansu has created on Statistics Globe below.


Please leave a comment below or send a message via the contact form of Statistics Globe to get in touch with Cansu.
4 Comments. Leave new
Hi I have been following your youtube channel for R programming and they have helped me a lot. Is it possible that i can get your guidance for a project?
Hello Shahadat,
Sure, I can try to help. What kind of guidance do you need?
Regards,
Cansu
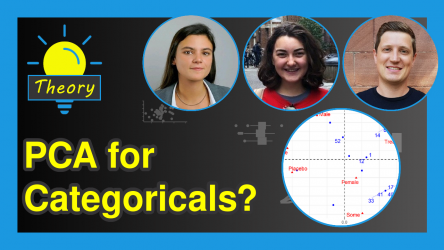
Hi, I’ve been working on a portfolio recently. I have a question about choosing the optimal components for PCA. I have a total of 8 variables in my PCA and PC1 has a variance of 27.09%, PC2 22.17%, and PC3 12.43%. I’m hesitant on how to interpret this result and whether I should set an 80% threshold. If I do, I will be taking up to PC5 which is kind of weird. Based on a result like this, would it mean that PCA might not be a suitable method to apply to this dataset?
Hello!
Did you check the correlation matrix? PCA is often used when there’s redundancy or collinearity among the variables. If your variables are not strongly correlated with each other, this suggests that each variable may convey a unique piece of information. In such cases, PCA might not be as effective or meaningful, as omitting some variables would lead to a substantial loss of information.
Additionally, how essential is the dimensionality reduction for your specific analysis? If the main goal isn’t to reduce the number of variables, and if the computation isn’t an issue, then PCA or other dimensionality reduction techniques might not be necessary.
Best,
Cansu