Draw Plot of Function Curve in R (2 Examples)
In this R tutorial you’ll learn how to create a plot showing the curve of a user-defined function.
The article will contain the following content:
So now the part you have been waiting for – the examples:
Example Function
Let’s first create a user-defined function in R:
my_fun <- function(x) {                        # Create own function
  x^2 - x * 1000
}
Next, I’ll show how to plot this function. So keep on reading!
Example 1: Plotting Function Curve Using Base R
In Example 1, I’ll explain how to draw a function in a plot using the curve() command of the basic installation of R programming.
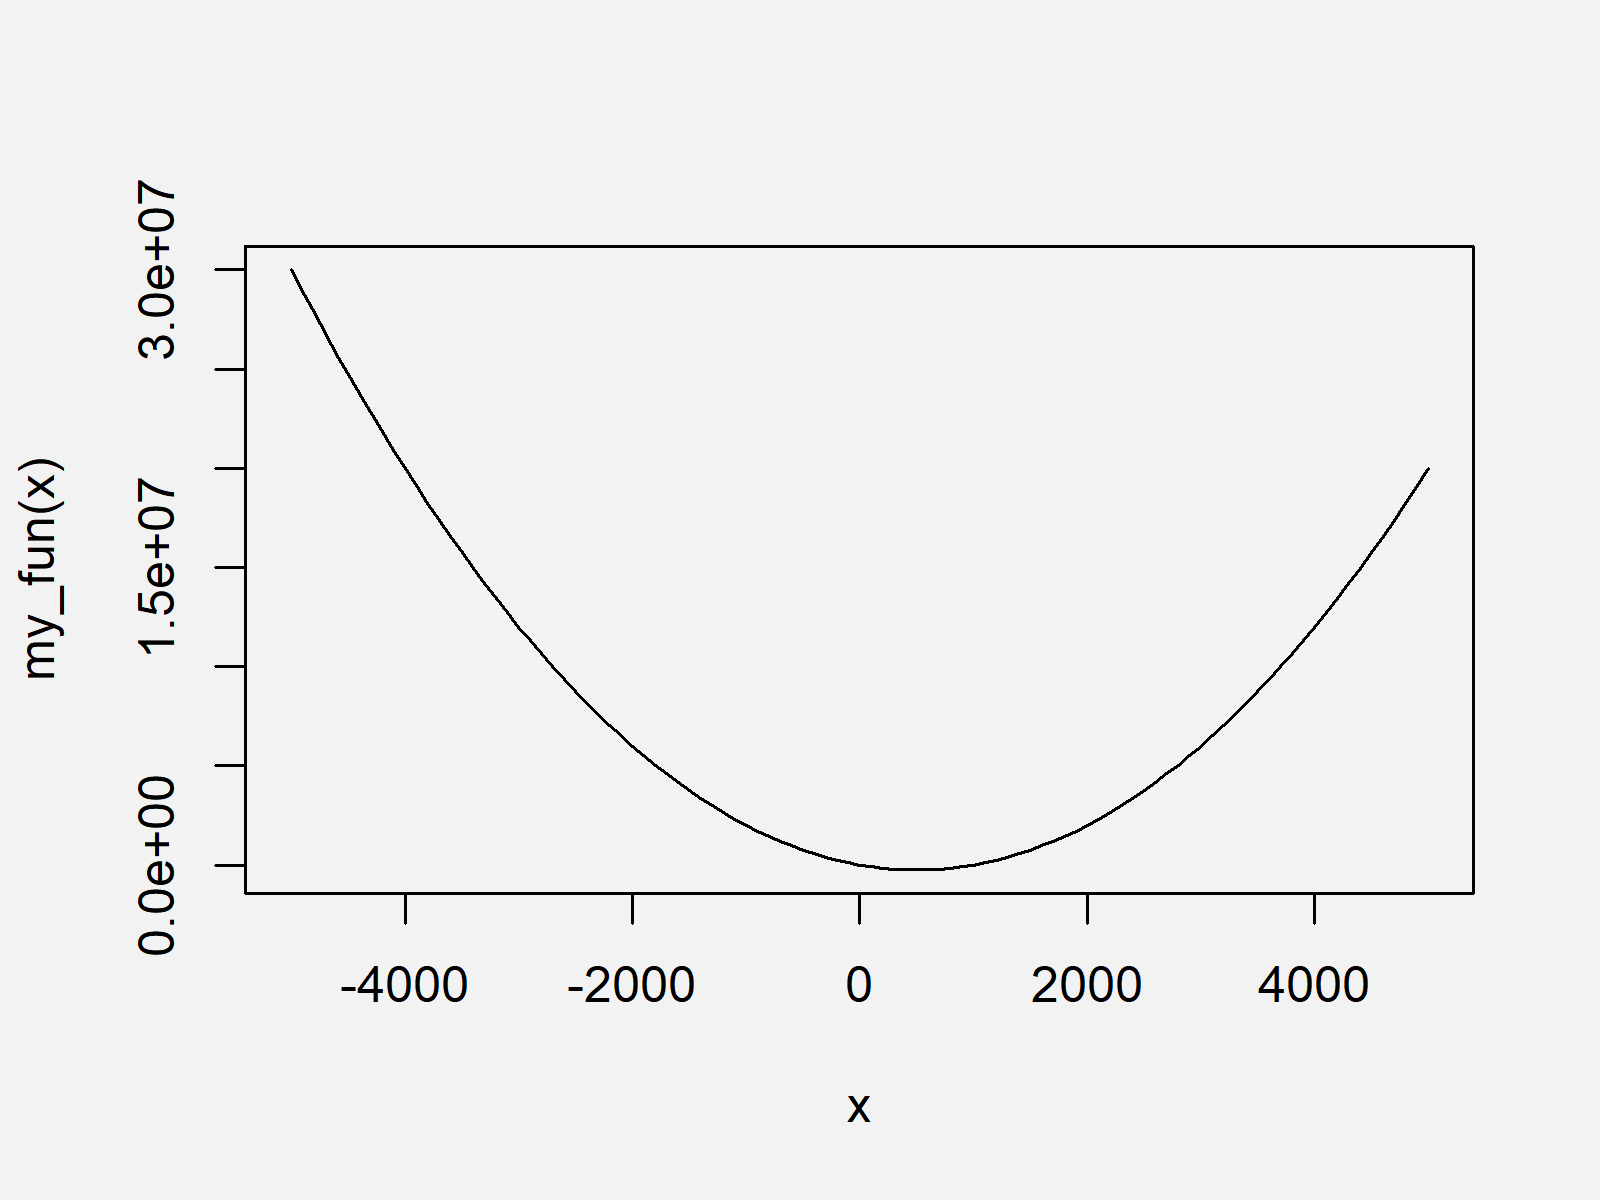
curve(my_fun, from = - 5000, to = 5000) # Apply curve

As you can see in Figure 1, we created a graphic showing our function with the previous R programming code.
Example 2: Plotting Function Curve Using ggplot2 Package
Example 2 explains how to use the commands of the ggplot2 package to create a function plot. We first have to install and load the ggplot2 package:
install.packages("ggplot2")                    # Install & load ggplot2 package
library("ggplot2")
Furthermore, we have to create a data frame containing the range of input values between which we want to draw our function:
data_fun <- data.frame(x = c(- 5000, 5000)) # Create data frame containing range
Now, we can use the stat_function command of the ggplot2 package to draw our function:
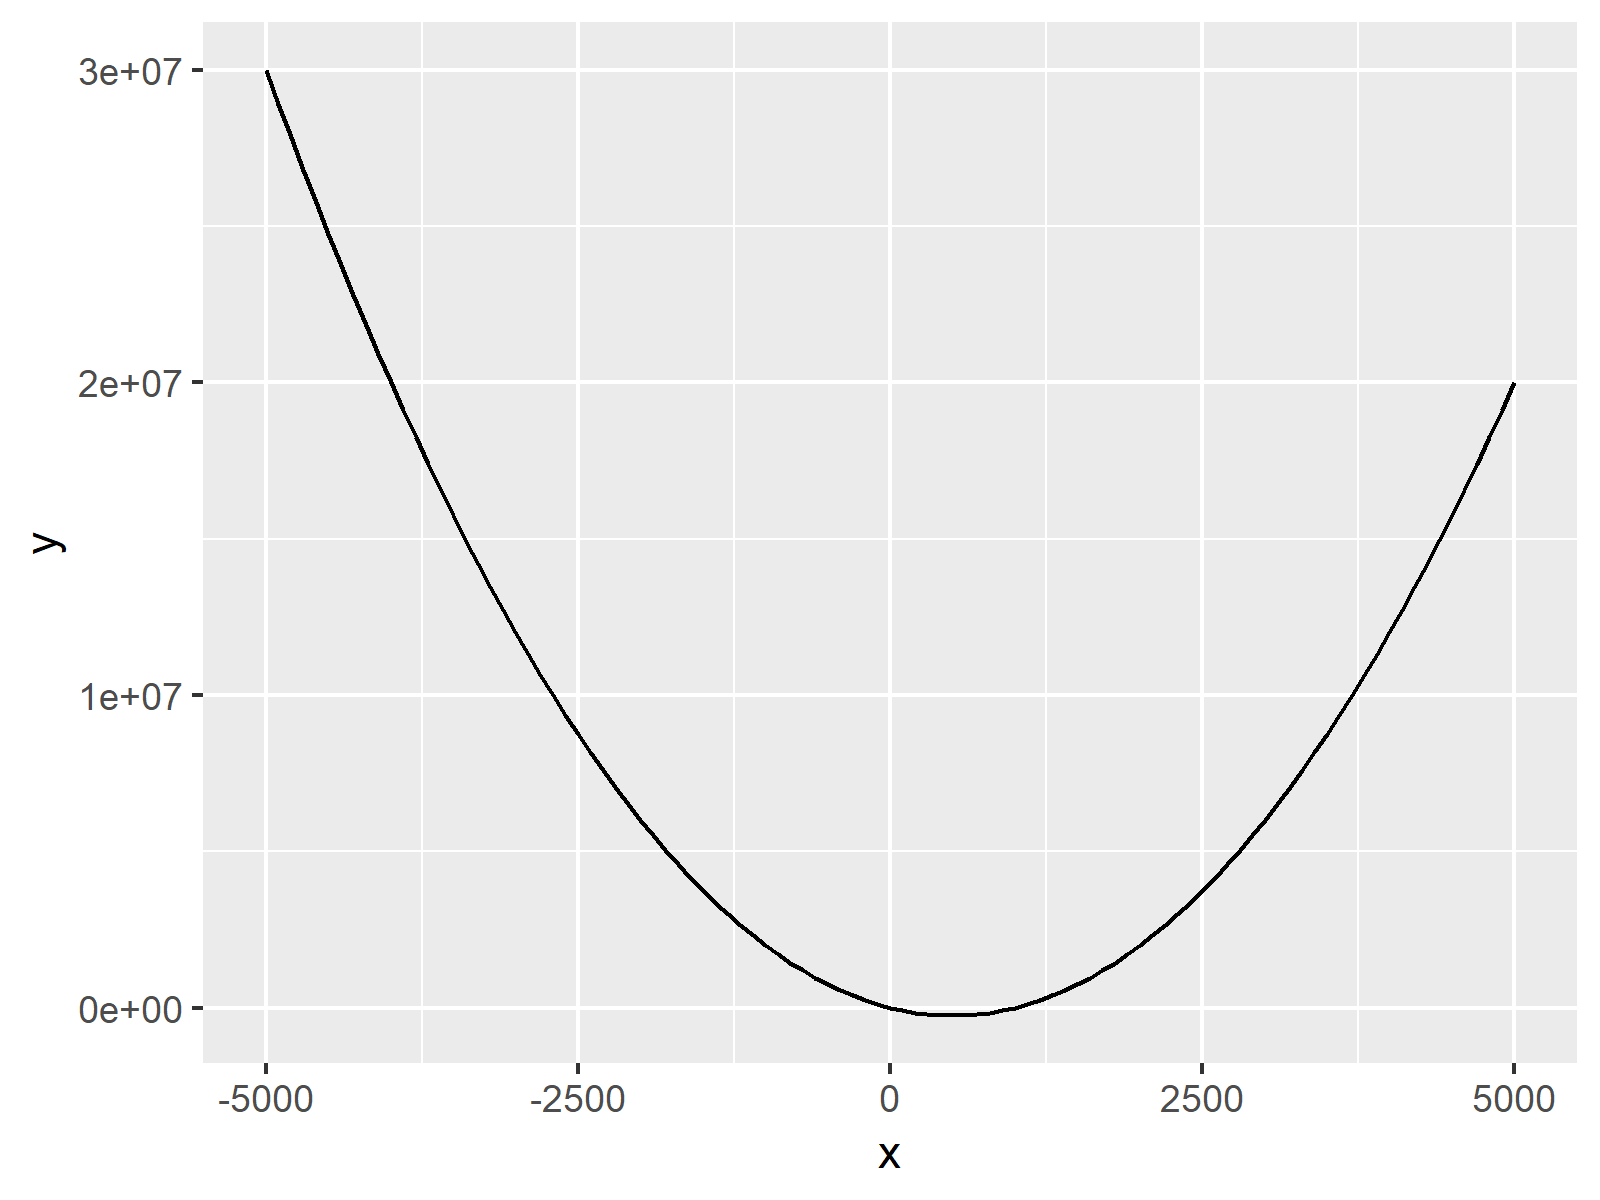
ggplot(data_fun, aes(x)) +                     # Draw ggplot2 plot
  stat_function(fun = my_fun)

You can see the resulting graph in Figure 2. As you can see, it’s the same function as in Example 1, but this time in a different layout (which is prettier, if you ask me).
Video, Further Resources & Summary
I have recently released a video on my YouTube channel, which illustrates the contents of this article. You can find the video below:
In addition, you may want to have a look at some of the related R tutorials of Statistics Globe.
In summary: At this point you should have learned how to draw a manually specified function in the R programming language. Tell me about it in the comments, if you have further questions.


