Add Image to Plot in R (Example) | Draw Picture on Top of Graph Using ggplot2 & patchwork Packages
In this tutorial, I’ll show how to add a picture on top of a ggplot2 plot in the R programming language.
The article consists of this content:
Let’s get started.
Example Data, Add-On Packages & Default Graphic
First, let’s create some example data in R:
data <- data.frame(x = 1:6,         # Creating example data
                   y = 10:5)
data                                # Printing example data
#   x  y
# 1 1 10
# 2 2  9
# 3 3  8
# 4 4  7
# 5 5  6
# 6 6  5
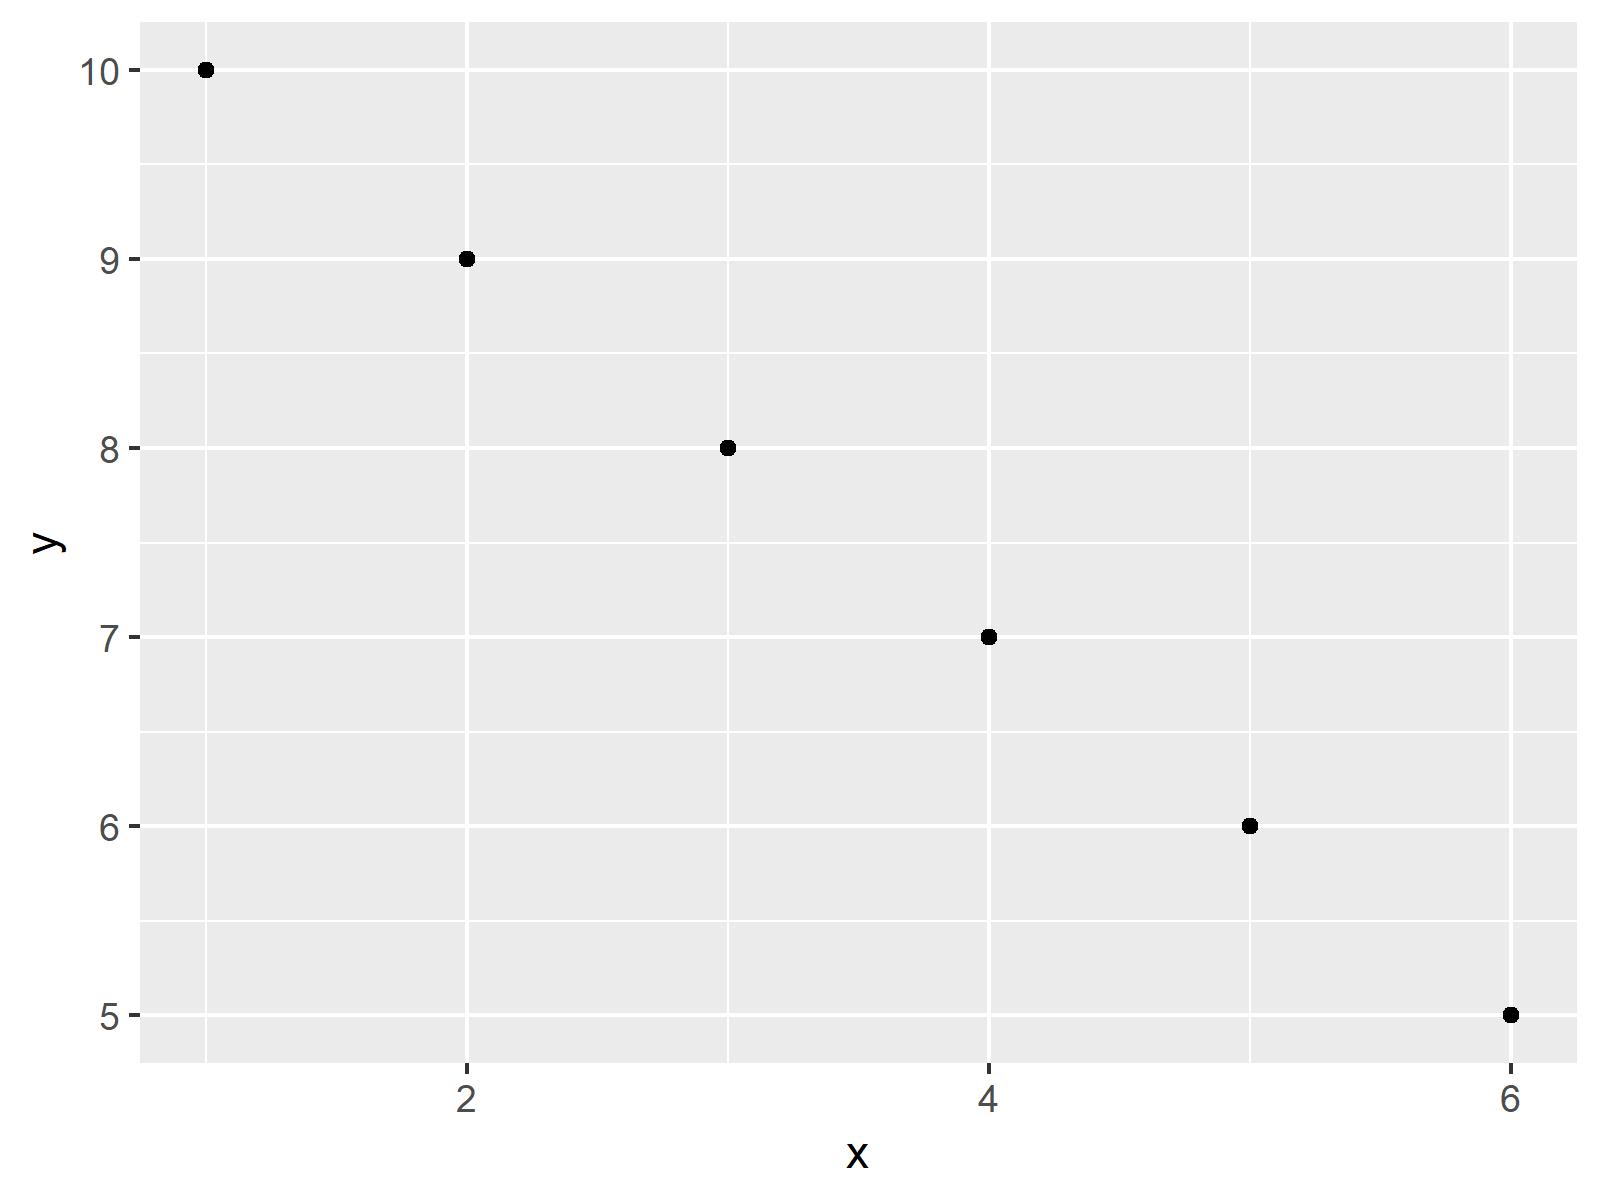
Have a look at the previous output of the RStudio console. It shows that our example data has six rows and two numeric columns x and y.
We need to install and load the ggplot2 package, if we want to use the functions that are contained in the package:
install.packages("ggplot2")         # Install ggplot2 package
library("ggplot2")                  # Load ggplot2 package
Next, we can draw our data in a basic ggplot2 without an image:
ggp <- ggplot(data, aes(x, y)) +    # Create ggplot2 plot
  geom_point()
ggp                                 # Draw ggplot2 plot

Figure 1 shows the output of the previous syntax – A ggplot2 scatterplot with default specifications and without showing an image on top.
Let’s add an image…
Example: Add Image to Plot Using inset_element() Function of patchwork Package
In this example, I’ll show how to draw a ggplot2 plot with an image on top.
We first need to load an image to R using the png package. For this, we have to install and load the png package first:
install.packages("png")             # Install png package
library("png")                      # Load png package
Now, we can use the readPNG function to load an image that we have stored on our computer:
my_image <- readPNG("C:/Users/Joach/Desktop/r-logo.png", native = TRUE)
If we want to add this image on top of our ggplot2 plot, we have to install and load the patchwork package as well:
install.packages("patchwork")       # Install patchwork package
library("patchwork")                # Load patchwork
Now, we can use the inset_element function to add our picture to our ggplot2 graphic:
ggp_image <- ggp +                  # Combine plot & image
  inset_element(p = my_image,
                left = 0.5,
                bottom = 0.55,
                right = 0.95,
                top = 0.95)
ggp_image                           # Draw combined plot

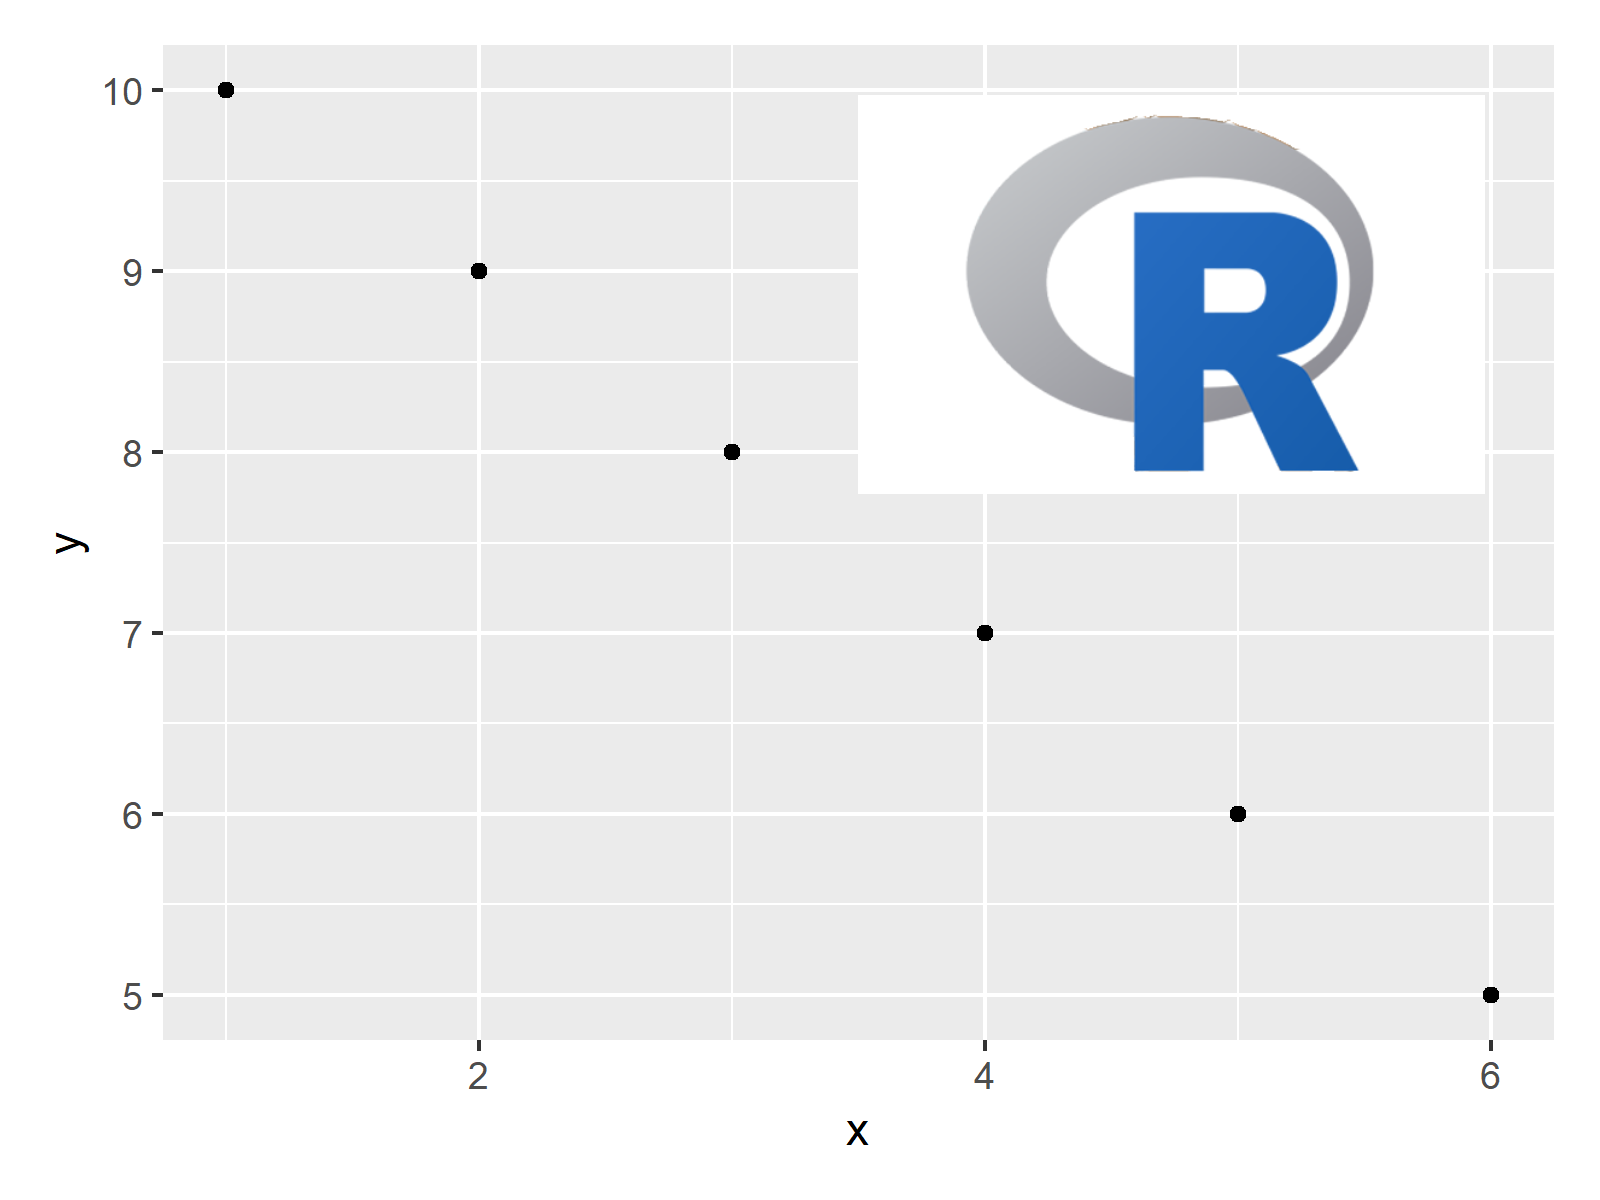
The output of the previous R syntax is shown in Figure 2: A ggplot2 plot and an image on top.
Video & Further Resources
Do you need further information on the R syntax of this post? Then I can recommend to watch the following video of my YouTube channel. I show the R programming codes of this article in the video.
Furthermore, you may have a look at the other articles which I have published on my website. You can find some articles below:
- Draw Composition of Plots Using the patchwork Package
- Add Text to Plot Using text() Function in Base R
- Add Color Between Two Points of Kernel Density Plot
- Add Greek Symbols to ggplot2 Plot
- Add Subscript and Superscript to Plot
- patchwork Package in R
- Creating Plots in R
- Introduction to R Programming
In summary: In this tutorial you learned how to insert and combine plots and images in the same graph in the R programming language. In case you have additional questions, please let me know in the comments below.


2 Comments. Leave new
Hi Joachim,
Have been following your posts on Twitter for a while now. They are great and really helpful!
Based on this “Add Image to Plot in R”, I was wondering whether it would also be possible to plot another ggplot-graph (as an inset or something, or perhaps a zoom-in of the bigger plot, just brainstorming here…) on top of a larger ggplot, not as a png, but as a modifiable ggplot…
Does patchwork allow that too?
regards,
Koen
Hello Koen,
Yes, it is indeed possible to add another ggplot as an inset to a larger ggplot, and the patchwork package makes this process much simpler. You can create two separate ggplot objects and then add them together using the patchwork syntax. Here’s a simple example:
If you want to create a zoom-in of a specific part of the larger plot, you might need to create a second plot that focuses on that specific area. See the following.
I hope you find the solutions helpful. Also, thank you for your nice feedback!
Regards,
Cansu