Annotate Text Outside of ggplot2 Plot in R (Example)
In this tutorial, I’ll explain how to add text outside of the plot area of a ggplot2 graph in R.
The tutorial looks as follows:
Here’s the step-by-step process…
Example Data, Packages & Basic Graphic
We use the following data as basement for this R programming tutorial:
data <- data.frame(x = 1:5,                          # Example data frame
                   y = 1:5)
data                                                 # Inspect data frame
#   x y
# 1 1 1
# 2 2 2
# 3 3 3
# 4 4 4
# 5 5 5
The previous output of the RStudio console shows that our example data contains two simple numeric variables.
We also need to install and load the ggplot2 package, if we want to use the functions that are included in the package:
install.packages("ggplot2")                          # Install ggplot2 package
library("ggplot2")                                   # Load ggplot2 package
As next step, we can plot our data:
ggp <- ggplot(data, aes(x, y, label = "my text")) +  # Create ggplot2 plot
  geom_point() +
  geom_text(x = 5.5,
            size = 5)
ggp                                                  # Draw ggplot2 plot

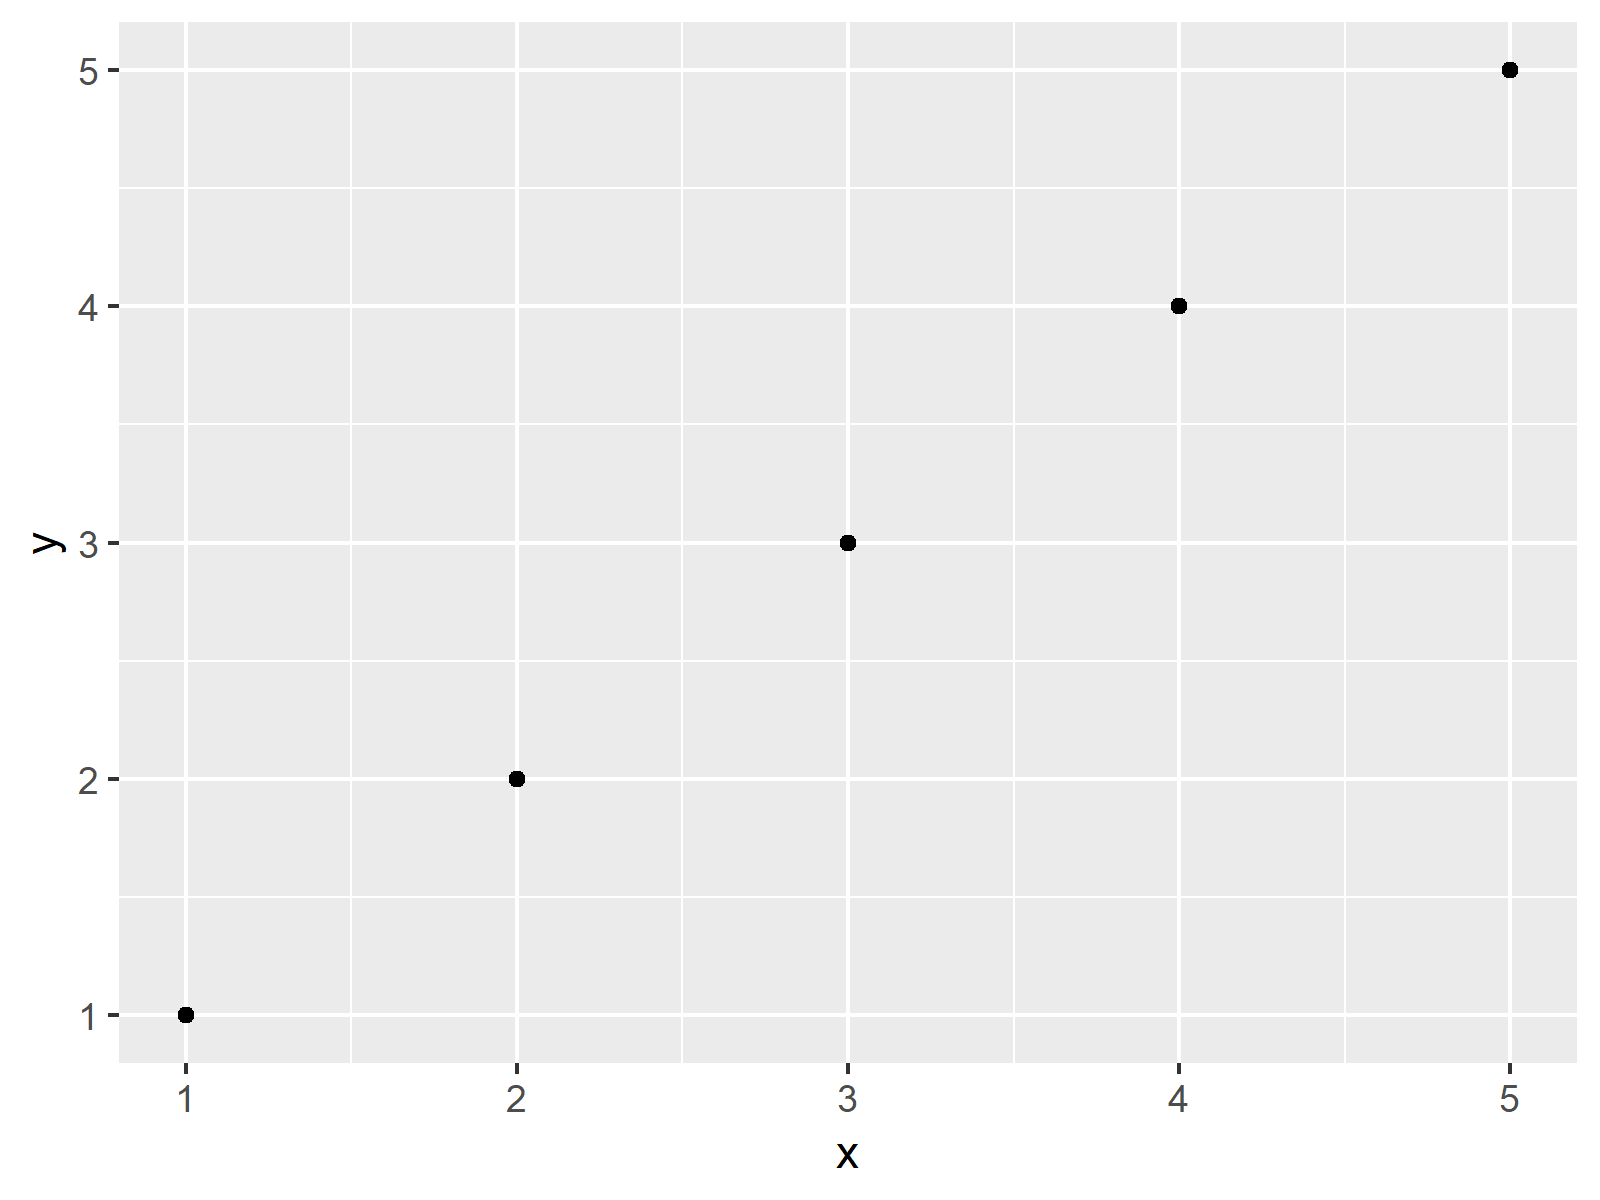
As shown in Figure 1, the previous R programming code created a typical ggplot2 scatterplot. However, you can also see that our text was not annotated to the plot.
Example: Increasing Margins & Allow Text Outside of Plot
In this Example, I’ll explain how to add text elements at the right side of the plot borders using the coord_cartesian function. Have a look at the following R code:
ggp +                                                # Annotate text
  theme(plot.margin = unit(c(1, 5, 1, 1), "lines")) +
  coord_cartesian(clip = "off")

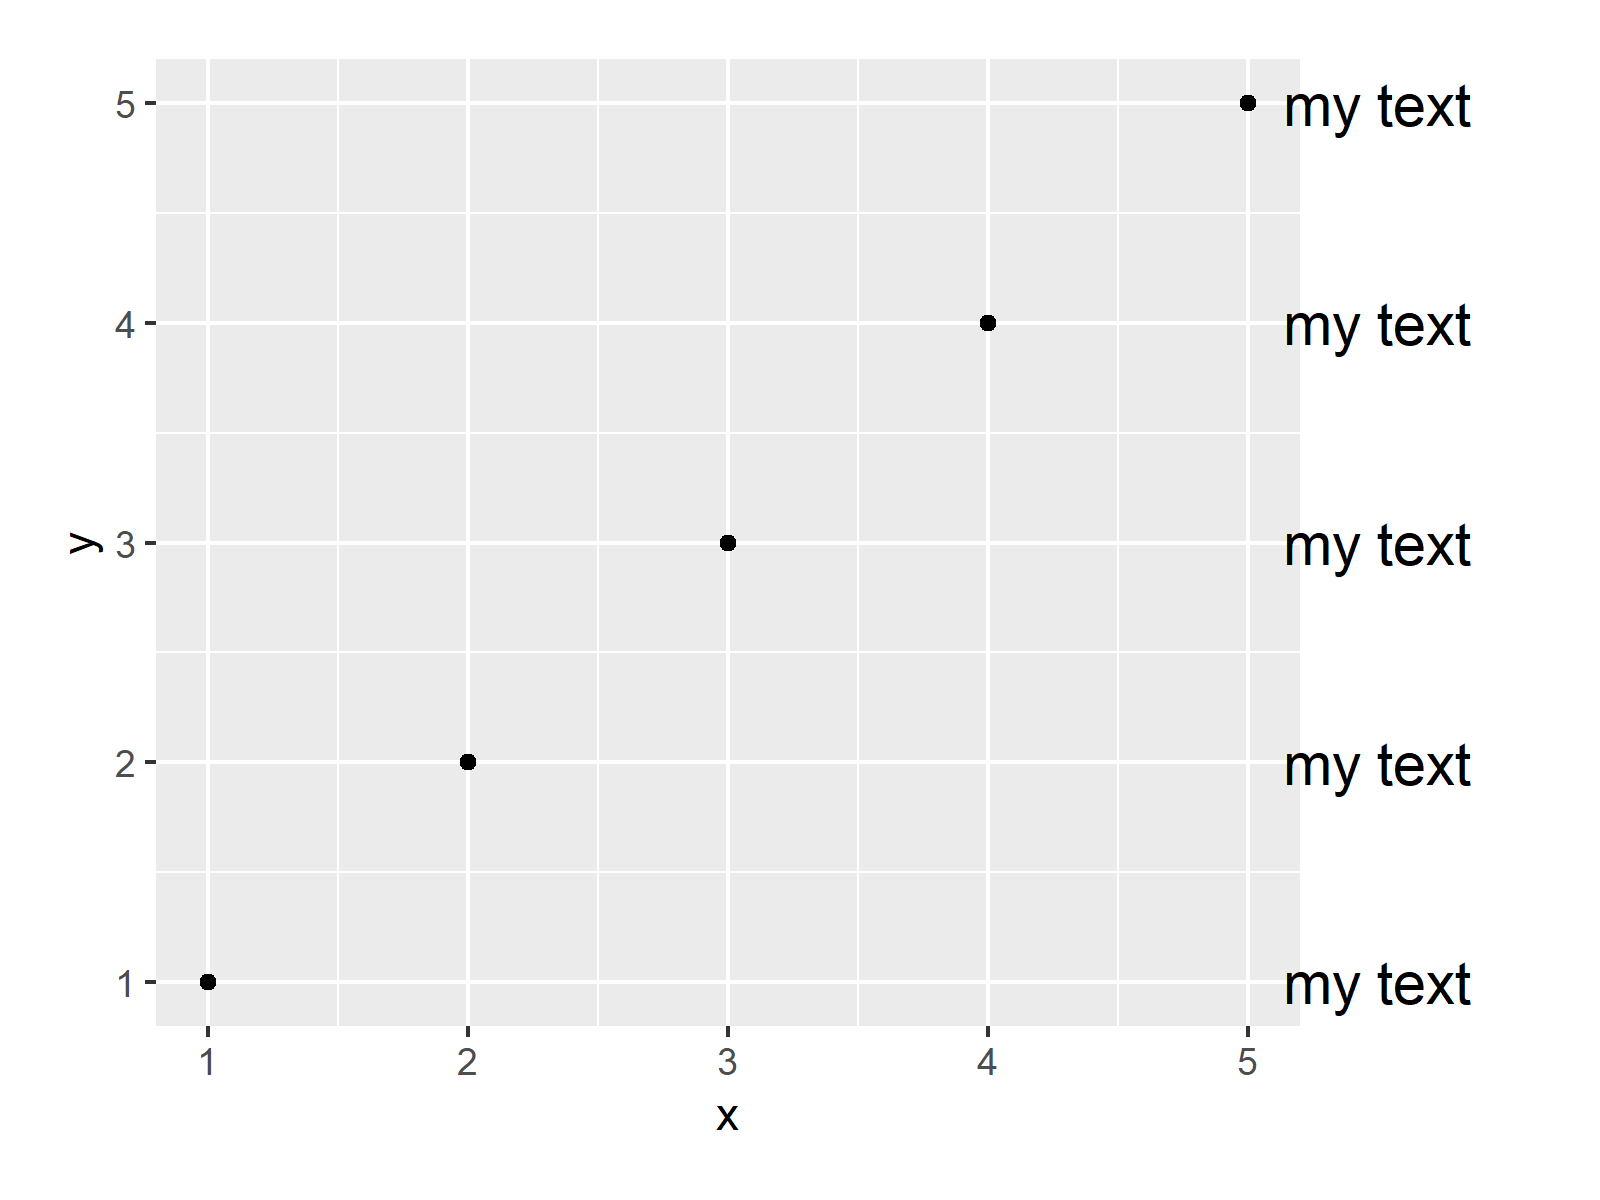
As shown in Figure 2, the previous code created a ggplot2 graph with multiple text elements outside the plotting area.
Video, Further Resources & Summary
If you are interested in data visualization in R and the functions of the ggplot2 package, you have to watch the following video, where I explain the ggplot2 package in much more detail (beginners & advanced users).
Furthermore, you may read the related articles of https://statisticsglobe.com/:
In this R tutorial you learned how to annotate a character string outside of a ggplot2 plot. If you have any further questions, please let me know in the comments section below.


2 Comments. Leave new
Hi Joachim
Thanks for your helpful resource that is really valuable in helping me through my PhD journey!
I can now successfully annotate a (character) string outside a ggplot2 area. However, I would like to annotate it with the sample size, ie. “n = count” where count is the sum of a data frame column.
I have created a variable
count <- sum(df$something)
and used that. How do I add the "n =" element to it?
Hey Vicky,
Thank you so much for the wonderful feedback, glad my tutorials are helpful! 🙂
Regarding your question: For tasks like this, I usually use the paste and paste0 functions. Have a look at the following example code:
I hope that helps!
Joachim