Export Plot to EPS File in R (2 Examples)
In this article you’ll learn how to save a graphic as EPS file in R.
The article will contain the following:
Let’s take a look at some R codes in action:
Example Data & Default Plot
Have a look at the following example data:
data <- data.frame(x = 5:2,        # Create example data
                   y = 4:7)
data                               # Print example data

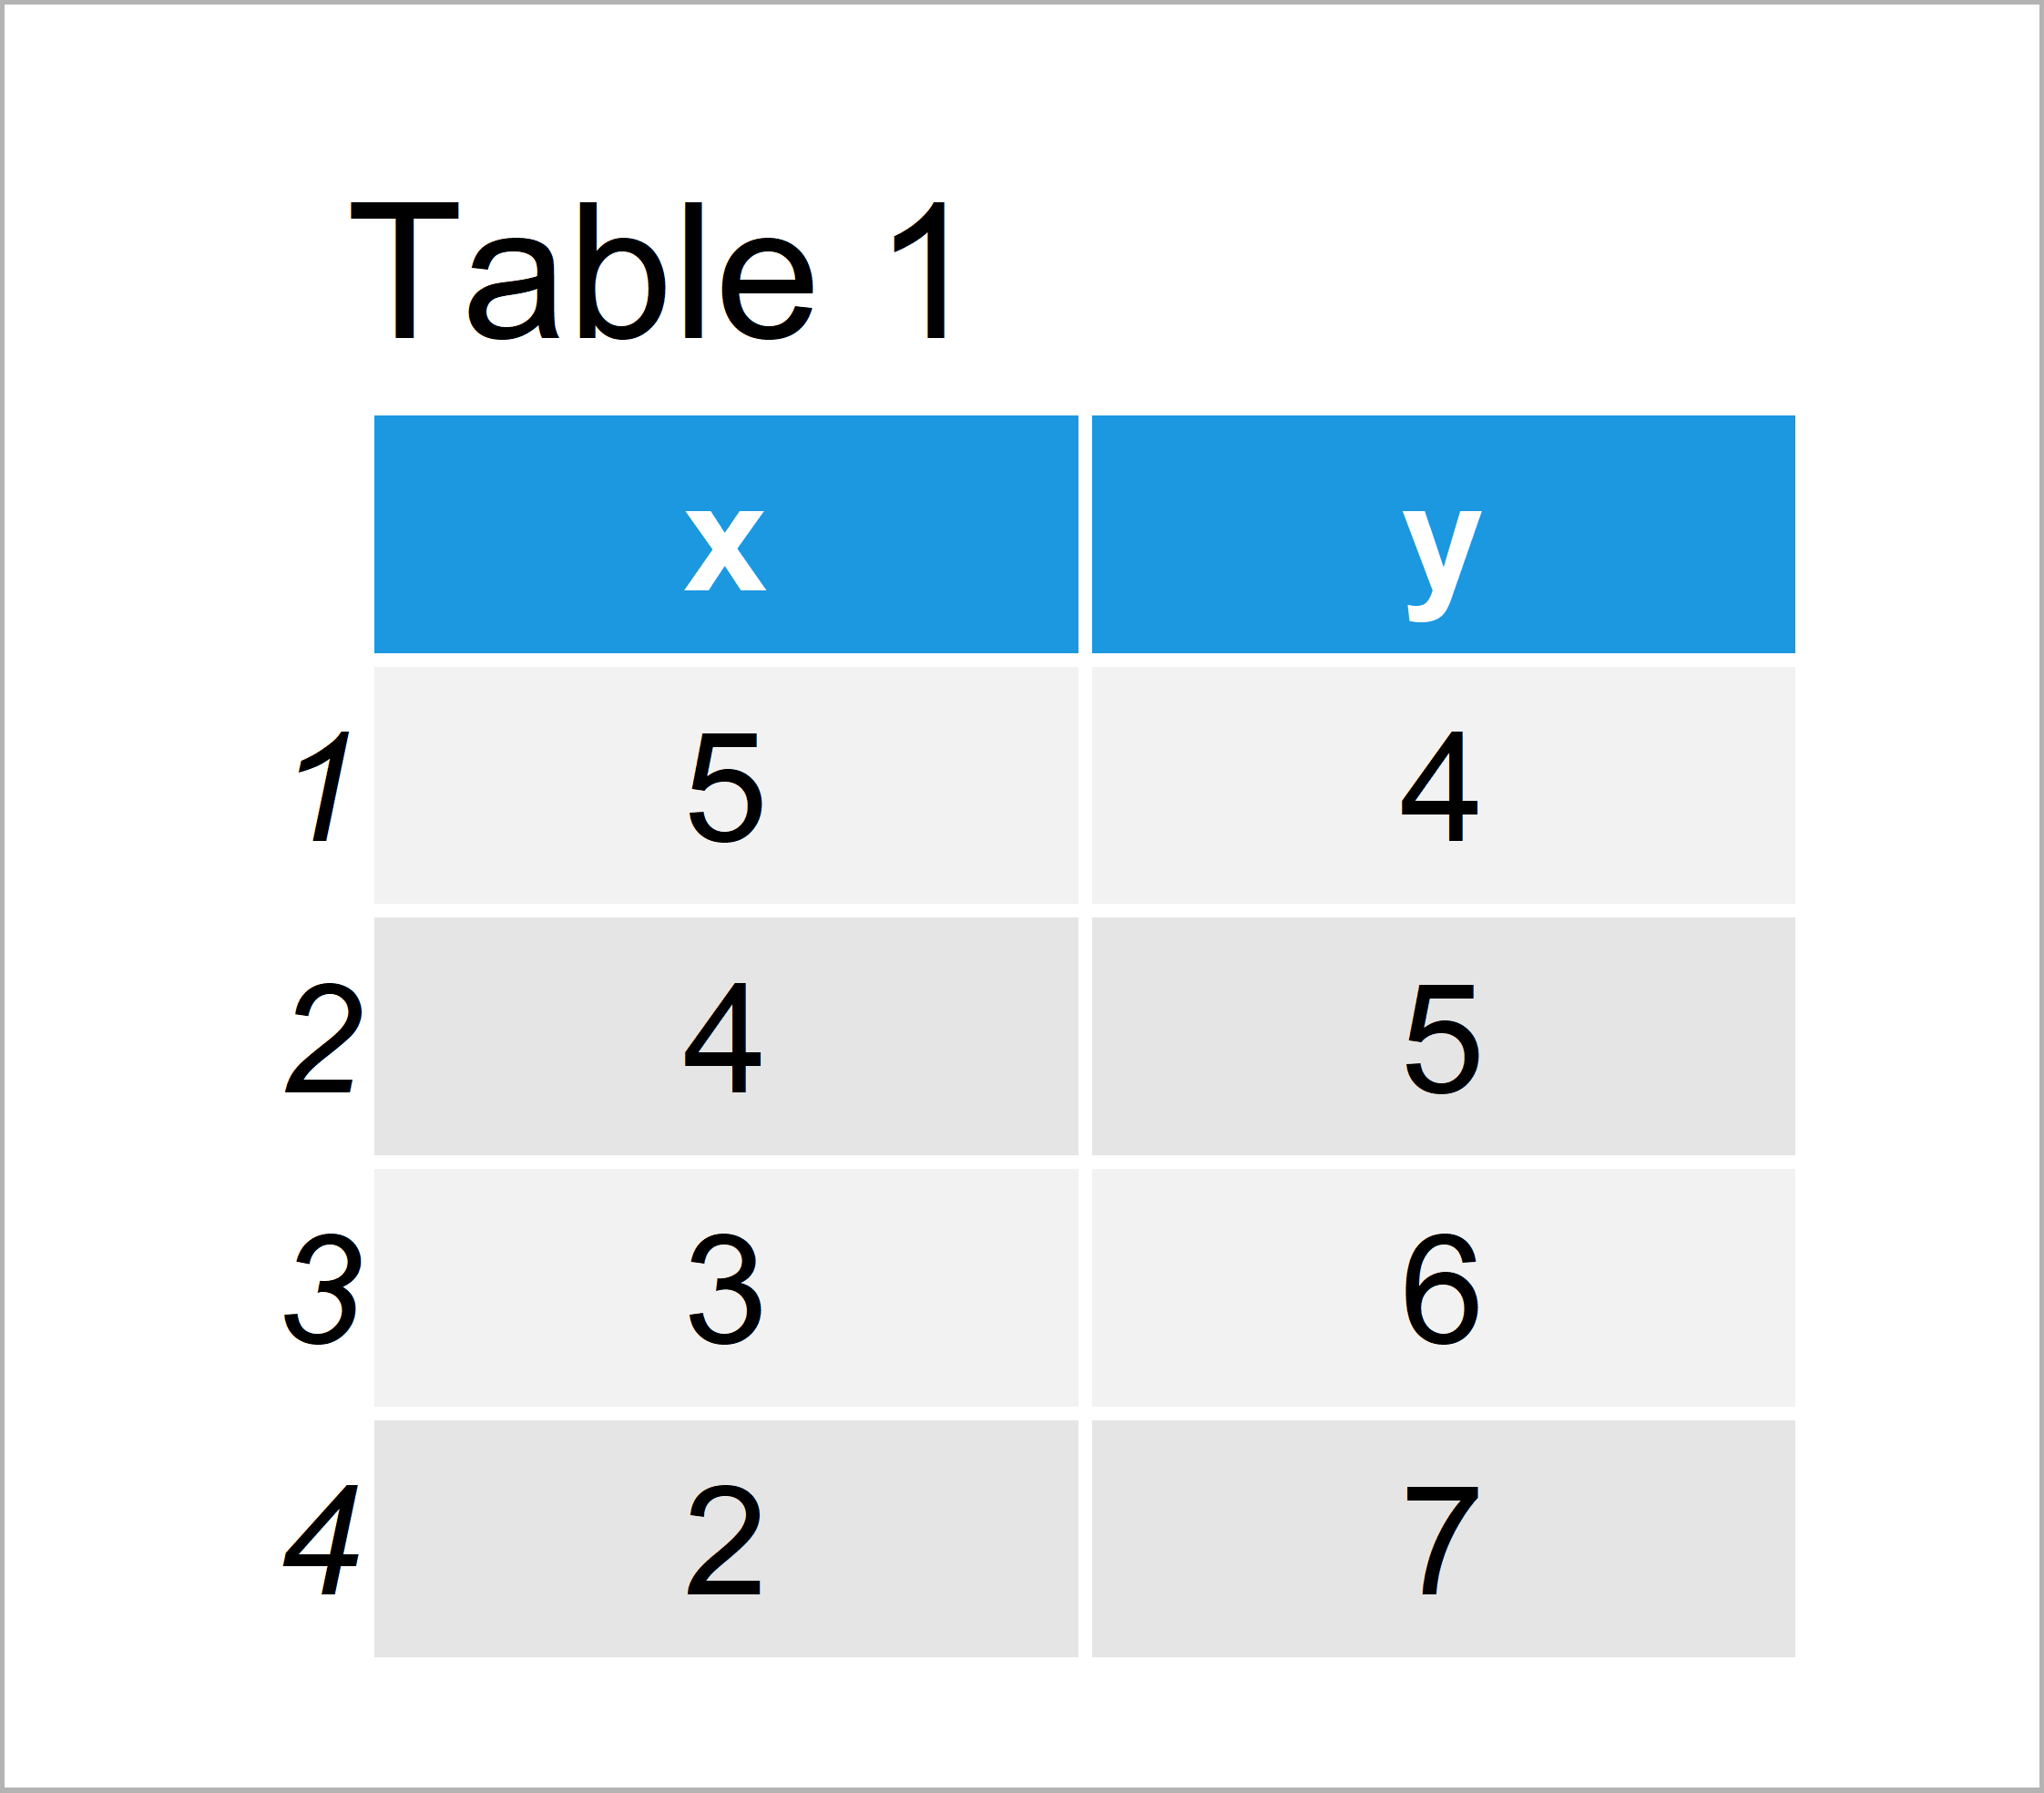
Table 1 shows that our example data is composed of four rows and two columns.
Example 1: Writing Base R Graph to .eps File
In this example, I’ll illustrate how to export a graphics as EPS file using the basic installation of the R programming language.
Have a look at the following R code:
setEPS()                                             # Set postscript arguments
postscript("our_plot.eps")                           # Start graphics device driver
plot(data$x, data$y)                                 # Create plot
dev.off()                                            # Finish export
After executing the previous R syntax, you should find an EPS file in your current working directory on your computer.
Example 2: Writing ggplot2 Graph to .eps File
We can also export ggplot2 plots to EPS files. We first have to install and load the ggplot2 package, if we want to use the functions that are contained in the package:
install.packages("ggplot2")        # Install & load ggplot2 package
library("ggplot2")
Now, we can draw a ggplot2 scatterplot of our data:
ggplot(data, aes(x, y)) +          # Draw ggplot2 plot
  geom_point()

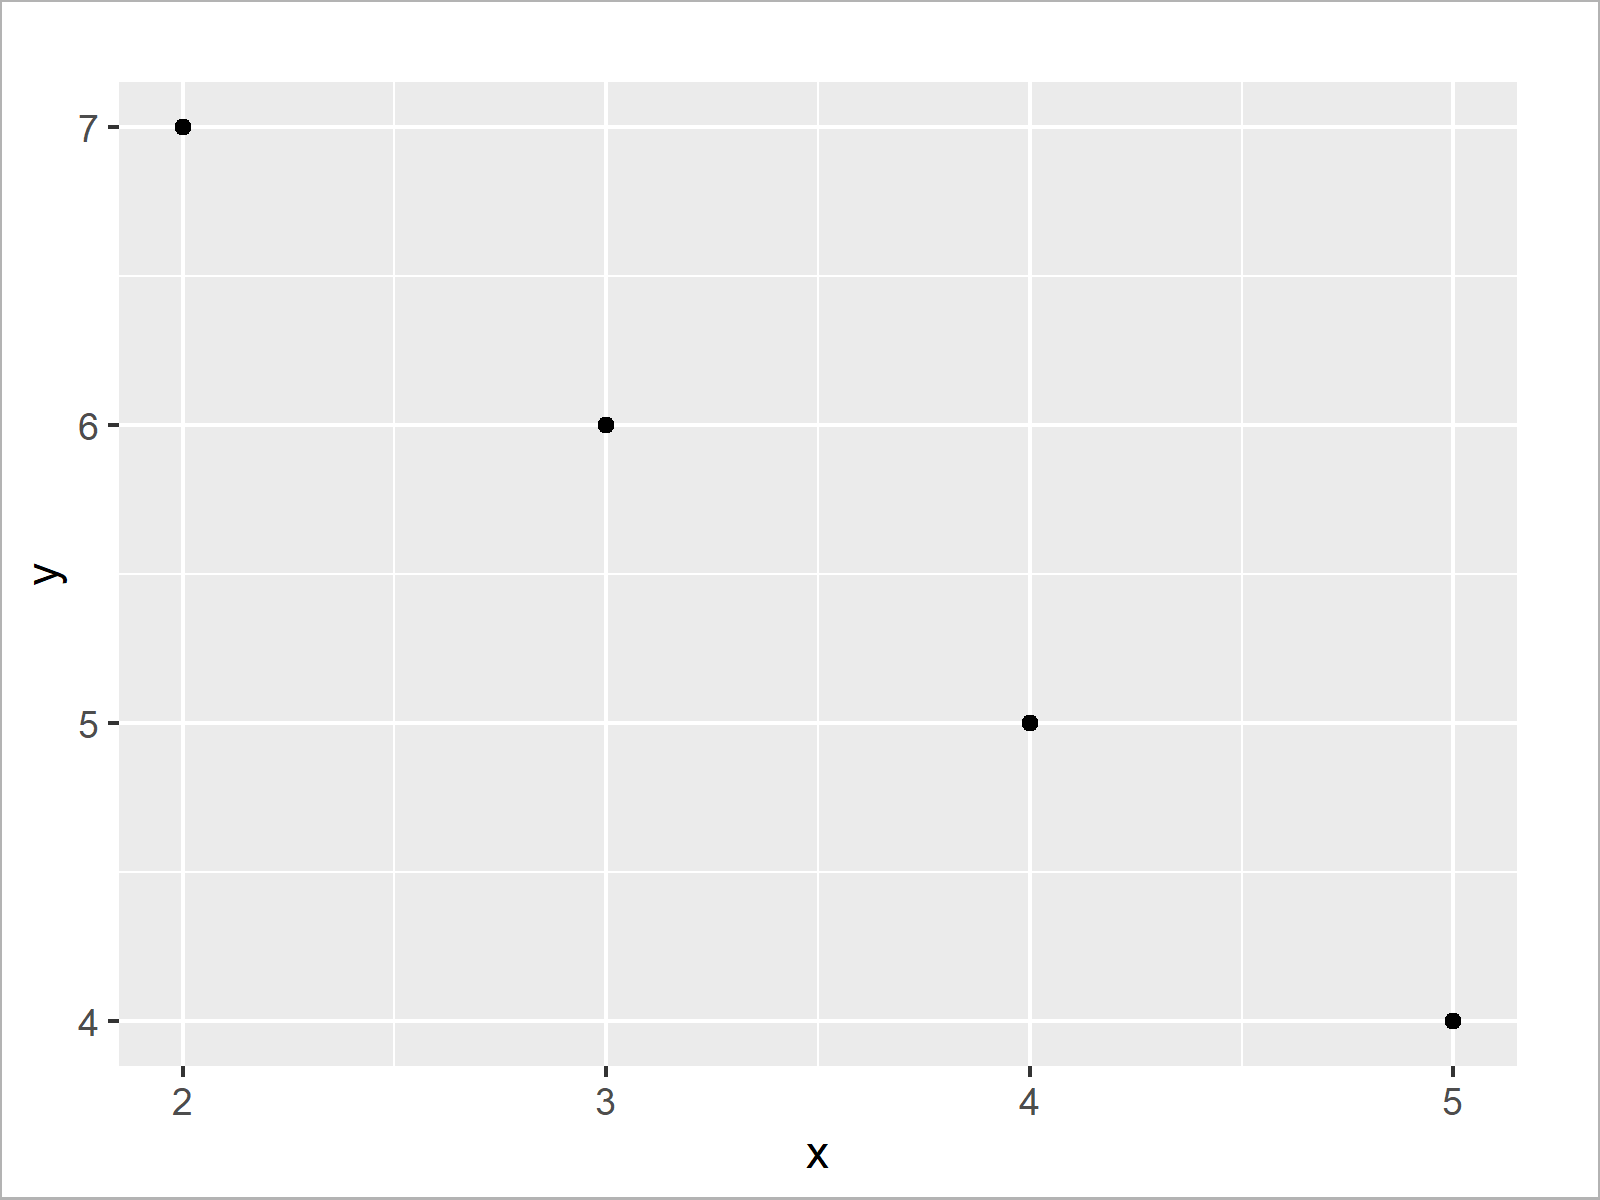
Figure 1 shows the output of the previous R programming syntax: An xy-plot created by the ggplot2 package.
Now, we can print this plot to an EPS file using the ggsave function:
ggsave(file = "our_ggplot.eps") # Export ggplot2 plot
Video, Further Resources & Summary
Some time ago I have published a video on my YouTube channel, which illustrates the R programming syntax of this post. You can find the video below:
The YouTube video will be added soon.
In addition, you may want to read the other tutorials on this homepage:
In this R tutorial you learned how to write EPS files. Let me know in the comments, if you have any additional questions.


