Sort Boxplot by Median in R (4 Examples)
This article demonstrates how to reorder boxplots by median values in R.
The article is structured as follows:
Let’s take a look at some R codes in action…
Creation of Example Data
The first step is to create some data that we can use in the following examples:
set.seed(6358947)                                 # Set seed for reproducibility
data <- data.frame(value = c(rnorm(25, 2),        # Create example data frame
                             rnorm(25, 1),
                             rnorm(25, 4),
                             rnorm(25, 3)),
                   group = rep(LETTERS[1:4],
                               each = 25))
head(data)                                        # Print head of example data frame
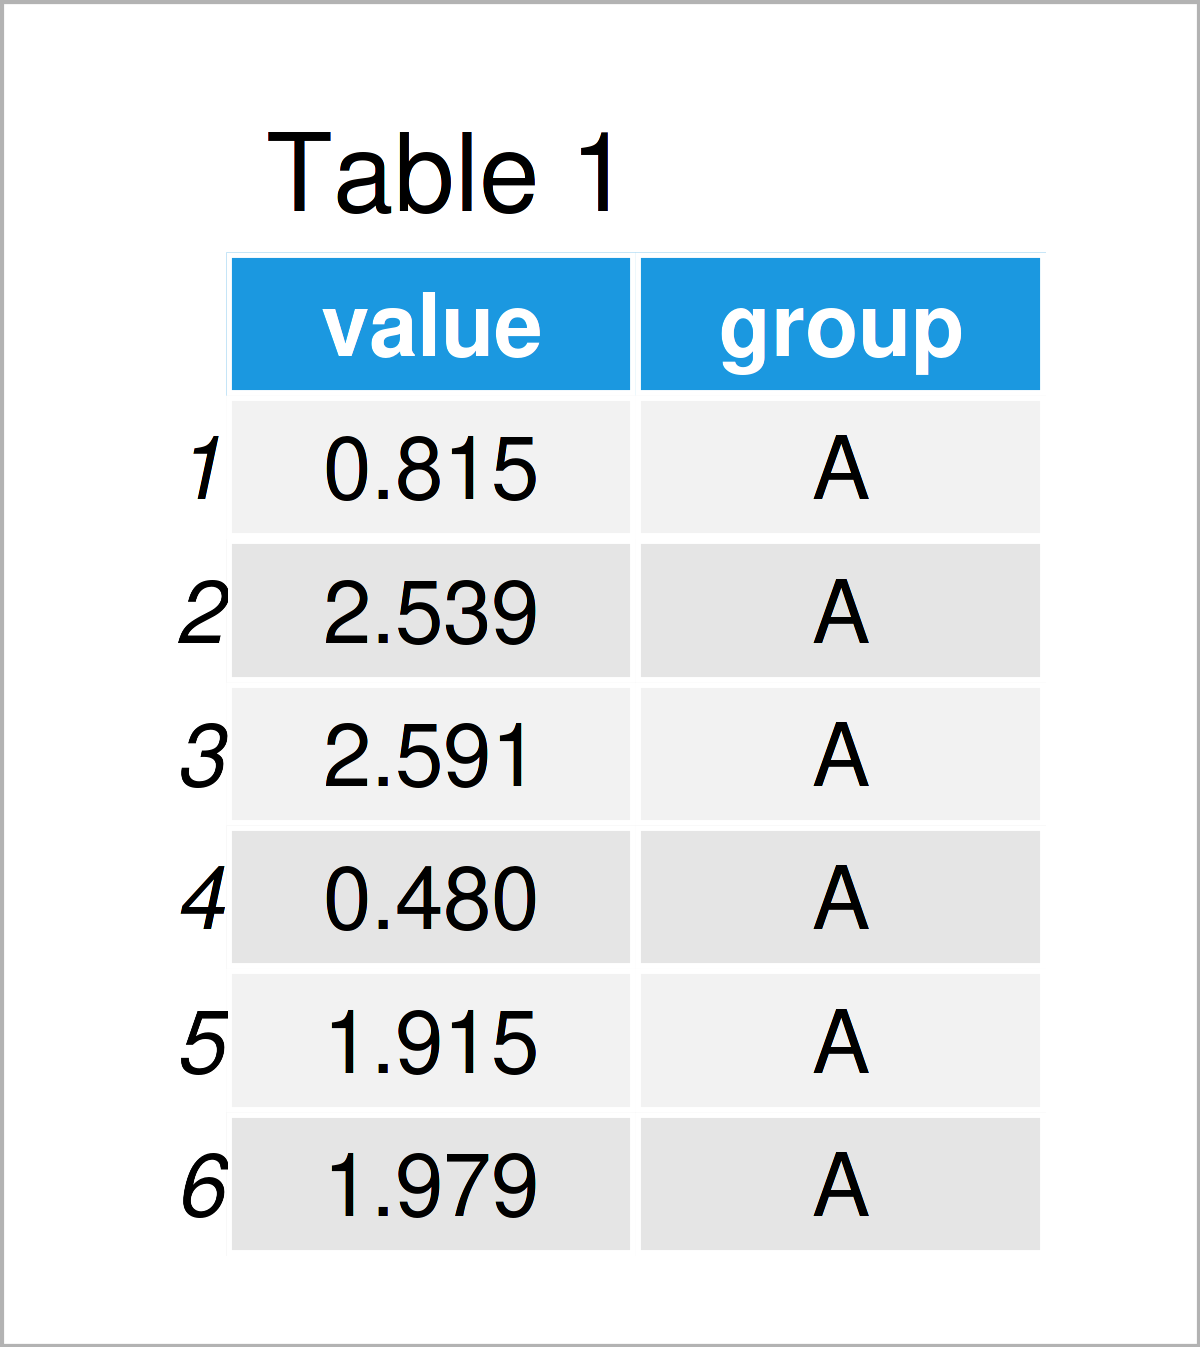
Table 1 reveals the first six rows of our example data – Furthermore, you can see that our data consists of two columns. The variable value has the numeric class and the column group is a character.
Example 1: Reorder Boxplot by Median Using Base R
In Example 1, I’ll illustrate how to sort the boxes in a Base R boxplot by median.
Let’s first draw a boxplot with the default ordering:
boxplot(value ~ group,                            # Draw Base R boxplot with default order
        data)
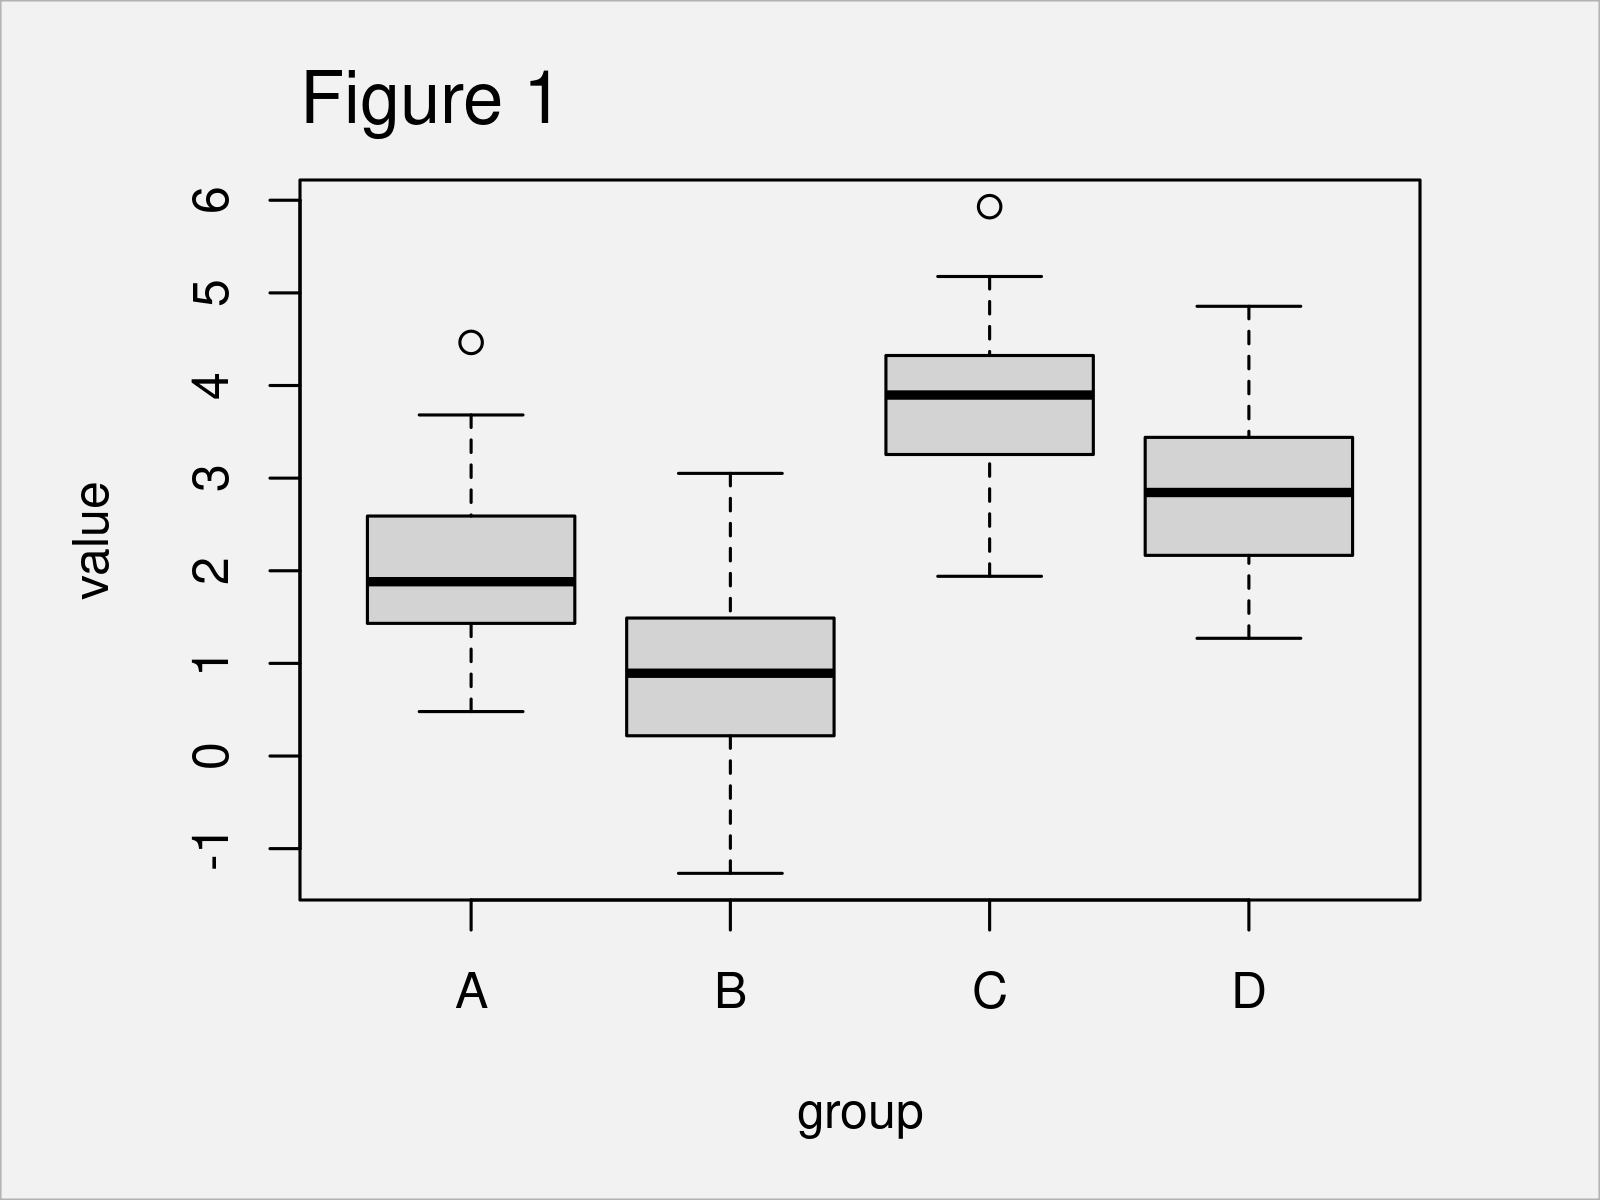
By executing the previous R programming syntax, we have plotted Figure 1, i.e. a Base R boxplot with default order.
If we want to sort this boxplot by the median values of each box, we first have to calculate the median values and sort our groups accordingly. For this, we can use the with and reorder functions as shown below:
group_ordered <- with(data,                       # Order boxes by median
                      reorder(group,
                              value,
                              median))
group_ordered                                     # Print order
#   [1] A A A A A A A A A A A A A A A A A A A A A A A A A B B B B B B B B B B B B
#  [38] B B B B B B B B B B B B B C C C C C C C C C C C C C C C C C C C C C C C C
#  [75] C D D D D D D D D D D D D D D D D D D D D D D D D D
# attr(,"scores")
#         A         B         C         D
# 1.8817643 0.8936555 3.8970592 2.8447117
# Levels: B A D C
The previous R code has created a new data object called group_ordered that contains information on the median values and the ordering of our groups.
In the next step, we can use this data object to redraw our boxplot:
boxplot(value ~ group_ordered,                    # Draw Base R boxplot ordered by median
        data)
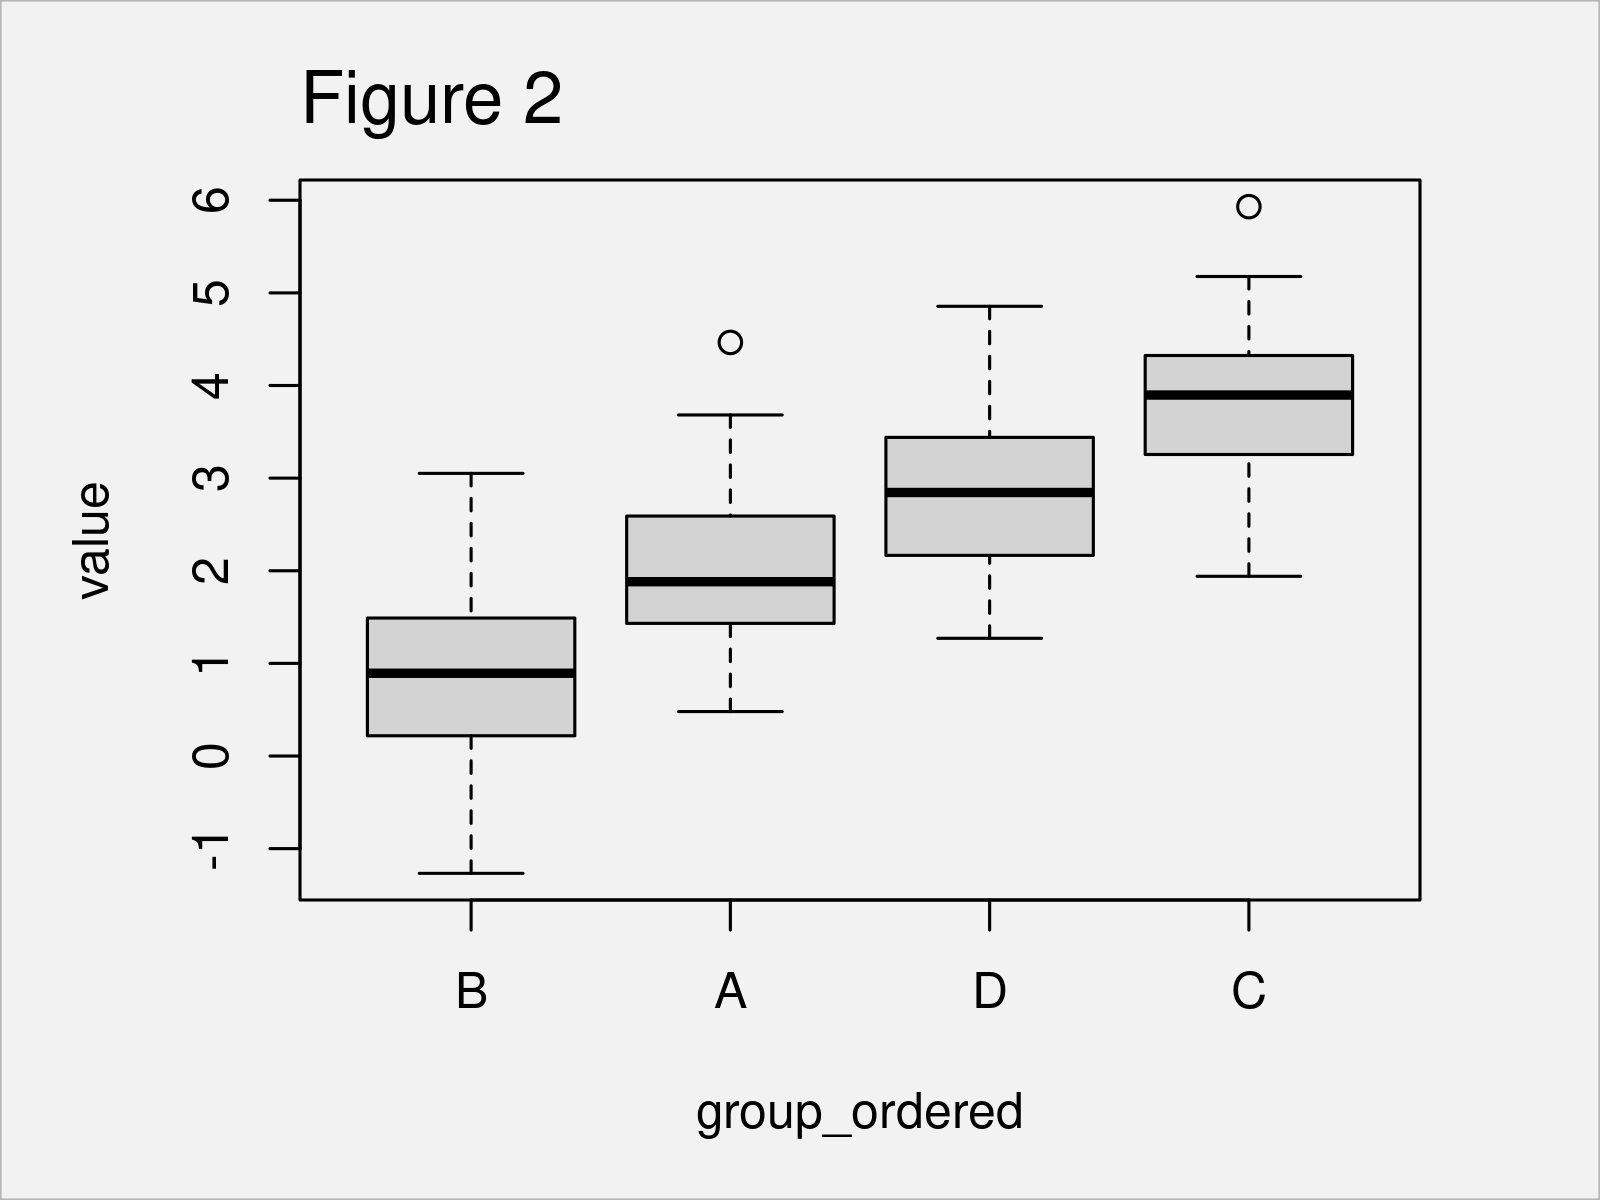
As visualized in Figure 2, the previous R syntax has created a Base R boxplot, which is sorted by median values.
Example 2: Reorder Boxplot by Median Using ggplot2 Package
Example 2 demonstrates how to use the ggplot2 package to draw a sorted boxplot.
First, we have to install and load the ggplot2 package.
install.packages("ggplot2")                       # Install & load ggplot2 package
library("ggplot2")
Next, let’s create a ggplot2 boxplot with default ordering:
ggplot(data,                                      # Draw ggplot2 boxplot with default order
       aes(x = group,
           y = value)) +
  geom_boxplot()
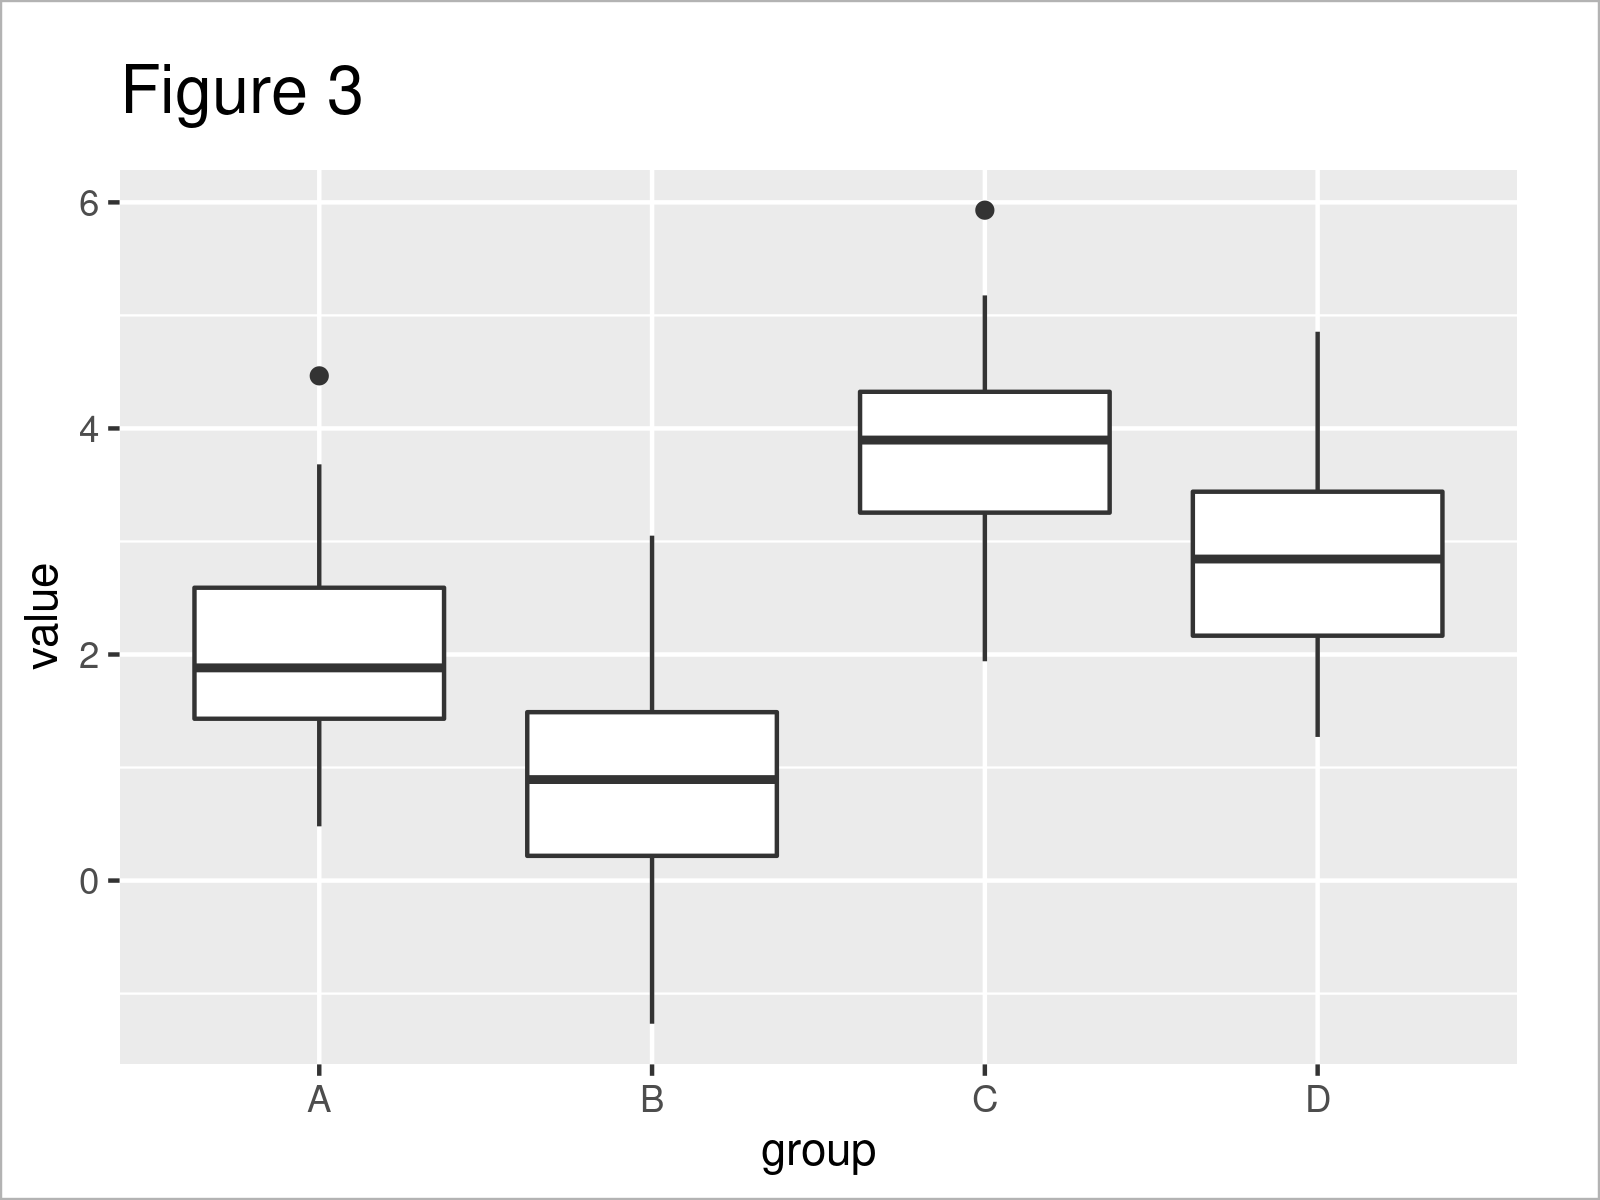
By running the previous R code, we have created Figure 3, i.e. a ggplot2 boxplot that is not sorted yet.
In order to sort our boxes, we first have to convert our group column to a factor with manually specified factor levels. Note that we are using the data object group_ordered, that we have created in Example 1, to specify the ordering of our factor levels:
data_ordered <- data                              # Create data with reordered group levels
data_ordered$group <- factor(data_ordered$group,
                             levels = levels(group_ordered))
The R syntax above has created a new data frame called data_ordered that contains manually defined factor levels.
In the next step, we can use our new data frame to draw a sorted ggplot2 boxplot:
ggplot(data_ordered,                              # Draw ggplot2 boxplot ordered by median
       aes(x = group,
           y = value)) +
  geom_boxplot()
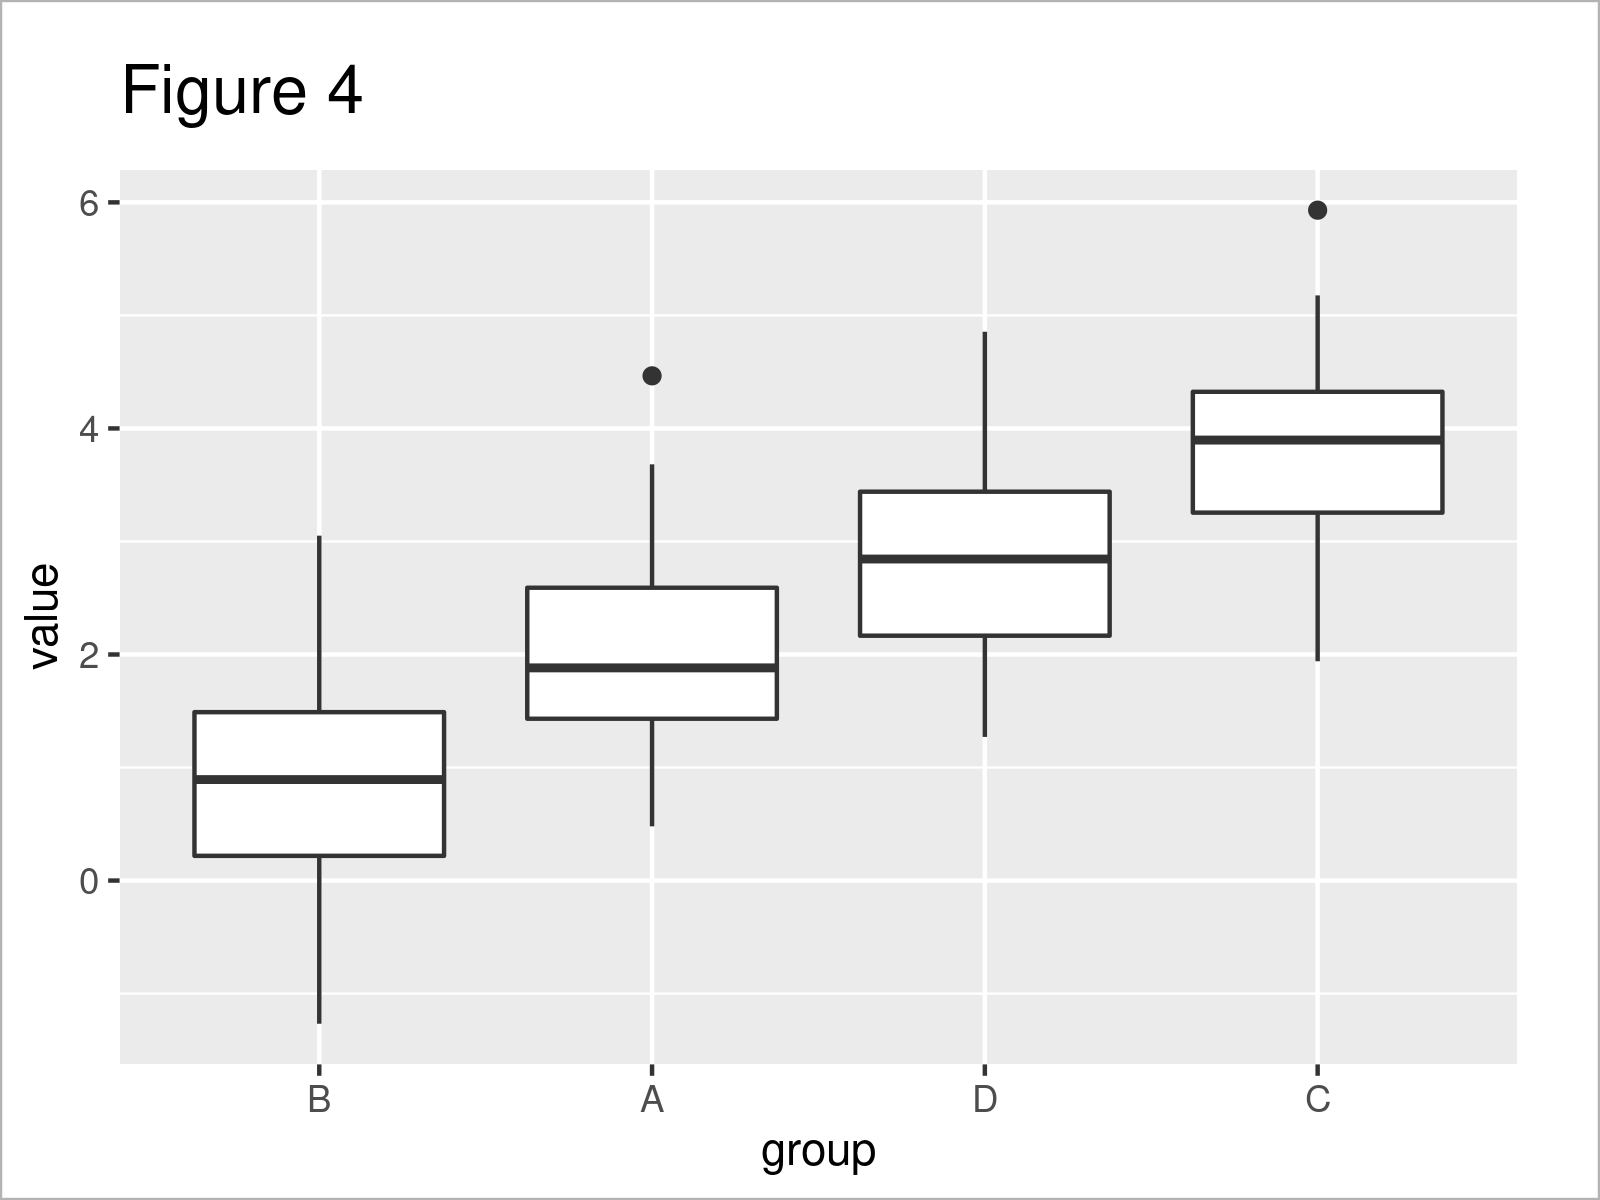
In Figure 4 you can see that we have created a ggplot2 boxplot sorted by the median.
Example 3: Reorder Subgroups of Grouped Boxplot by Median
In the previous examples, we have sorted a boxgraph with four different main groups.
The following code shows how to sort a boxplot with additional subgroups.
For this example, we first have to modify our example data frame:
data_subgroup <- data                             # Create example data frame with subgroups
data_subgroup$subgroup <- letters[1:5]
head(data_subgroup)                               # Print head of example data frame
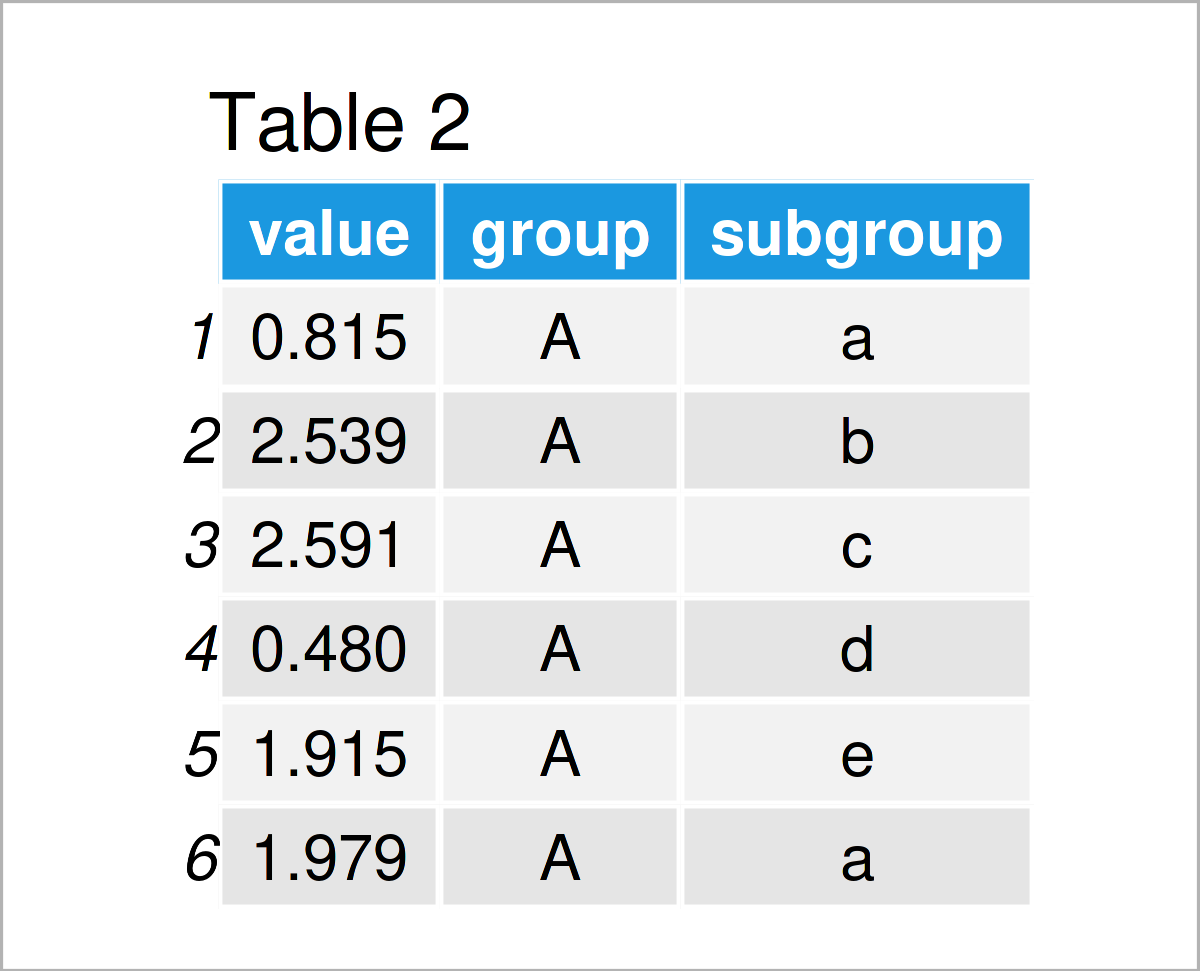
As shown in Table 2, the previous R programming syntax has created a new data frame called data_subgroup that contains an additional subgroup indicator.
In the next step, we can draw these data in a grouped boxplot where each subgroup is shown in a separate box side-by-side:
ggplot(data_subgroup,                             # Draw grouped boxplot with default order
       aes(x = group,
           y = value,
           fill = subgroup)) +
  geom_boxplot()
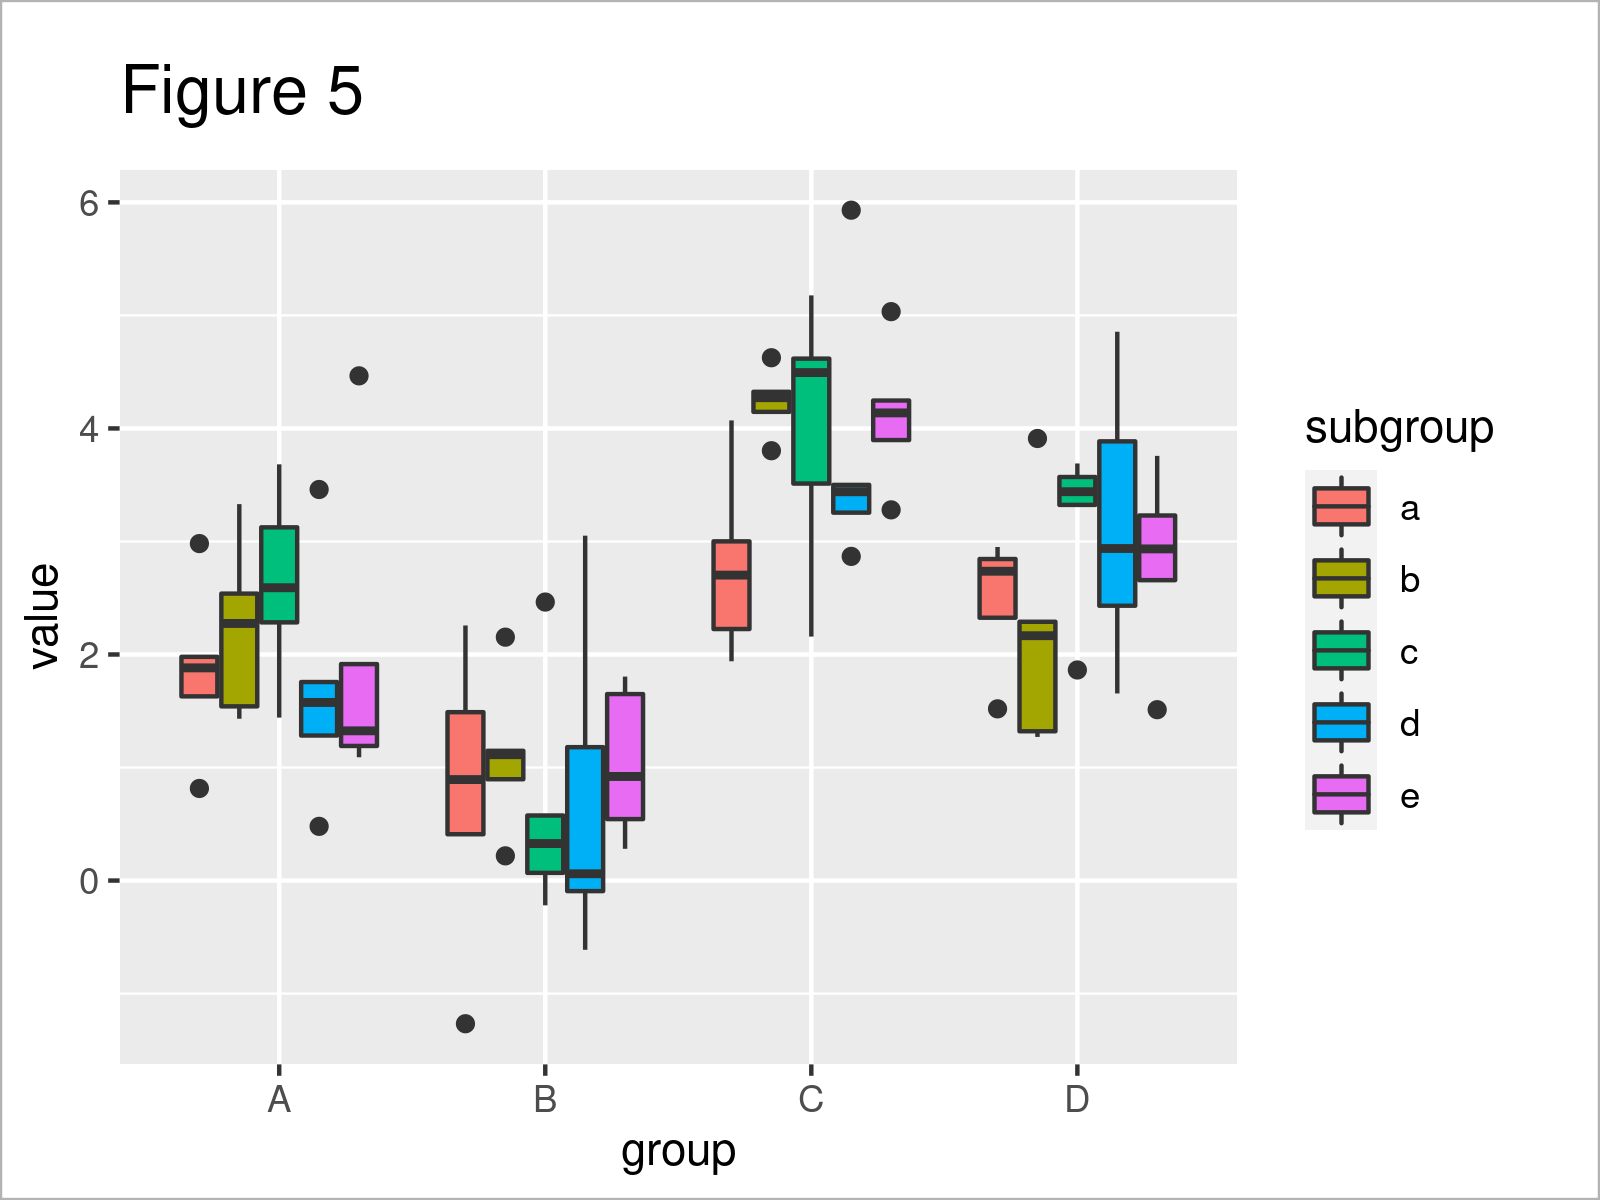
As shown in Figure 5, we have plotted a grouped ggplot2 boxplot with default ordering of the subgroups.
We may now use the reorder function to create a grouped boxplot where the subgroups are ordered separately within each main group.
To accomplish this, we have to assign the reordering to the fill argument, and then we have to draw each cluster of boxes for each main group with a separate call of the geom_boxplot function.
Consider the R code and its output below:
ggplot(data_subgroup,                             # Draw grouped boxplot ordered by median
       aes(x = group,
           y = value,
           fill = reorder(subgroup,
                          value,
                          median))) +
  geom_boxplot(data = data_subgroup[data_subgroup$group == "A", ]) +
  geom_boxplot(data = data_subgroup[data_subgroup$group == "B", ]) +
  geom_boxplot(data = data_subgroup[data_subgroup$group == "C", ]) +
  geom_boxplot(data = data_subgroup[data_subgroup$group == "D", ]) +
  scale_fill_discrete(name = "subgroup", breaks = sort(unique(data_subgroup$subgroup)))
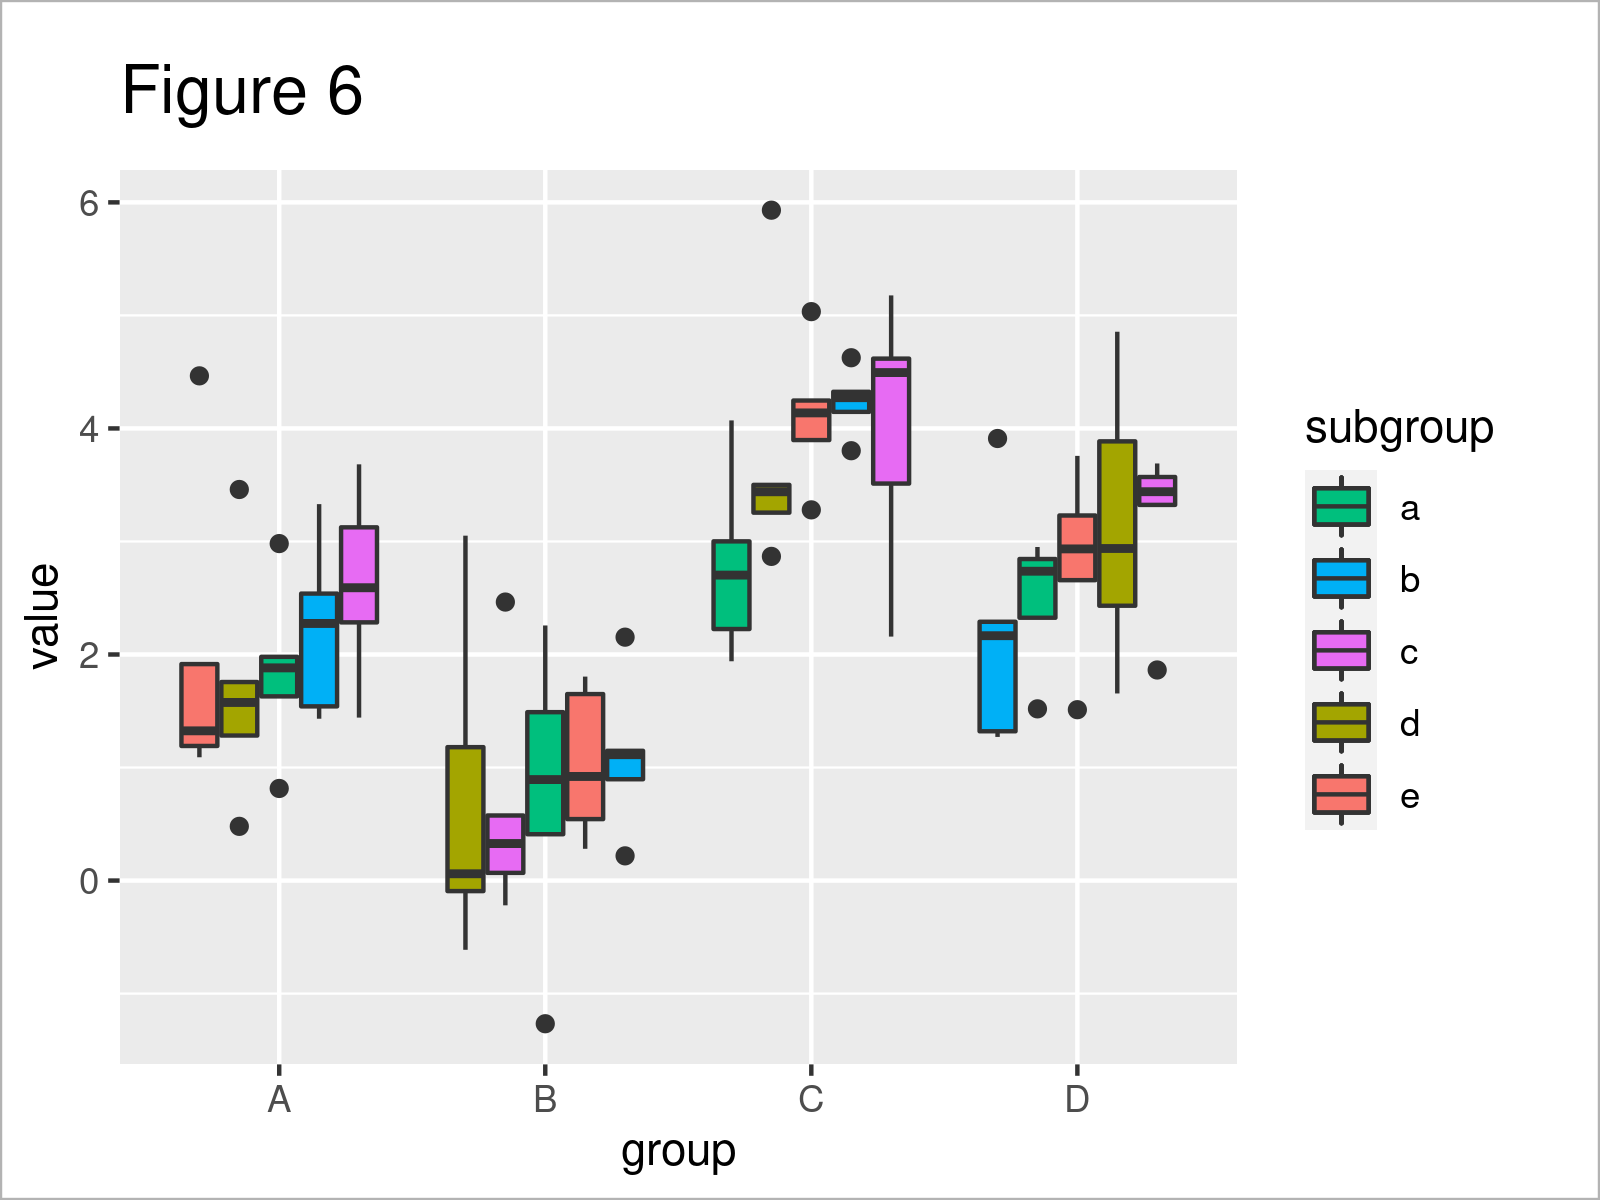
After executing the previous R code the grouped ggplot2 boxplot with sorted subgroup boxes you can see in Figure 6 has been drawn.
Note: The code of this example has been relatively complex. However, I haven’t found any simpler solution yet. Please let me know in the comments, in case you have any ideas on how to simplify this code.
Example 4: Reorder Subgroups of Grouped Barchart by Mean
So far, I have explained how to sort boxplots by the median. However, we can adjust this code to sort barplots as well.
In Example 4, I’ll explain how to draw a grouped barplot where the subgroups are sorted by the mean.
As a first step, we have to use the aggregate function to calculate the mean for each subgroup:
data_aggr <- aggregate(value ~ group + subgroup,  # Calculate mean by subgroup
                       data_subgroup,
                       mean)
data_aggr                                         # Print data frame with mean values
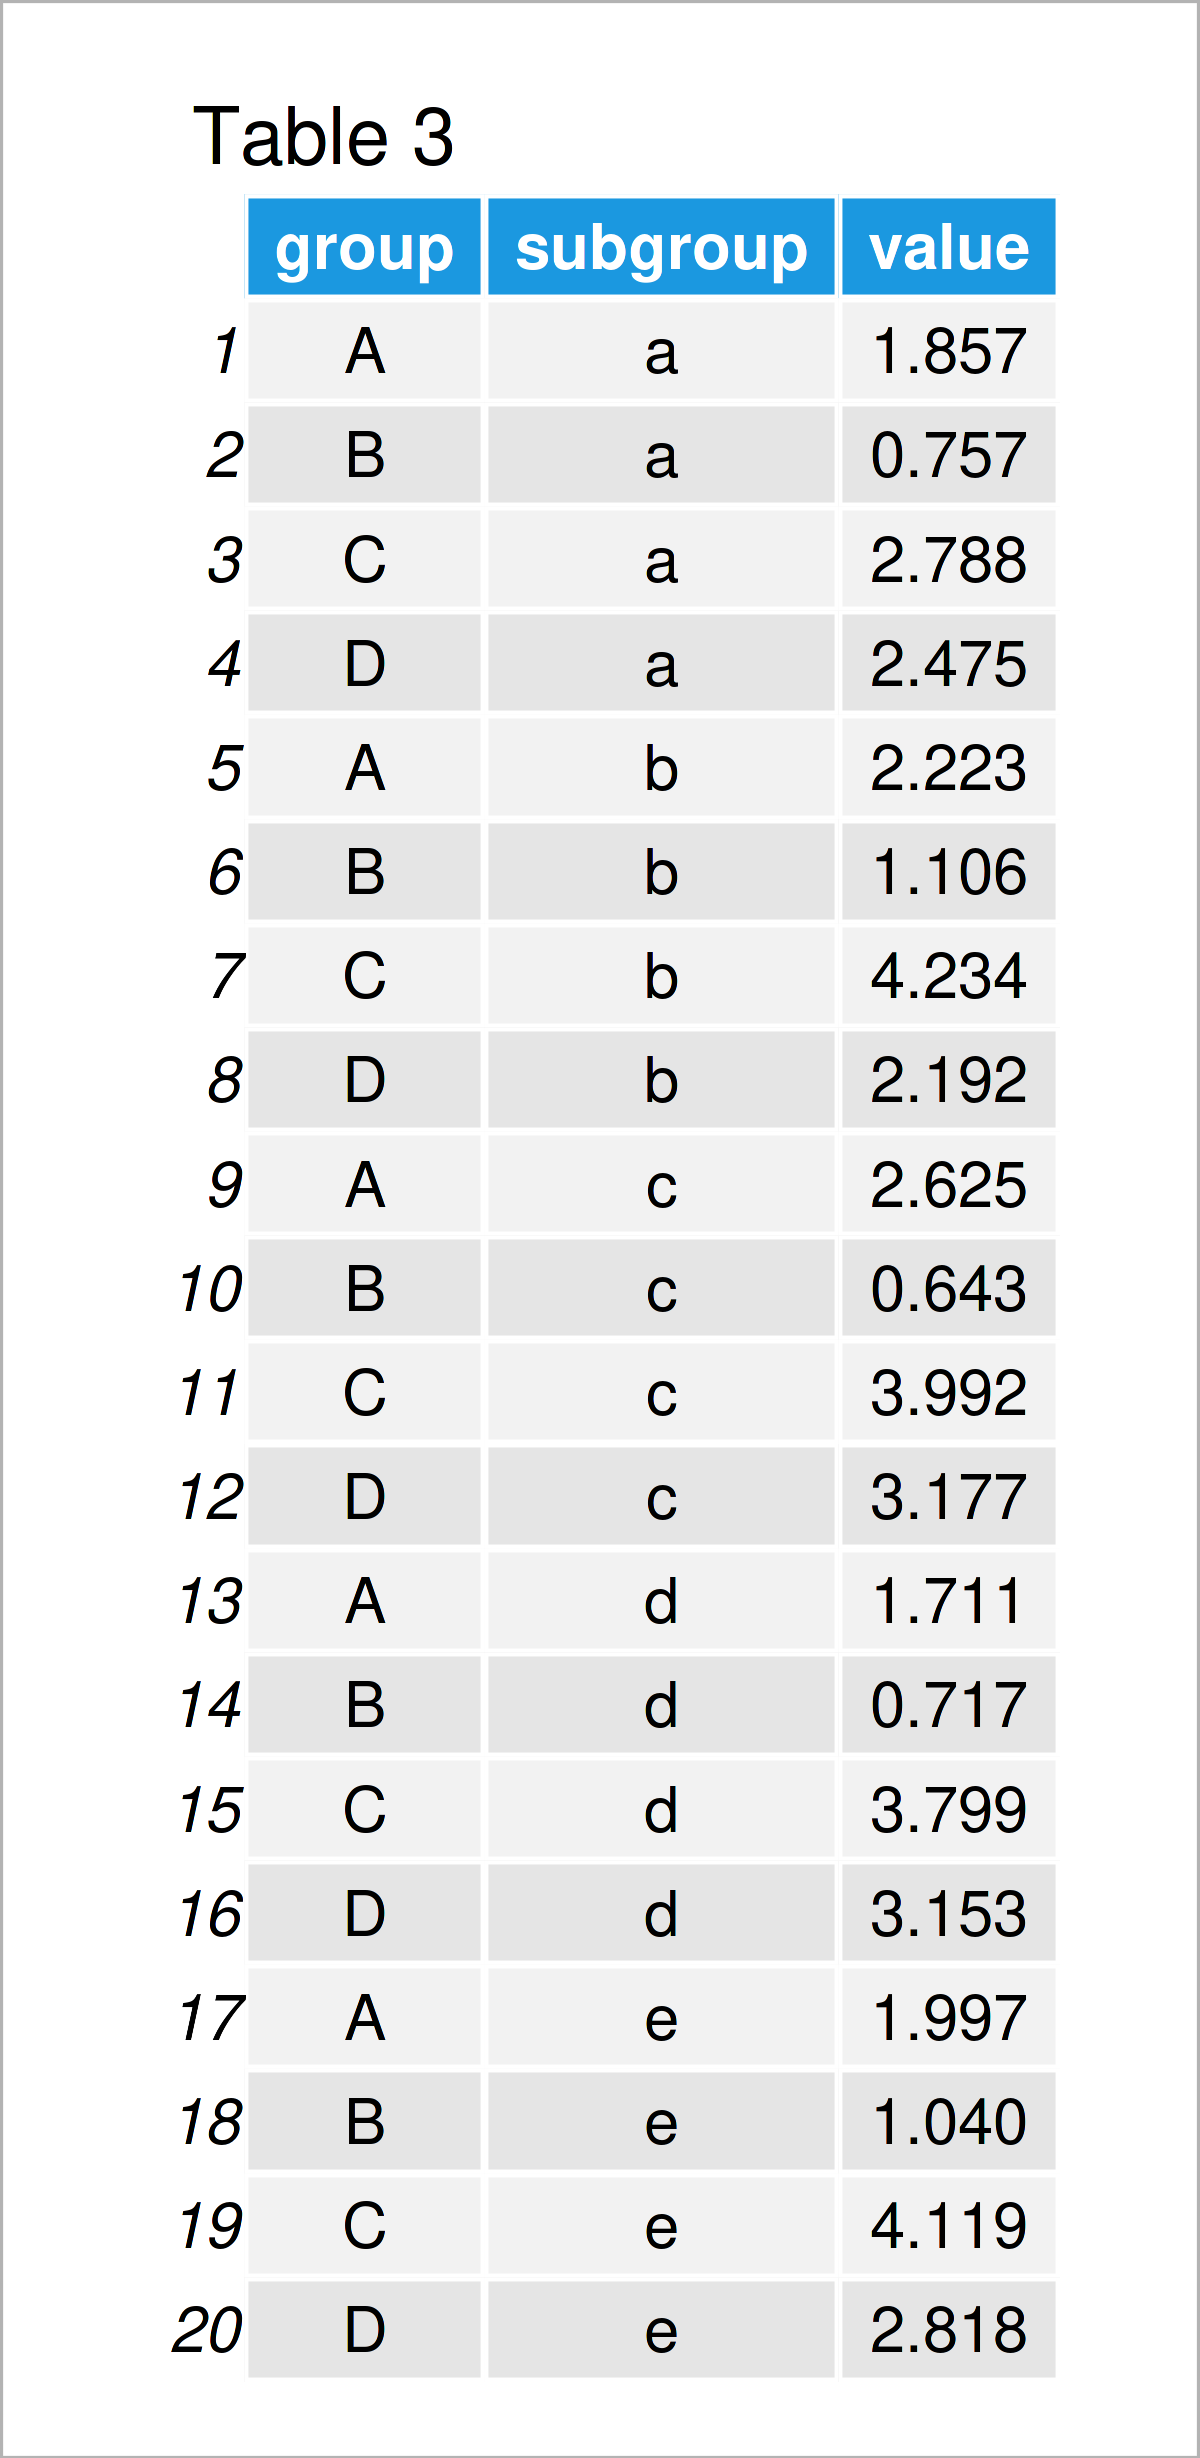
As shown in Table 3, the previous R syntax has created a new data frame containing a single mean value for each of our subgroups.
Next, we can use these data to draw a grouped ggplot2 barplot:
ggplot(data_aggr,                                 # Draw grouped barplot with default order
       aes(x = group,
           y = value,
           fill = subgroup)) +
  geom_col(position = "dodge")
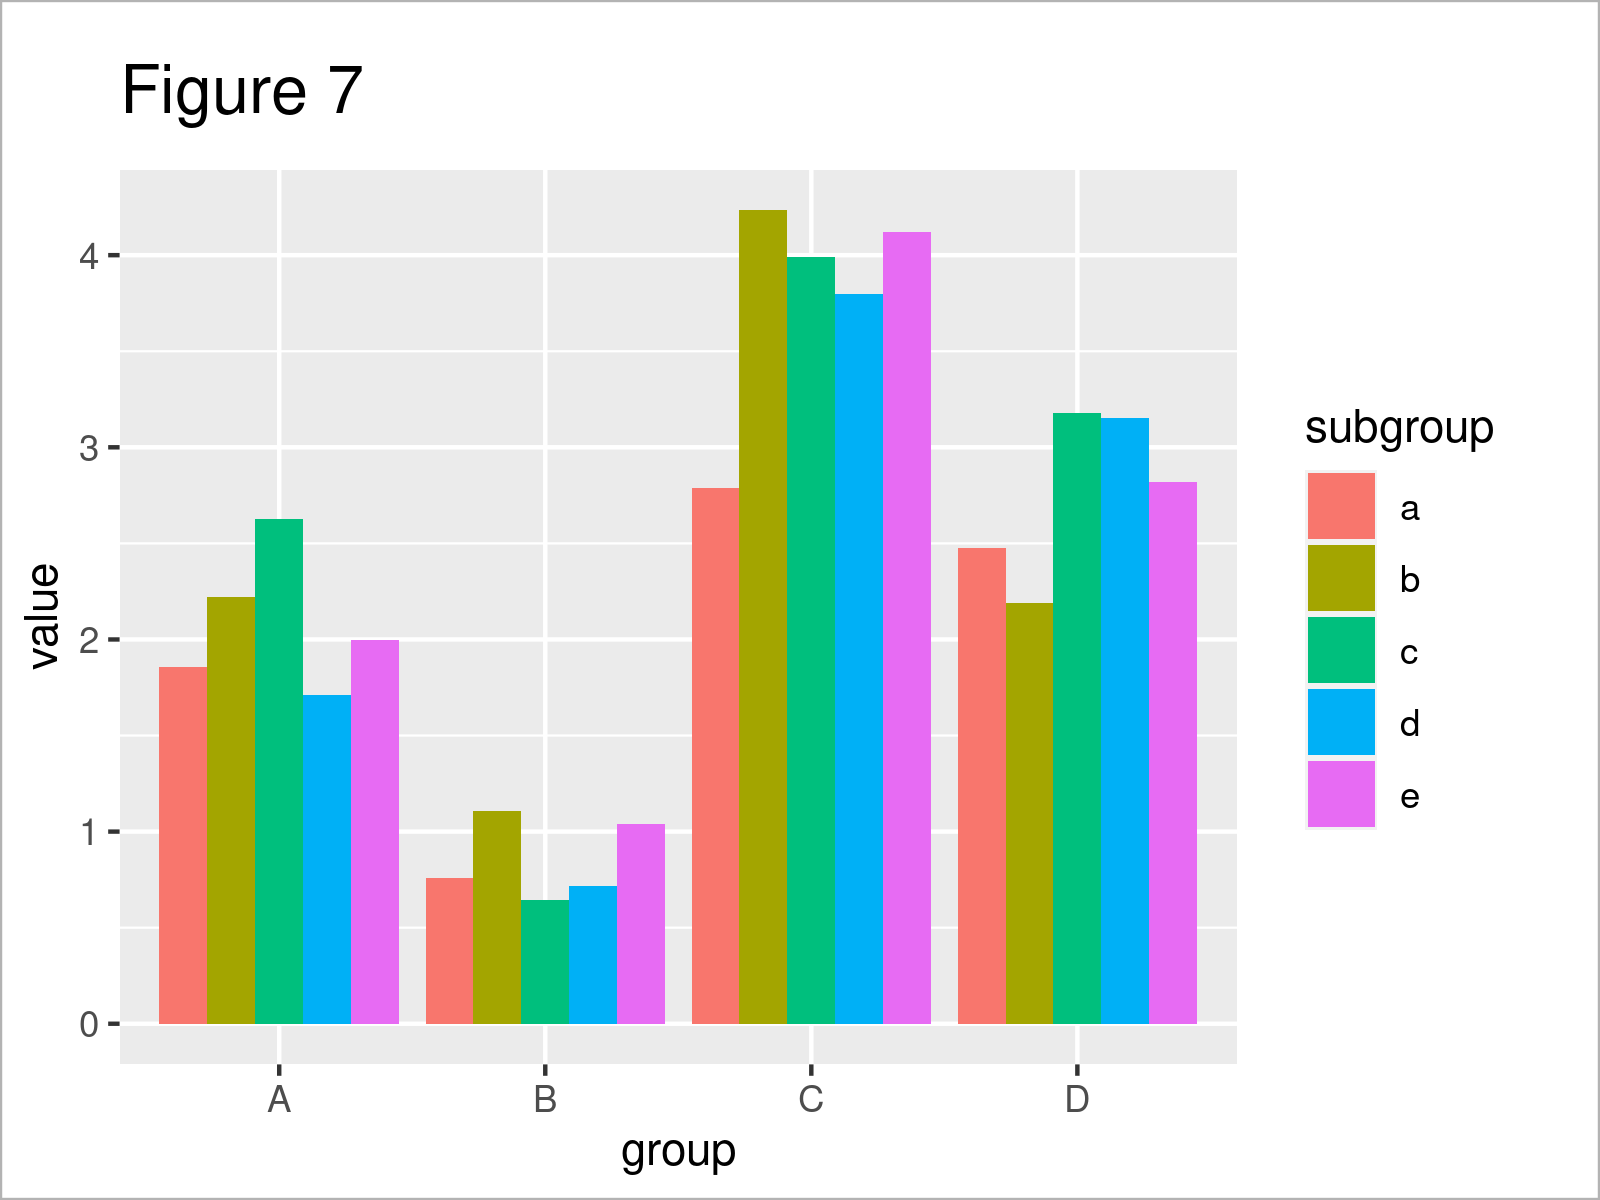
In Figure 7 you can see that we have created a grouped ggplot2 barplot with default ordering of the bars using the previous R programming syntax.
We might now use a similar syntax as in Example 3 to sort the subgroup bars within each main group:
ggplot(data_aggr,                                 # Draw grouped barplot ordered by mean
       aes(x = group,
           y = value,
           fill = reorder(subgroup,
                          value))) +
  geom_col(data = data_aggr[data_aggr$group == "A", ], position = "dodge") +
  geom_col(data = data_aggr[data_aggr$group == "B", ], position = "dodge") +
  geom_col(data = data_aggr[data_aggr$group == "C", ], position = "dodge") +
  geom_col(data = data_aggr[data_aggr$group == "D", ], position = "dodge") +
  scale_fill_discrete(name = "subgroup", breaks = sort(unique(data_aggr$subgroup)))
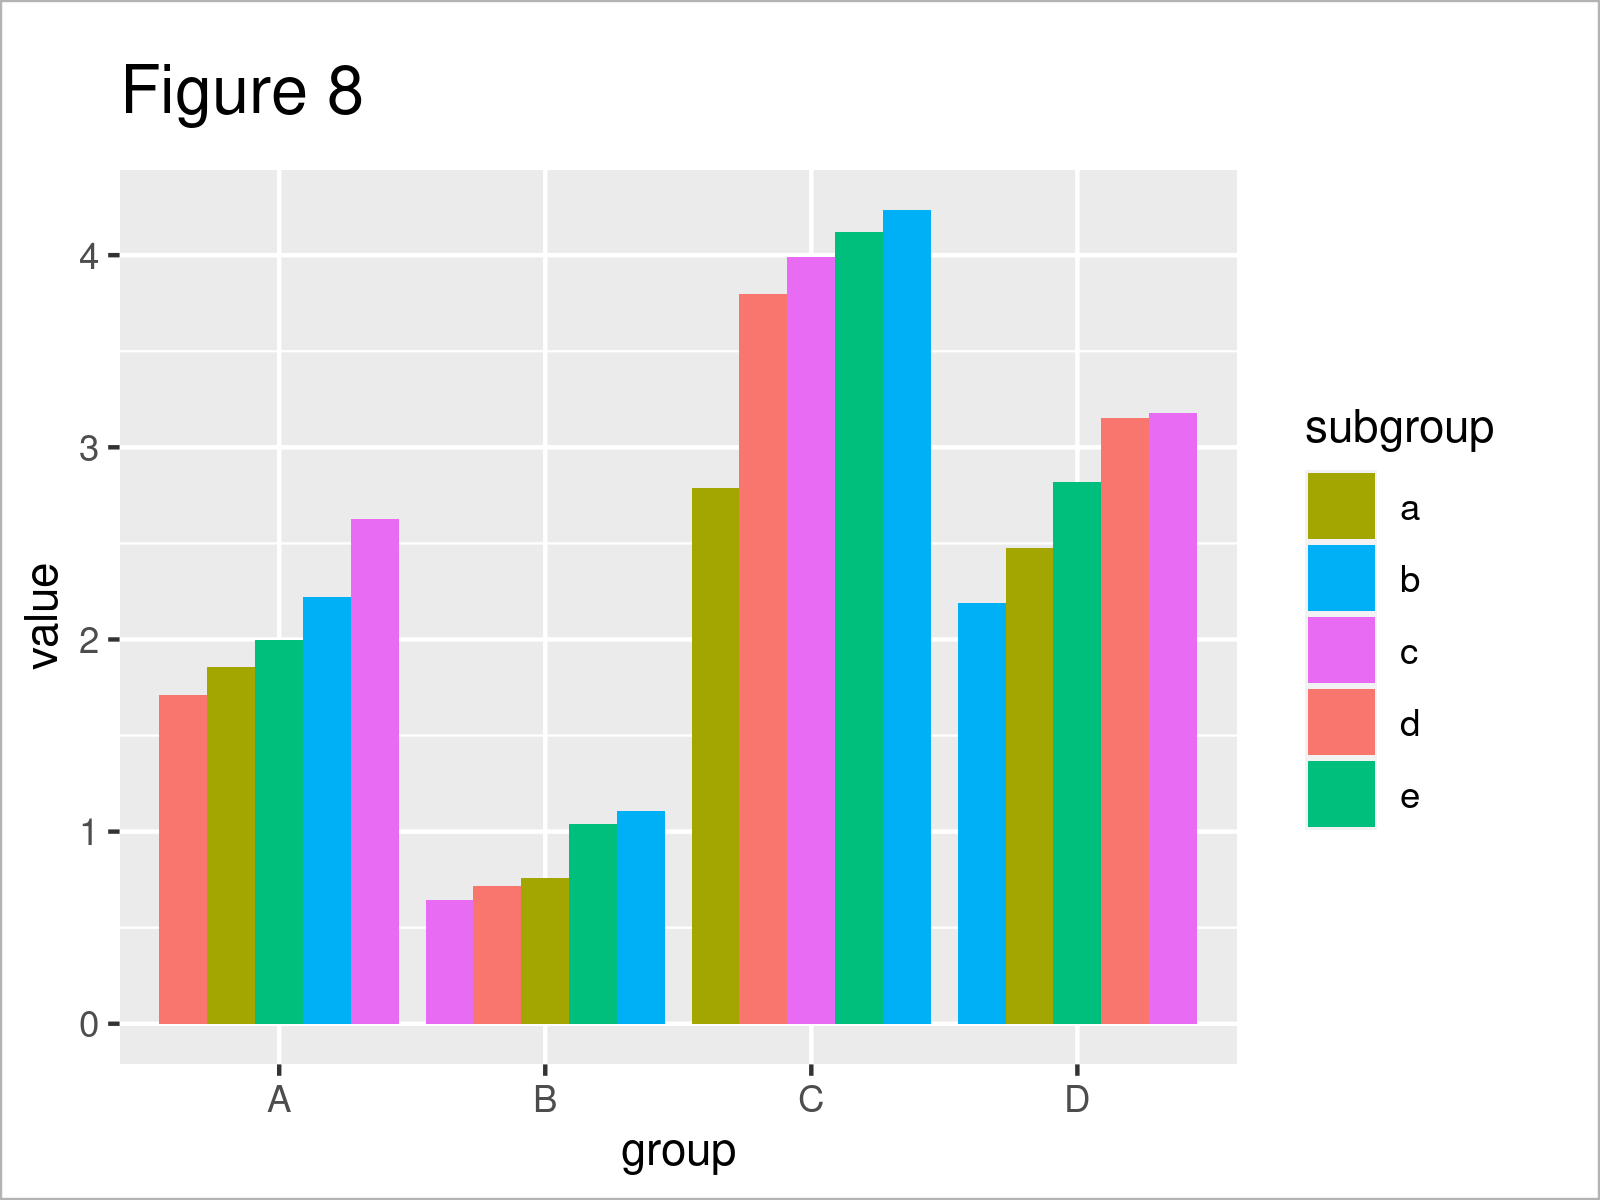
Figure 8 shows the output of the previous R code – The bars in each subgroup have been sorted.
Video, Further Resources & Summary
Do you need further information on the R code of this article? Then I recommend having a look at the following video on my YouTube channel. In the video, I’m explaining the R programming codes of this article in a live session:
Furthermore, you may want to have a look at the other tutorials on my website:
- Reorder Boxplot in R
- Draw Two ggplot2 Boxplots on Same X-Axis Position
- Change y-Axis Limits of Boxplot
- Preserve Width & Position of Single ggplot2 Boxplot
- R Graphics Gallery
- Introduction to R Programming
In this R tutorial you have learned how to sort boxplots by median values. Don’t hesitate to let me know in the comments, if you have further questions.


