Reorder Boxplot in R (2 Examples)
In this post you’ll learn how to specify the ordering of a boxplot manually in R.
The article will contain these contents:
Let’s take a look at some R codes in action.
Example Data & Basic Plot
Initially, we’ll have to construct some example data:
set.seed(76259402)                           # Create example data
data <- data.frame(group = rep(LETTERS[1:4], each = 25),
                   values = rnorm(100))
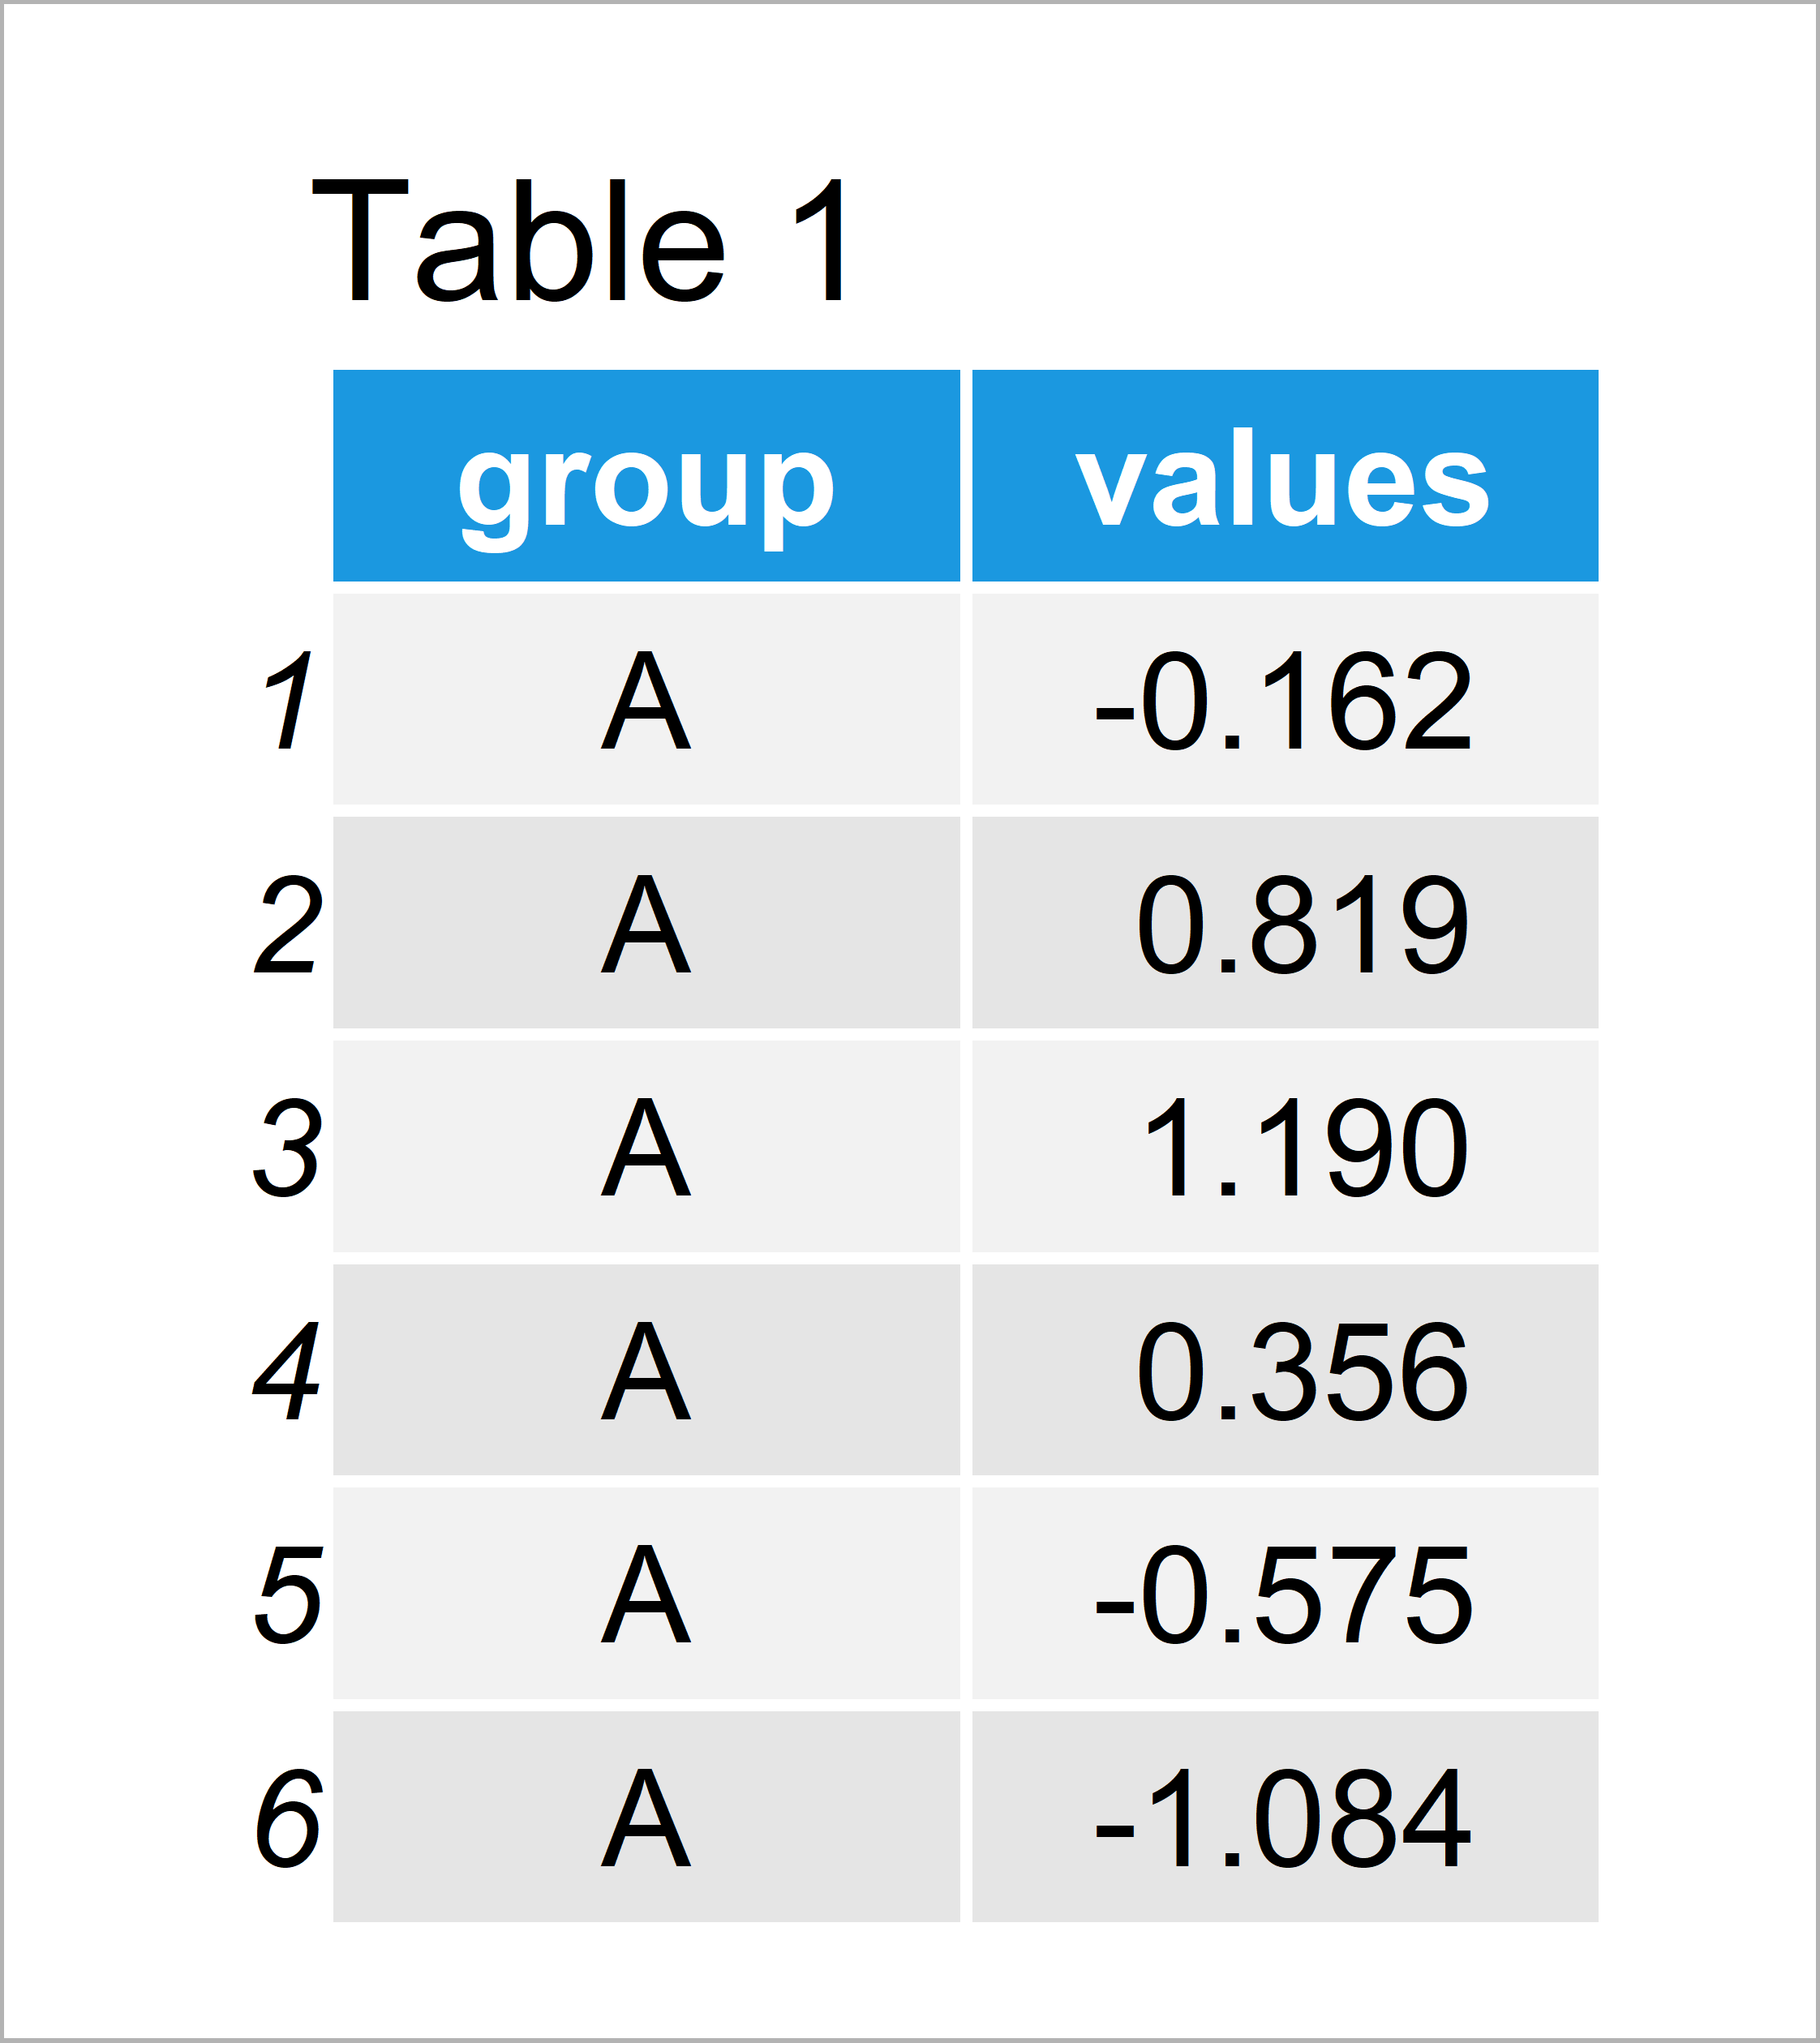
head(data)                                   # Head of example data

Table 1 shows the structure of our example data – It consists of 100 data points and two variables.
For illustration, we can draw our data with default specification in Base R:
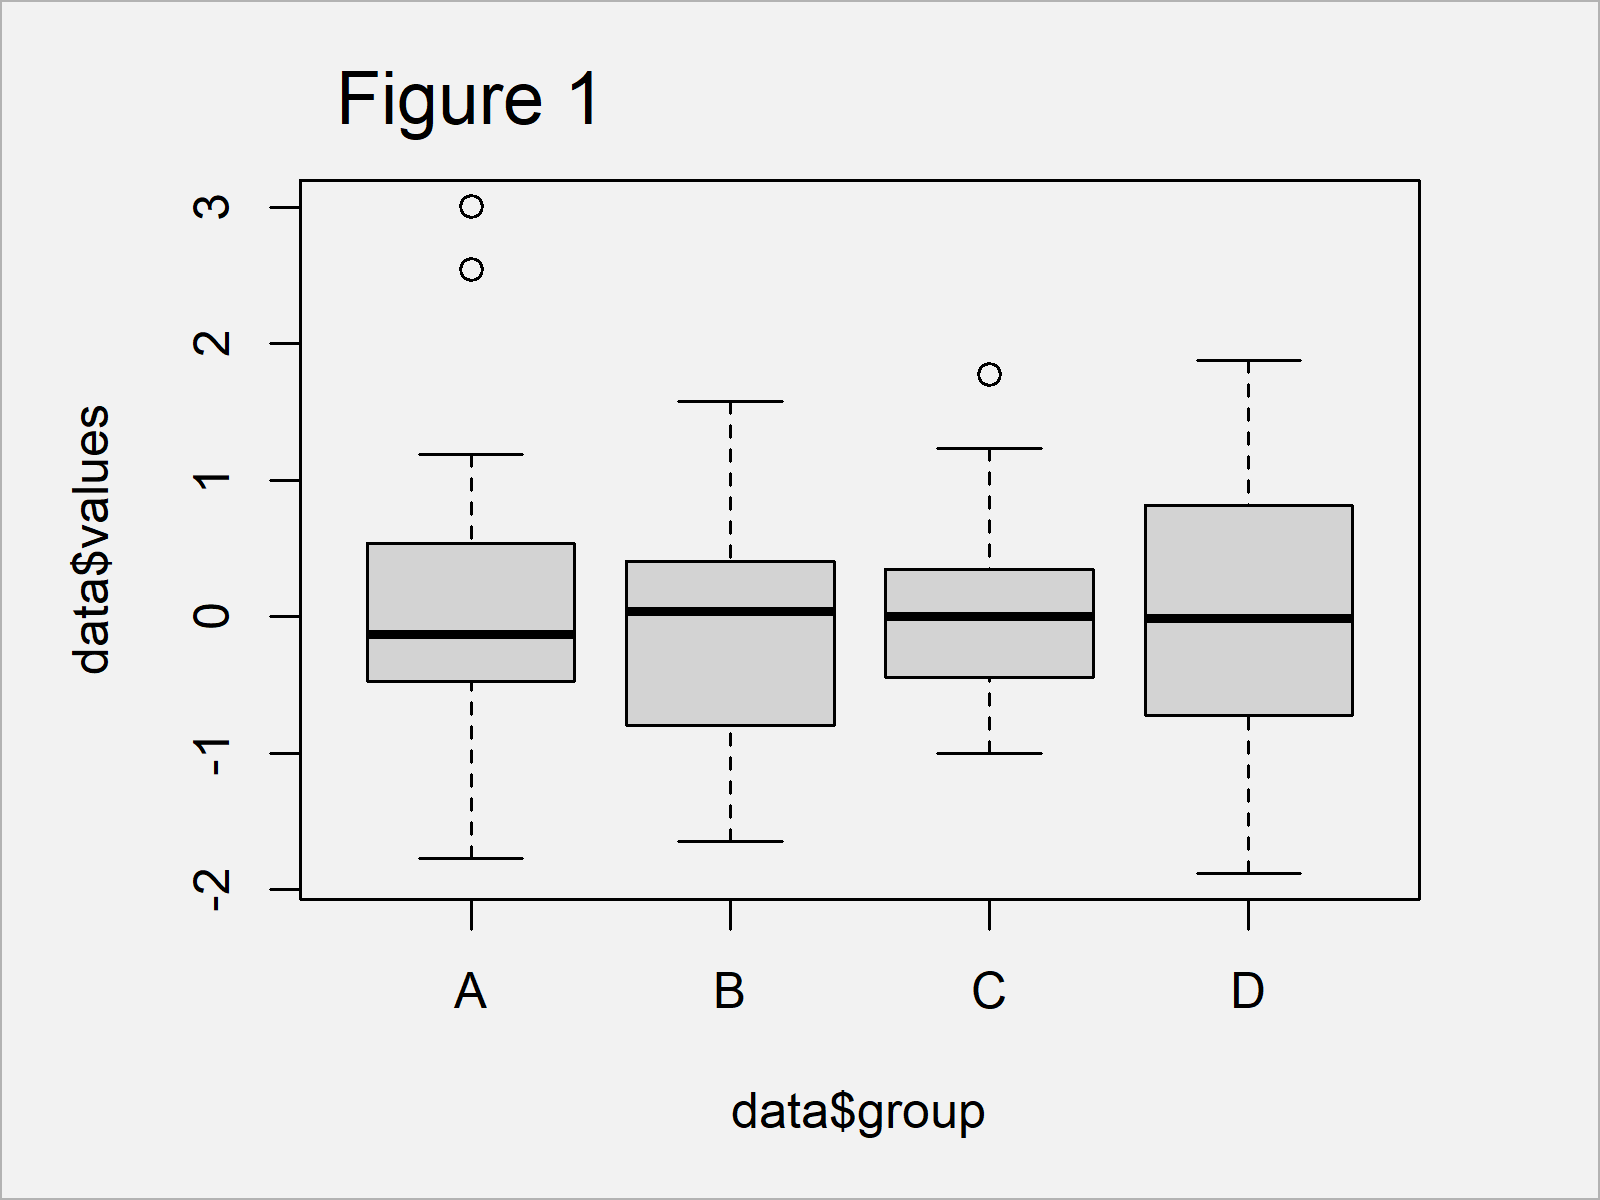
boxplot(data$values ~ data$group) # Default boxplot in Base R

Figure 1 shows the output of the previous R code – An alphabetically ordered boxplot created with the basic installation of the R programming language.
Let’s rearrange the ordering of these boxes!
Modify Input Data Frame for Reordered Boxplot
To adjust the ordering of the boxplots in our graph, we have to modify the factor levels of the grouping variable in our input data frame.
Consider the following R code:
data_new <- data                             # Duplicate data
data_new$group <- factor(data_new$group,     # Reorder factor levels
                         c("C", "B", "D", "A"))
After running the previous R code, we have created a new data frame called data_new, which has a different order of the factor levels in the grouping column.
Example 1: Draw Boxplot with Manually Specified Order Using Base R
We can now use the updated data frame to create a Base R boxplot with manually specified order of the boxes:
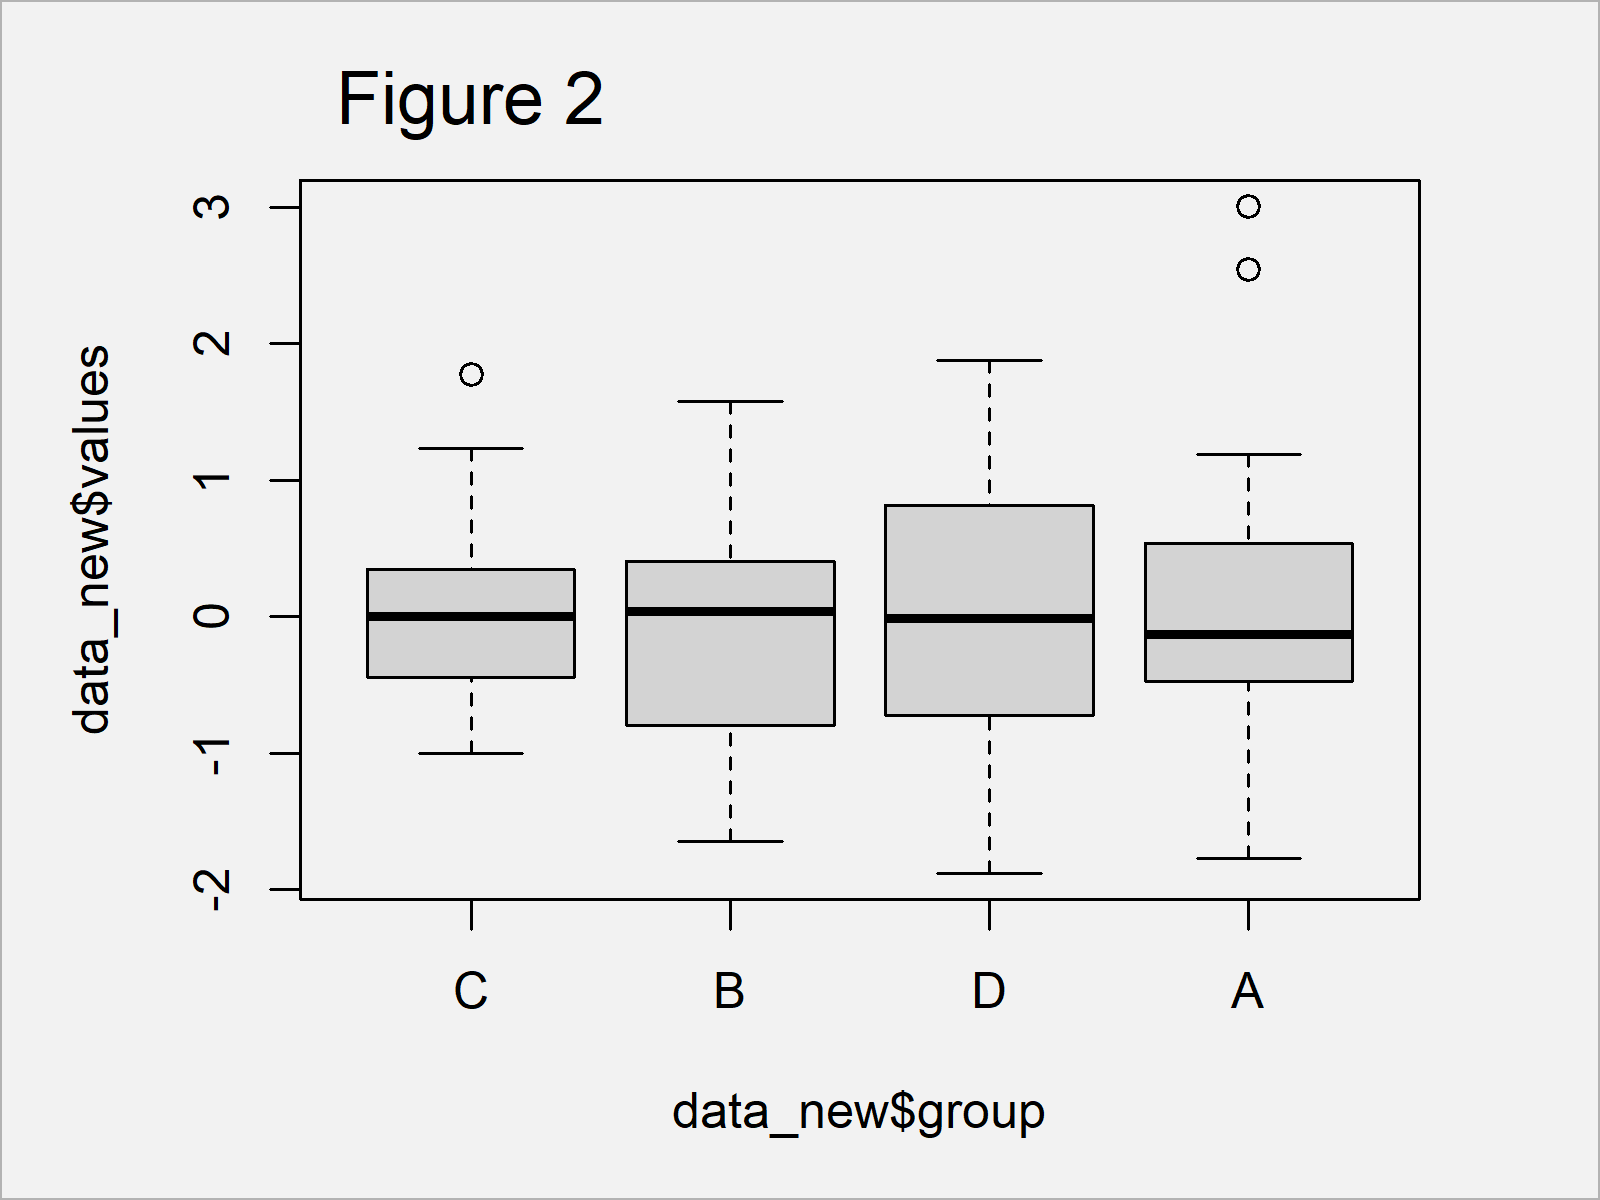
boxplot(data_new$values ~ data_new$group) # Reordered boxplot in Base R

The output of the previously shown syntax is shown in Figure 2 – A manually sorted boxplot in Base R.
Example 2: Draw Boxplot with Manually Specified Order Using ggplot2 Package
The following code shows how to draw a ggplot2 boxplot with user-defined order.
First, we have to install and load the ggplot2 package to RStudio:
install.packages("ggplot2")                  # Install & load ggplot2
library("ggplot2")
Next, we can use the new data frame with manual factor order to create our boxplot:
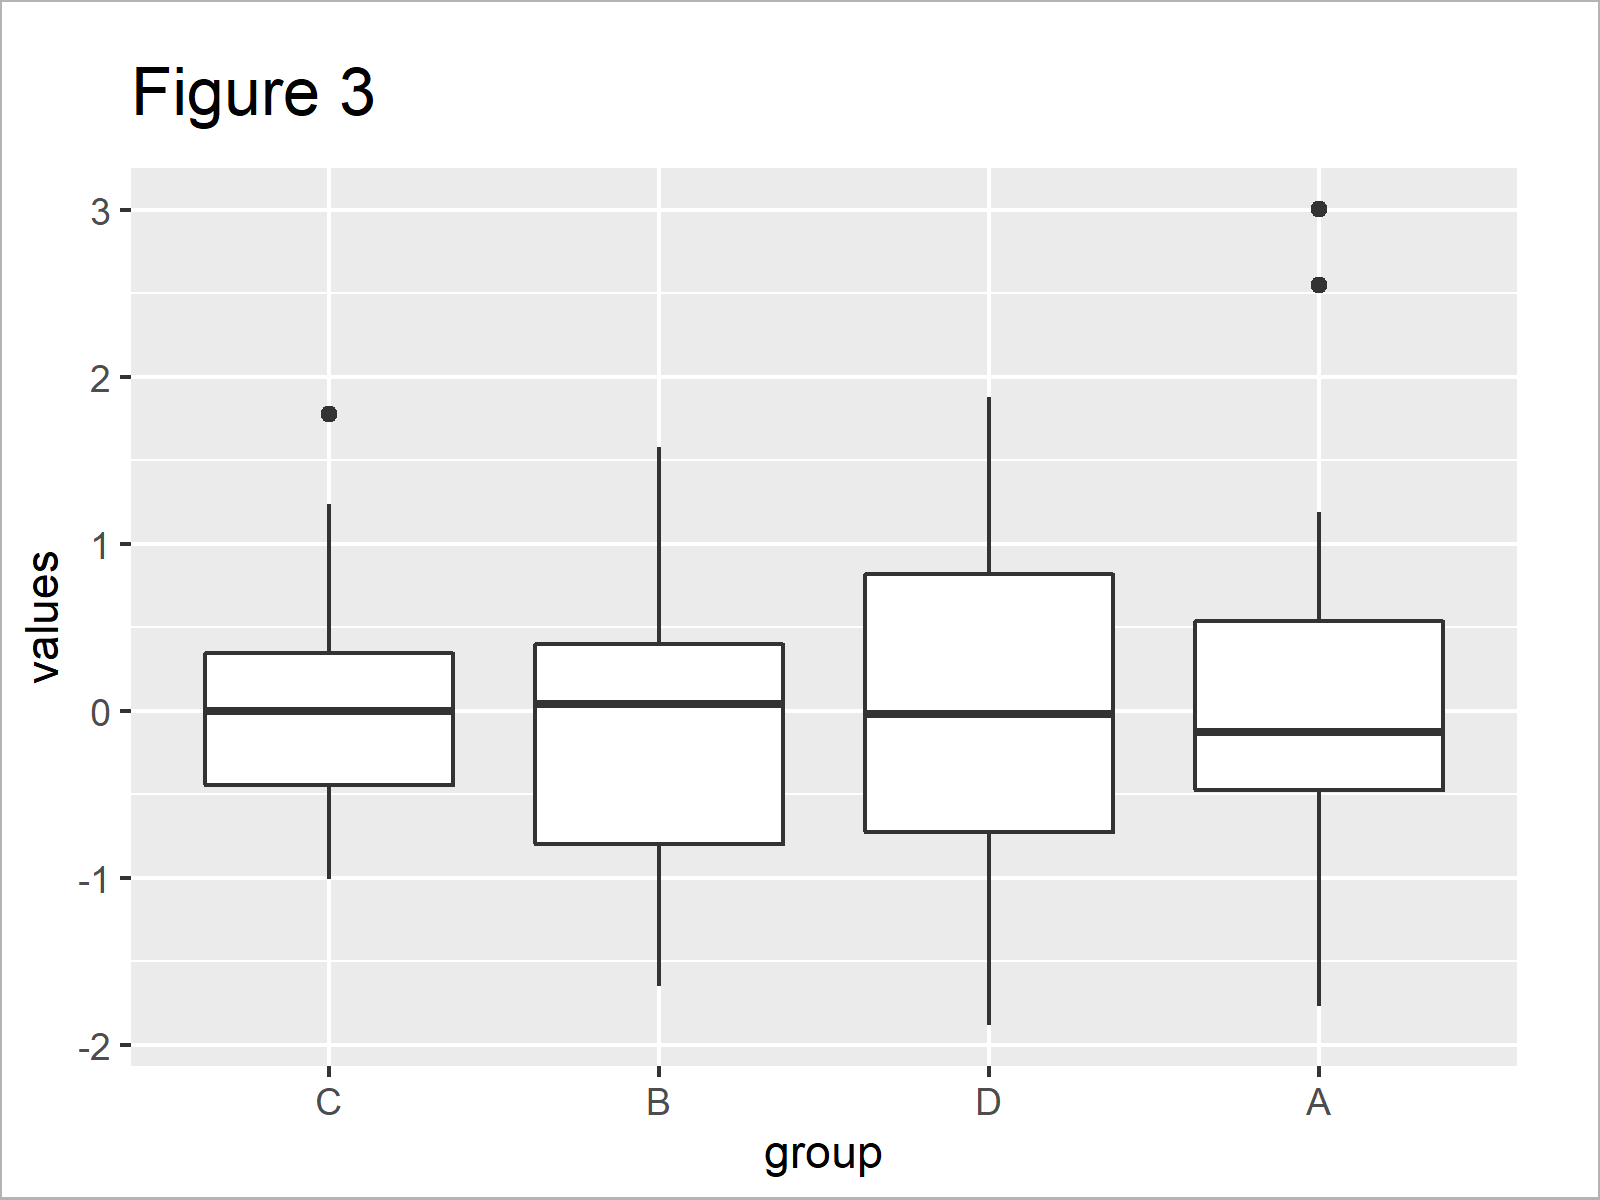
ggplot(data_new, aes(group, values)) +       # Reordered boxplot in ggplot2
  geom_boxplot()

The output of the previously shown R programming code is shown in Figure 3 – A boxplot graph with reordered boxes.
Video, Further Resources & Summary
Do you want to know more about sorting boxplots? Then you might watch the following video which I have published on my YouTube channel. I’m explaining the R codes of this article in the video:
In addition, you may have a look at the related R articles of this homepage. You can find some tutorials about box-and-whisker plots and other types of graphics below.
Summary: In this tutorial you have learned how to sort a boxplot in the R programming language. Please tell me about it in the comments section below, in case you have further questions. Furthermore, don’t forget to subscribe to my email newsletter for updates on new articles.


