Preserve Width & Position of Single ggplot2 Boxplot in R (2 Examples)
In this R tutorial you’ll learn how to adjust the width and position of a specific boxplot in a grouped ggplot2 boxplot.
The article will contain the following information:
Let’s start right away!
Example Data, Add-On Packages & Basic Plot
The first step is to create some example data:
set.seed(3756576)                     # Create example data
data <- data.frame(group = LETTERS[1:3],
                   subgroup = letters[1:2],
                   value = rnorm(90))
data$subgroup[data$group == "A" & data$subgroup == "b"] <- "a"
head(data)                            # Print head of example data

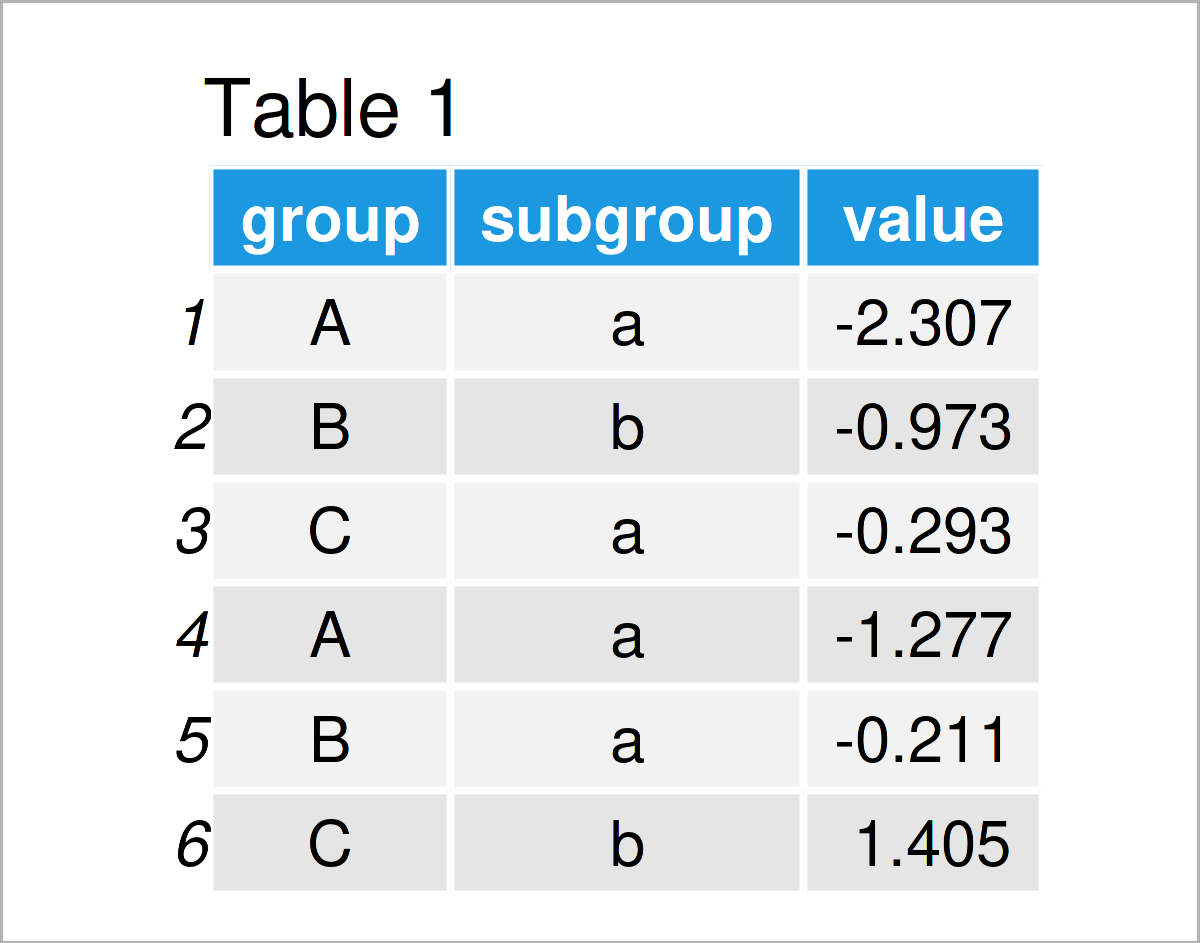
Table 1 visualizes the output of the RStudio console that got returned after running the previous R syntax and shows that our example data consists of three variables. The variables group and subgroup are characters and the column value is numerical.
In order to use the functions of the ggplot2 package, we also need to install and load ggplot2 to RStudio:
install.packages("ggplot2")           # Install ggplot2 package
library("ggplot2")                    # Load ggplot2
Now, we can create a plot of our data as shown below:
ggplot(data,                          # Default ggplot2 boxplot
       aes(x = group,
           y = value,
           fill = subgroup)) +
  geom_boxplot()

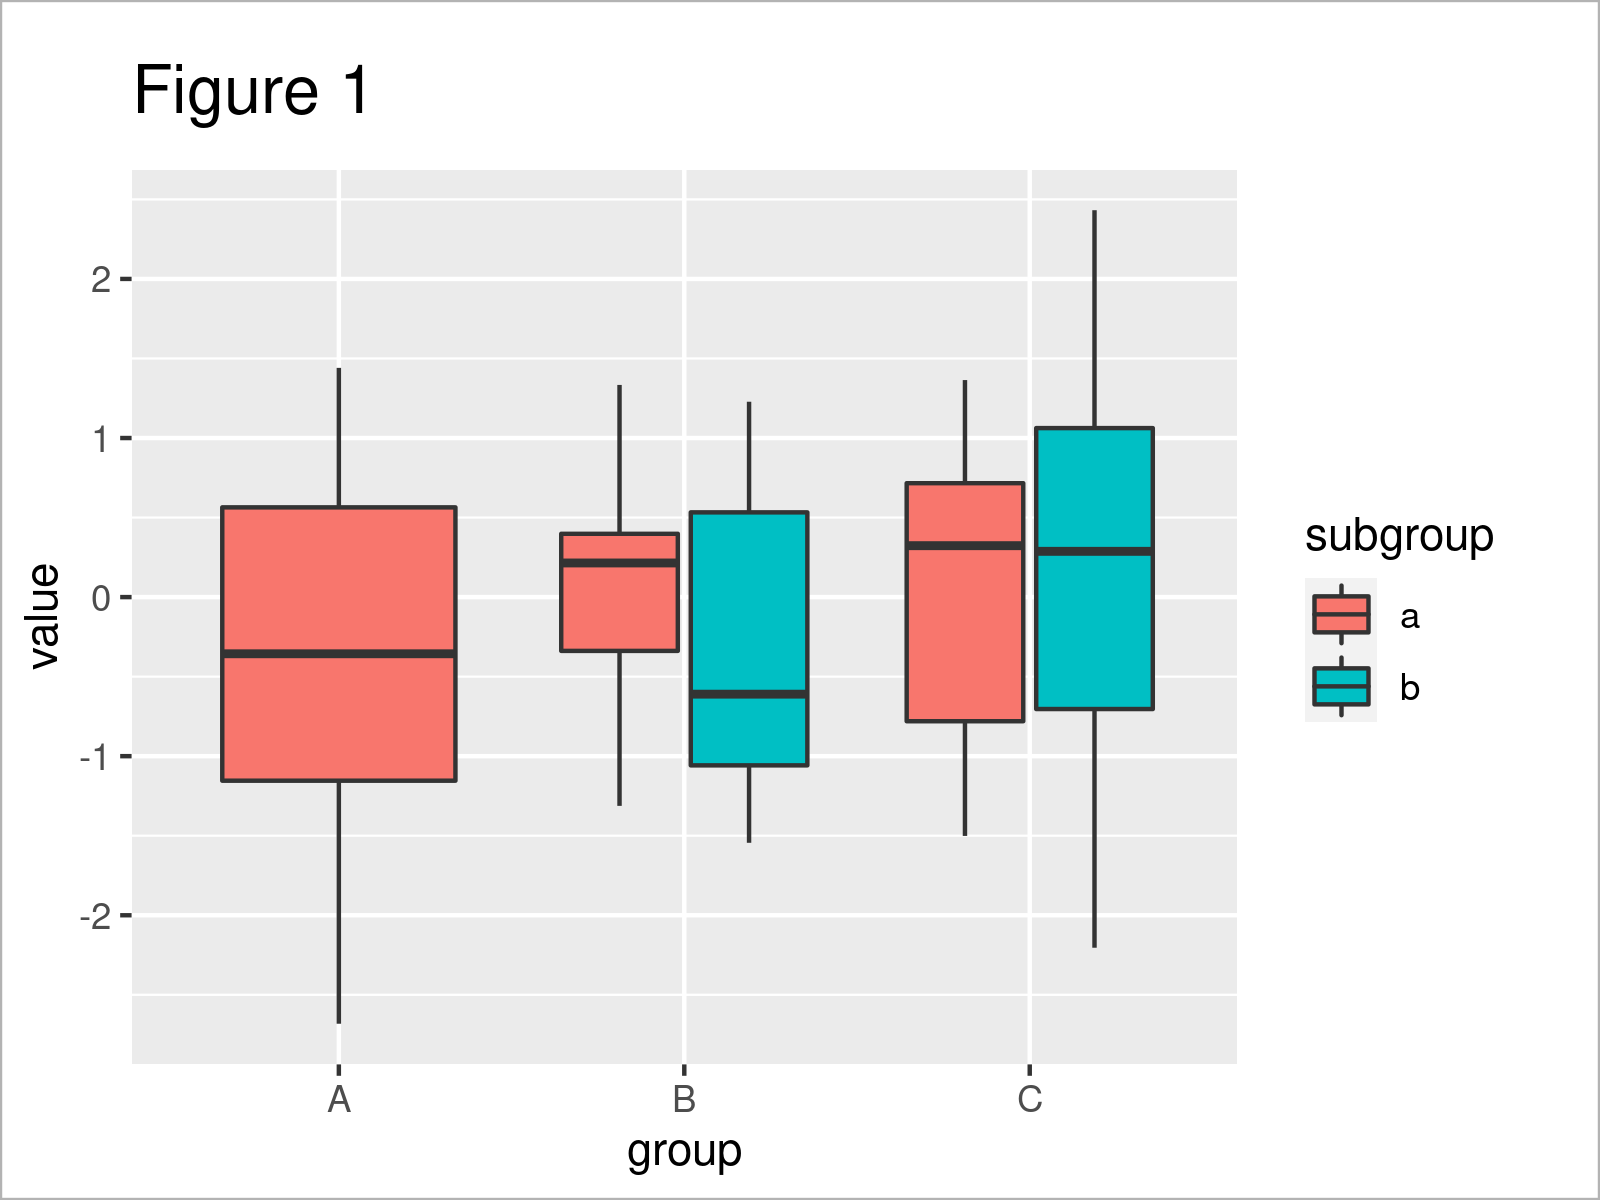
After executing the previous code the grouped ggplot2 boxplot illustrated in Figure 1 has been drawn.
Note that the first box in our graphic is larger than the other boxes. The reason for that is that the main group A contains no values in the subgroup b.
The following examples show how to change this first box with larger width.
Example 1: Change Width of Single ggplot2 Boxplot
In this example, I’ll show how to modify the width of a certain box in a grouped ggplot2 boxplot.
For this, we can use the position_dodge2 function in combination with the preserve argument as shown below:
ggplot(data,                          # Using position_dodge2 function
       aes(x = group,
           y = value,
           fill = subgroup)) +
  geom_boxplot(position = position_dodge2(preserve = "single"))

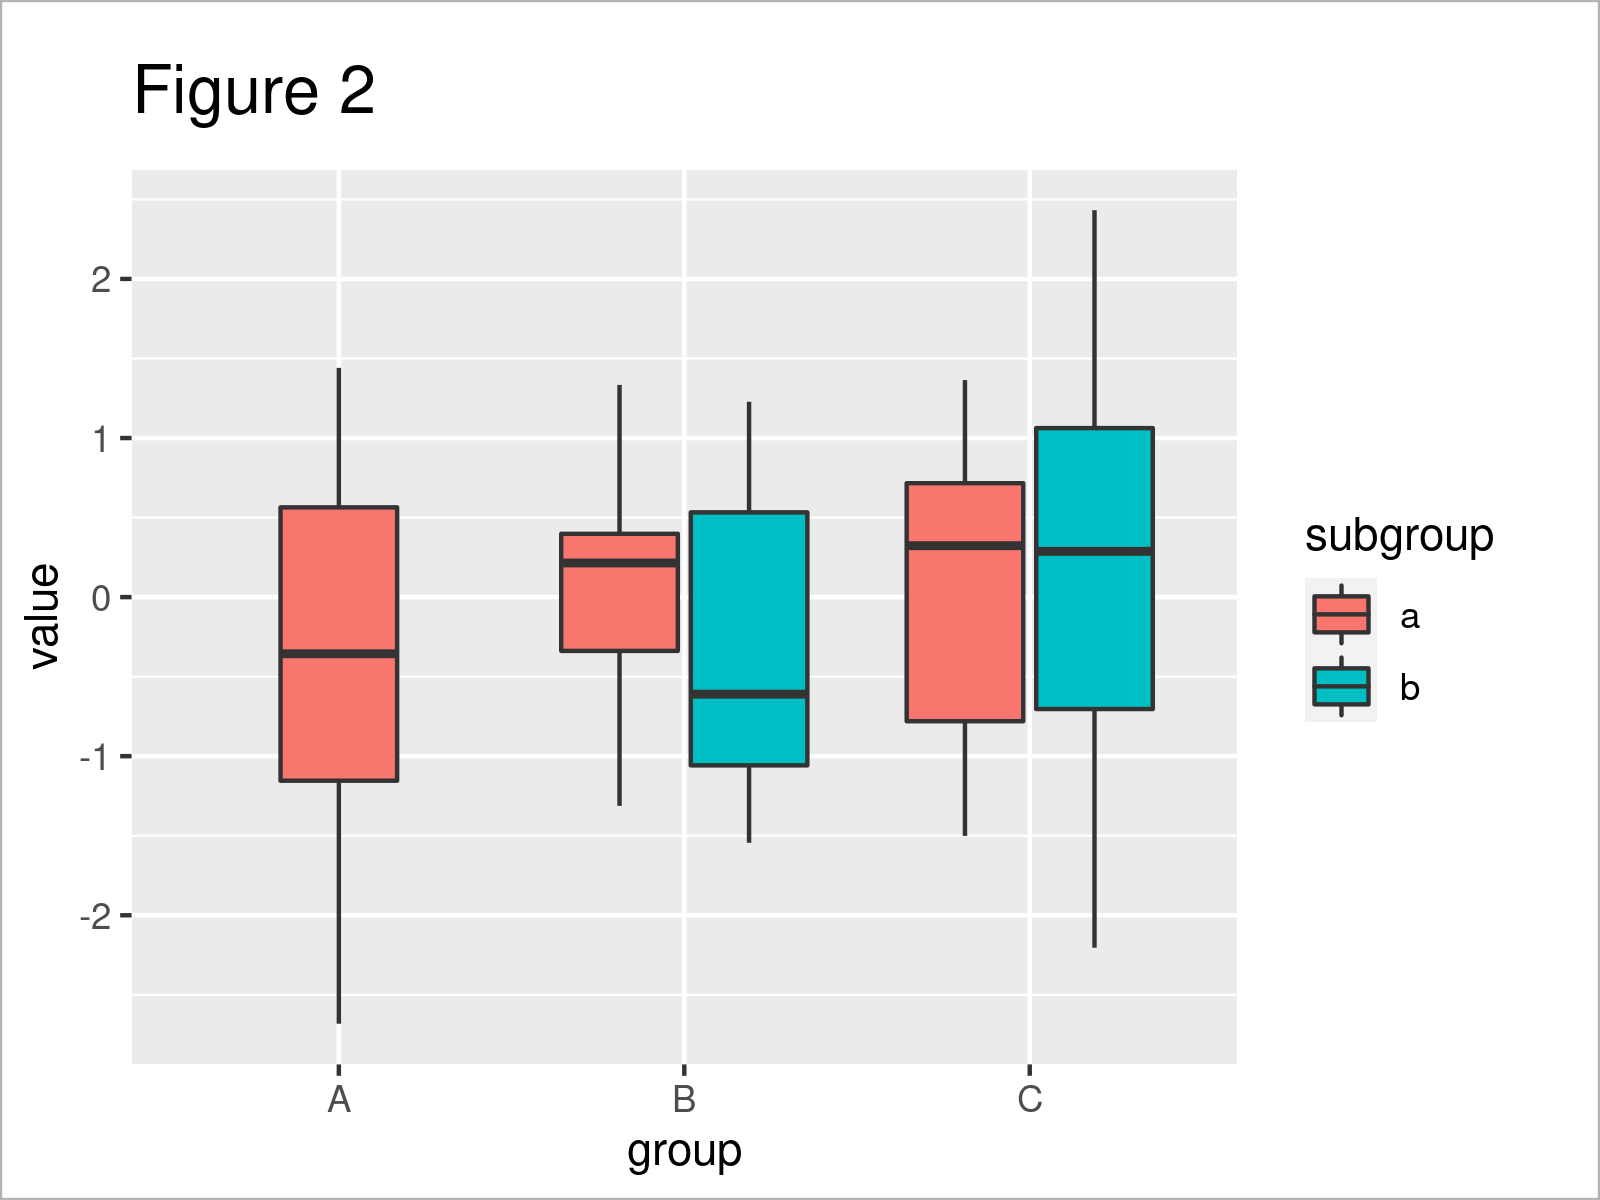
In Figure 2 you can see that we have created a new version of our grouped ggplot2 boxplot by running the previous R programming code.
As you can see, all boxes in our boxplot have the same width now. However, you can also see that the location of the first box is different compared to the other boxes (i.e. in the middle of the group).
Let’s change this!
Example 2: Adjust Position of Single ggplot2 Boxplot
The following R syntax demonstrates how to adjust the position of a single box in a grouped ggplot2 box-and-whisker plot.
All we have to change compared to Example 1 is the function we are using. In Example 1, we have used position_dodge2. In this example, however, we’ll use position_dodge (without the 2).
ggplot(data,                          # Using position_dodge function
       aes(x = group,
           y = value,
           fill = subgroup)) +
  geom_boxplot(position = position_dodge(preserve = "single"))

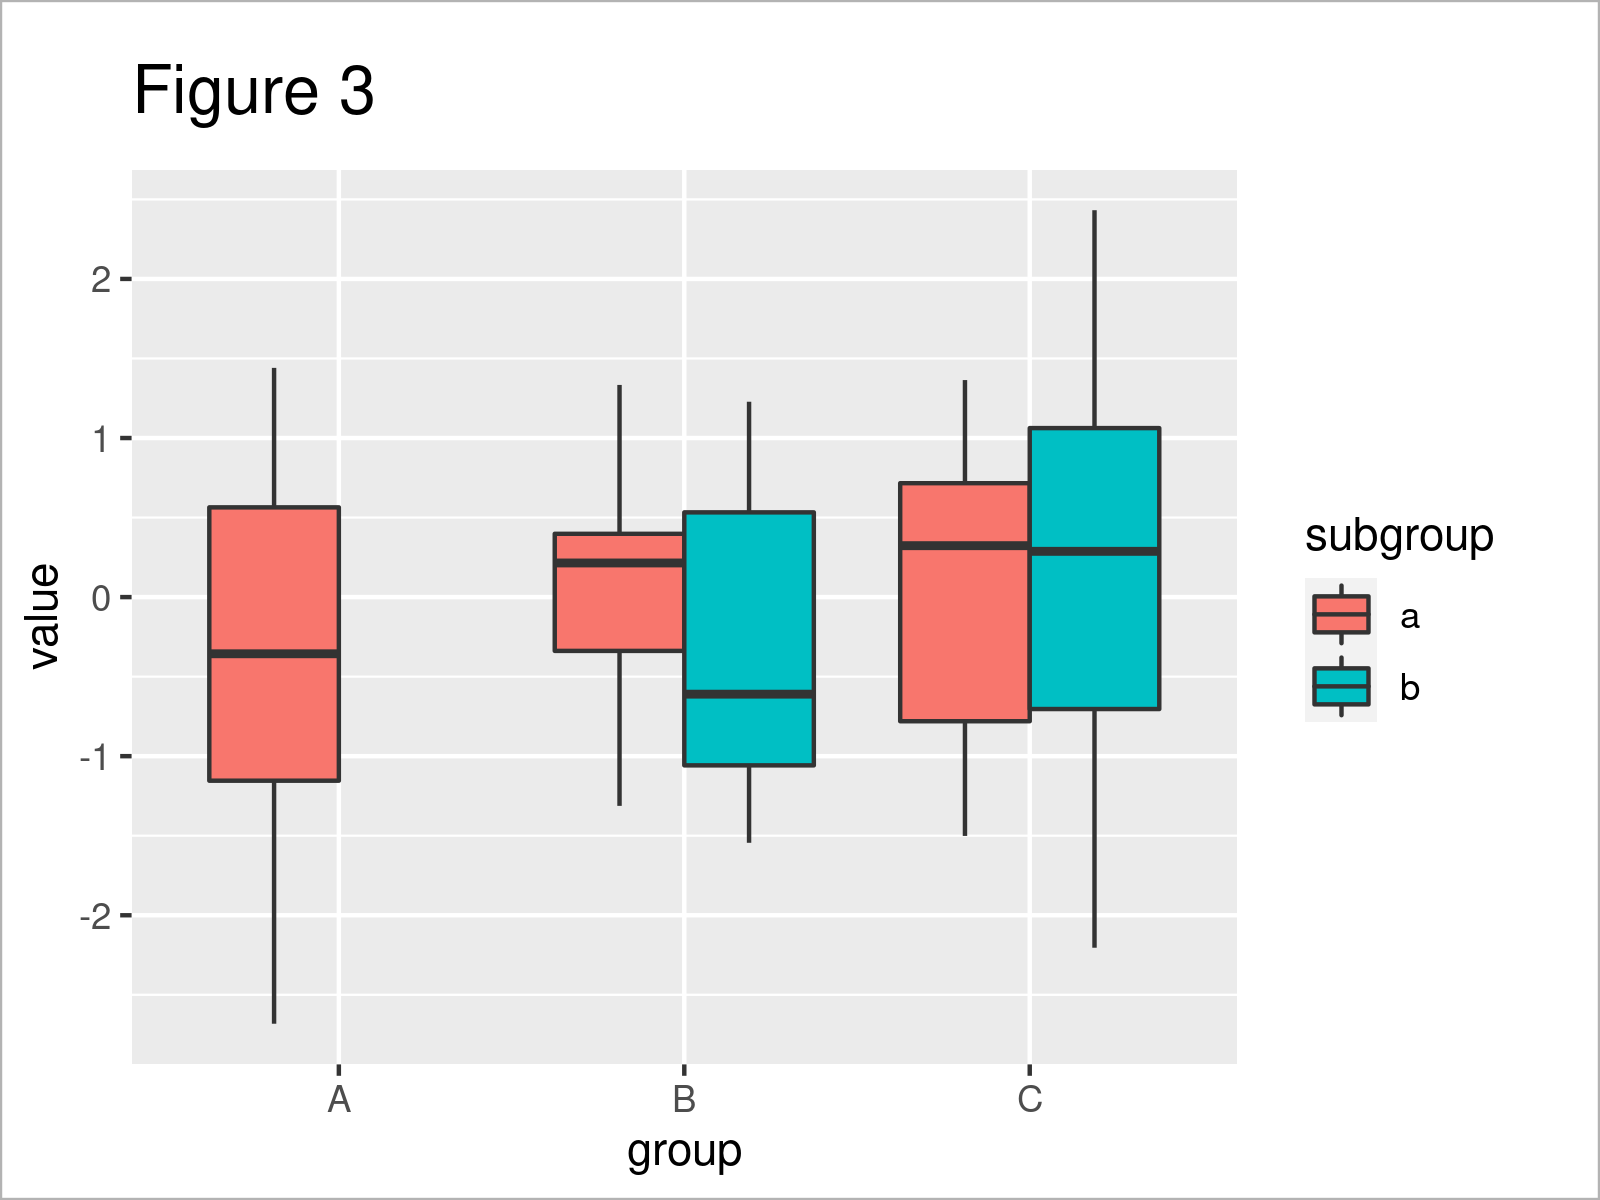
The output of the previous R syntax is shown in Figure 3: The location of the first boxplot has been moved to the left.
Video & Further Resources
If you need more explanations on the R programming syntax of this tutorial, I recommend watching the following video on my YouTube channel. In the video, I demonstrate the contents of this article.
Furthermore, you may have a look at the other articles on this website:
- Add Whiskers to ggplot2 Boxplot in R
- Change Line Width in ggplot2 Plot in R
- Overlay ggplot2 Boxplot with Line
- Draw Multiple ggplot2 Plots with Consistent Width in R
- R Graphics Gallery
- R Programming Examples
In this article, I have illustrated how to modify the width and position of a specific boxplot in a grouped ggplot2 boxplot in R. If you have further questions, let me know in the comments.


