Draw Two ggplot2 Boxplots on Same X-Axis Position in R (Example)
This article demonstrates how to draw multiple boxplots on the same axis location in the R programming language.
Table of contents:
Let’s dig in.
Example Data, Software Packages & Default Graphic
We’ll use the following data as basement for this R programming tutorial:
set.seed(23732)                       # Create random example data
data <- data.frame(group = rep(letters[1:3], each = 30),
                   value = c(rnorm(30), rnorm(60, 5)))
head(data)                            # Print head of example data

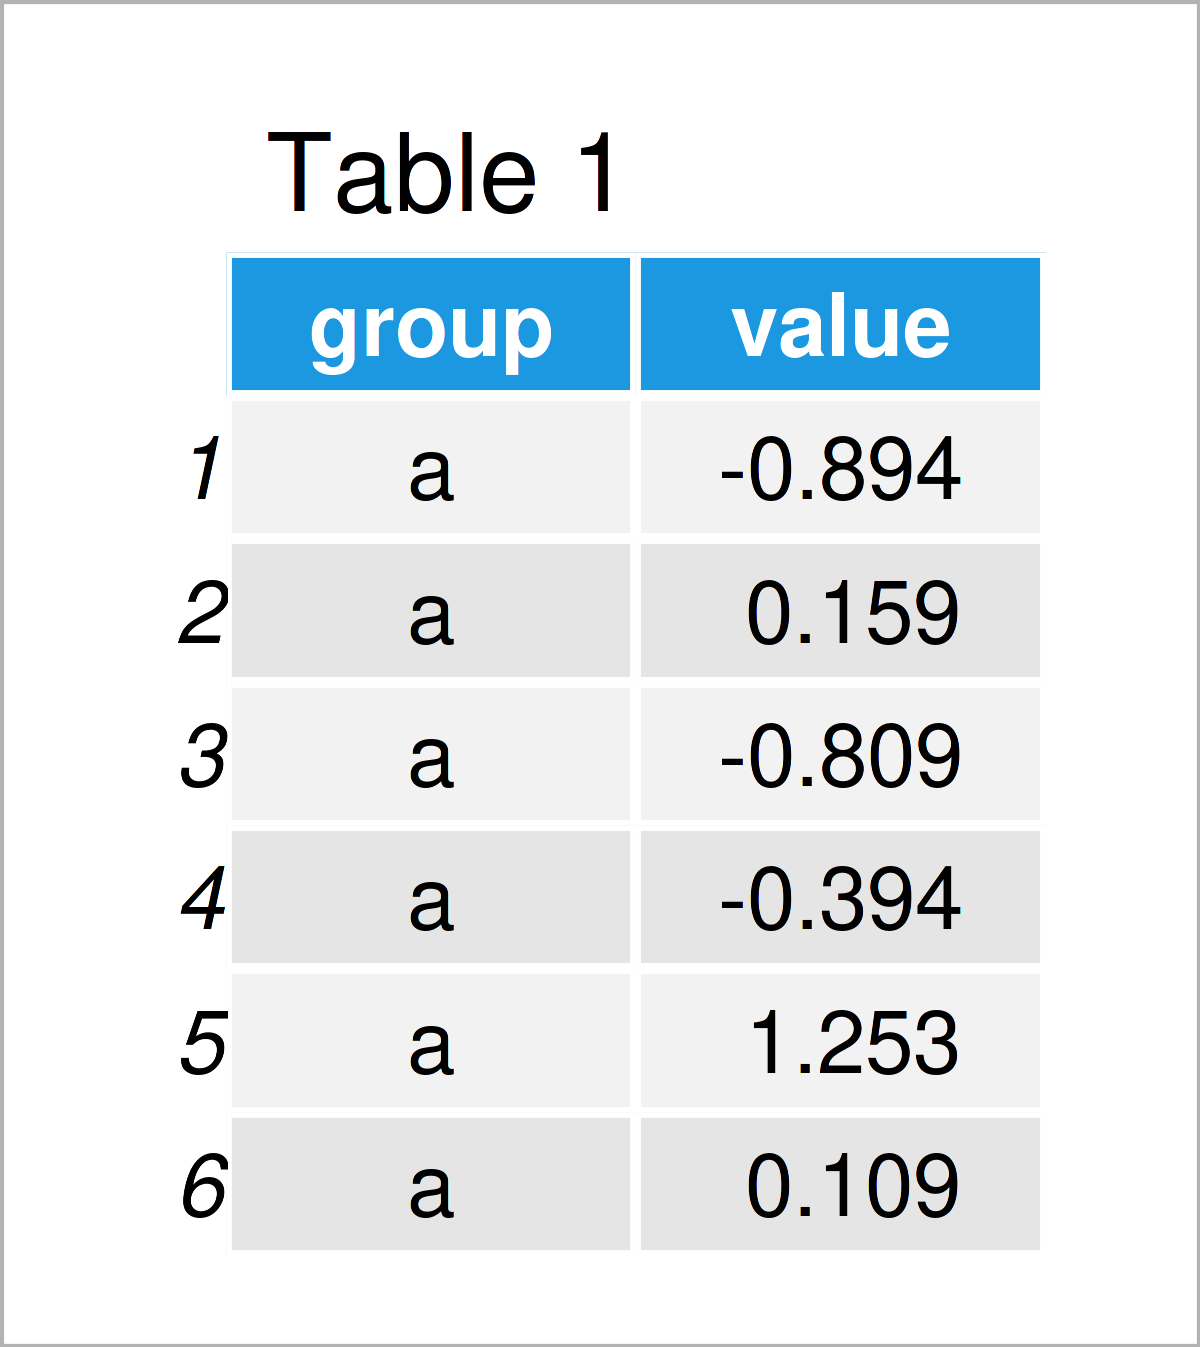
As you can see based on Table 1, our example data is a data frame containing two columns. The variable group is a character and the variable value is numerical.
For the following tutorial, we’ll also have to install and load the ggplot2 package:
install.packages("ggplot2")           # Install & load ggplot2
library("ggplot2")
As a next step, we can draw a graph of our data:
ggplot(data,                          # ggplot2 boxplot with default positions
       aes(x = group,
           y = value,
           fill = group)) +
  geom_boxplot()

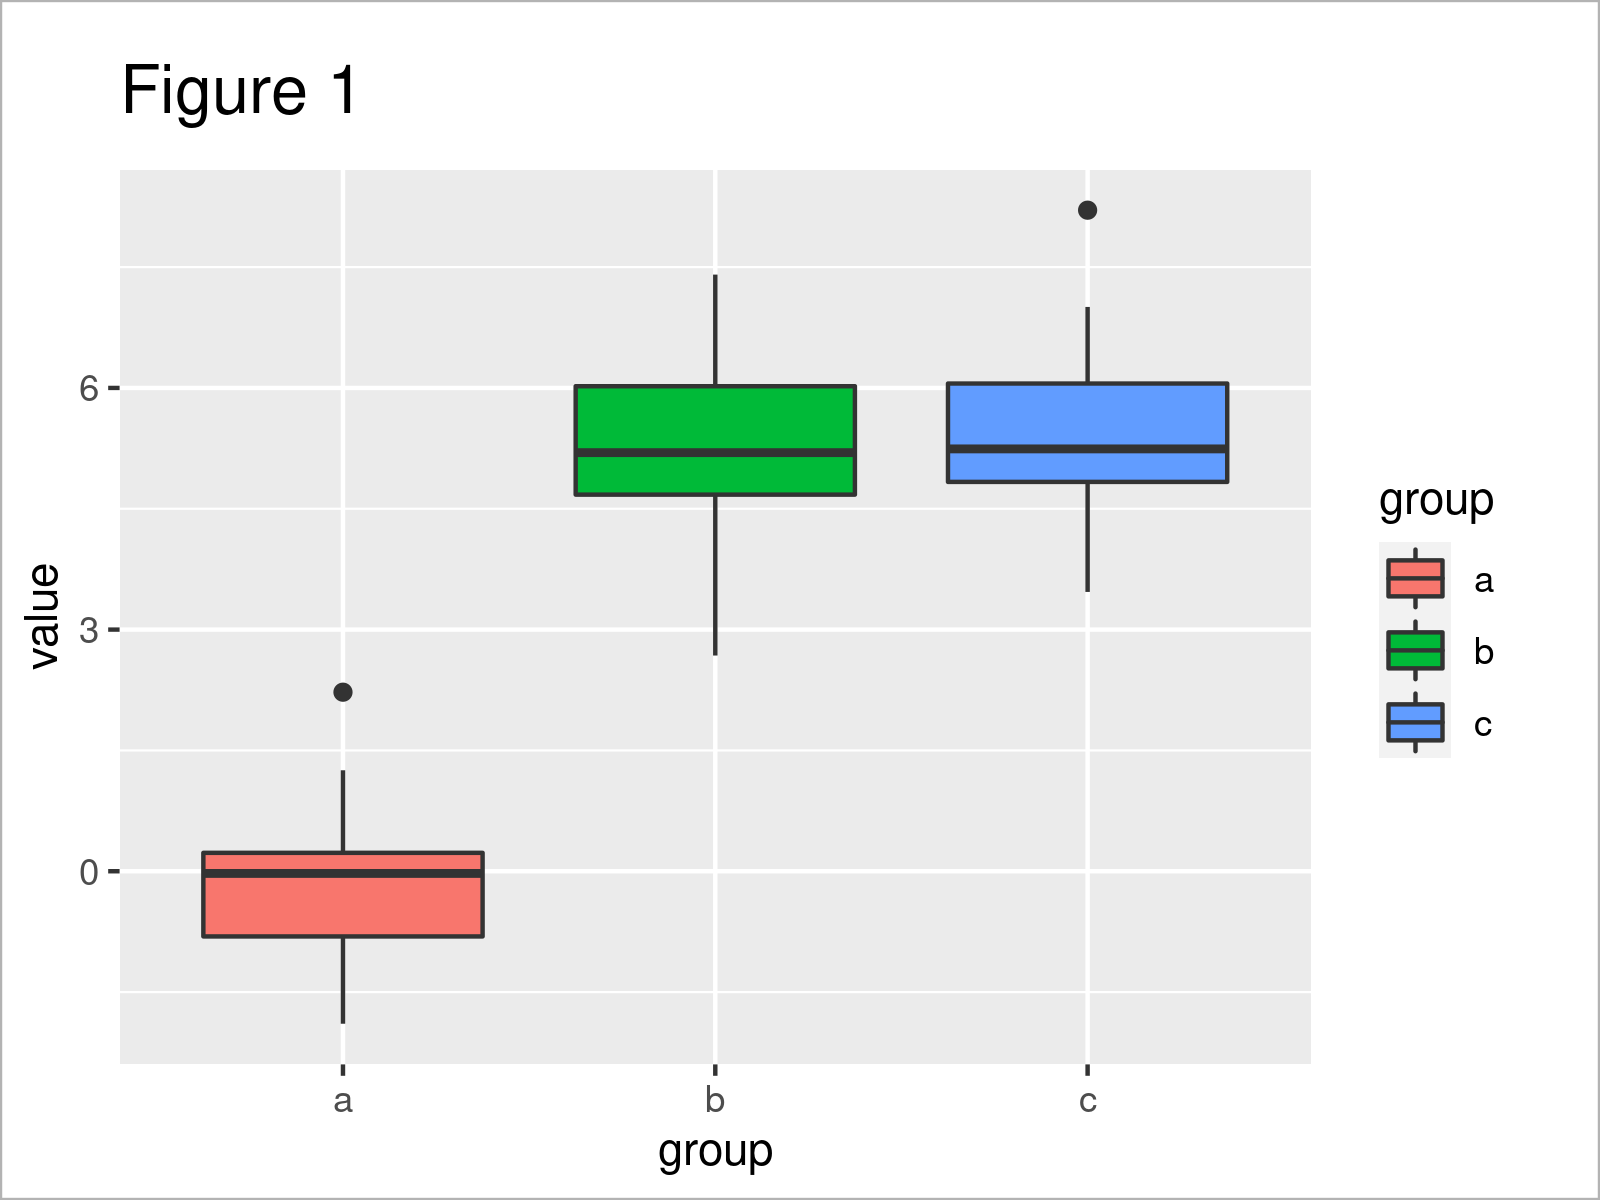
By running the previous R programming syntax we have drawn Figure 1, i.e. a ggplot2 boxplot graphic containing three boxes.
Example: Draw Multiple ggplot2 Boxplots on Same X-Axis Location Using position = “identity”
This example demonstrates how to draw two ggplot2 boxplots on top of each other at the same x-axis position.
For this task, we first have to specify the locations at which we want to draw the different boxes:
data_loc <- data                      # Duplicate data
data_loc$location <- c(rep(1, 60),    # Add locations
                       rep(2, 30))
head(data_loc)                        # Head of updated data

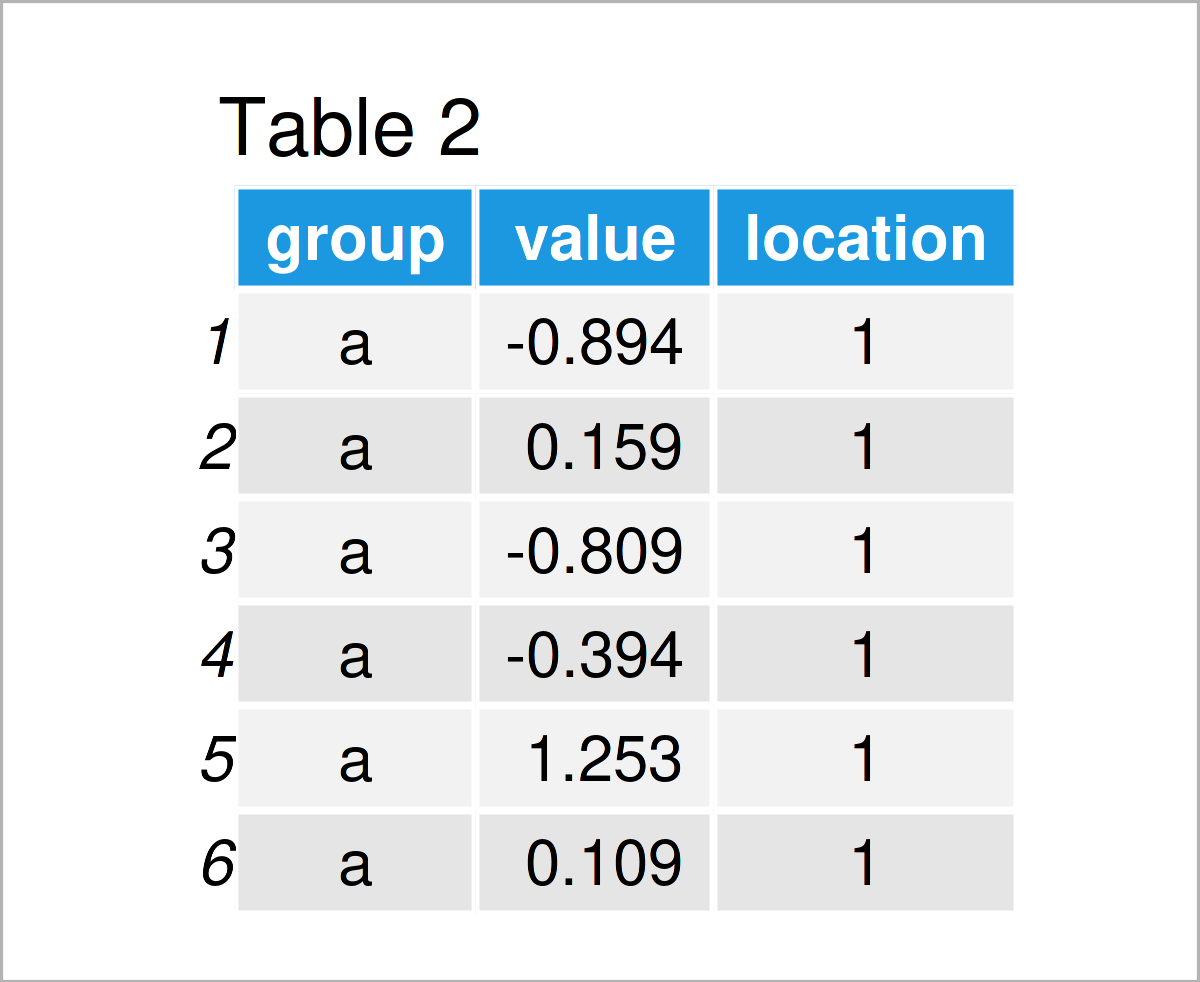
As revealed in Table 2, the previous syntax has created an updated version of our data frame that contains a location column.
In the next step, we can use this new data frame to draw several boxplots at the same axis location.
Note that we are specifying the x argument to be equal to our location column, and we are specifying the position argument within the geom_boxplot function to be equal to “identity”.
ggplot(data_loc,                      # ggplot2 boxplot with manual locations
       aes(x = location,
           y = value,
           fill = group)) +
  geom_boxplot(position = "identity")

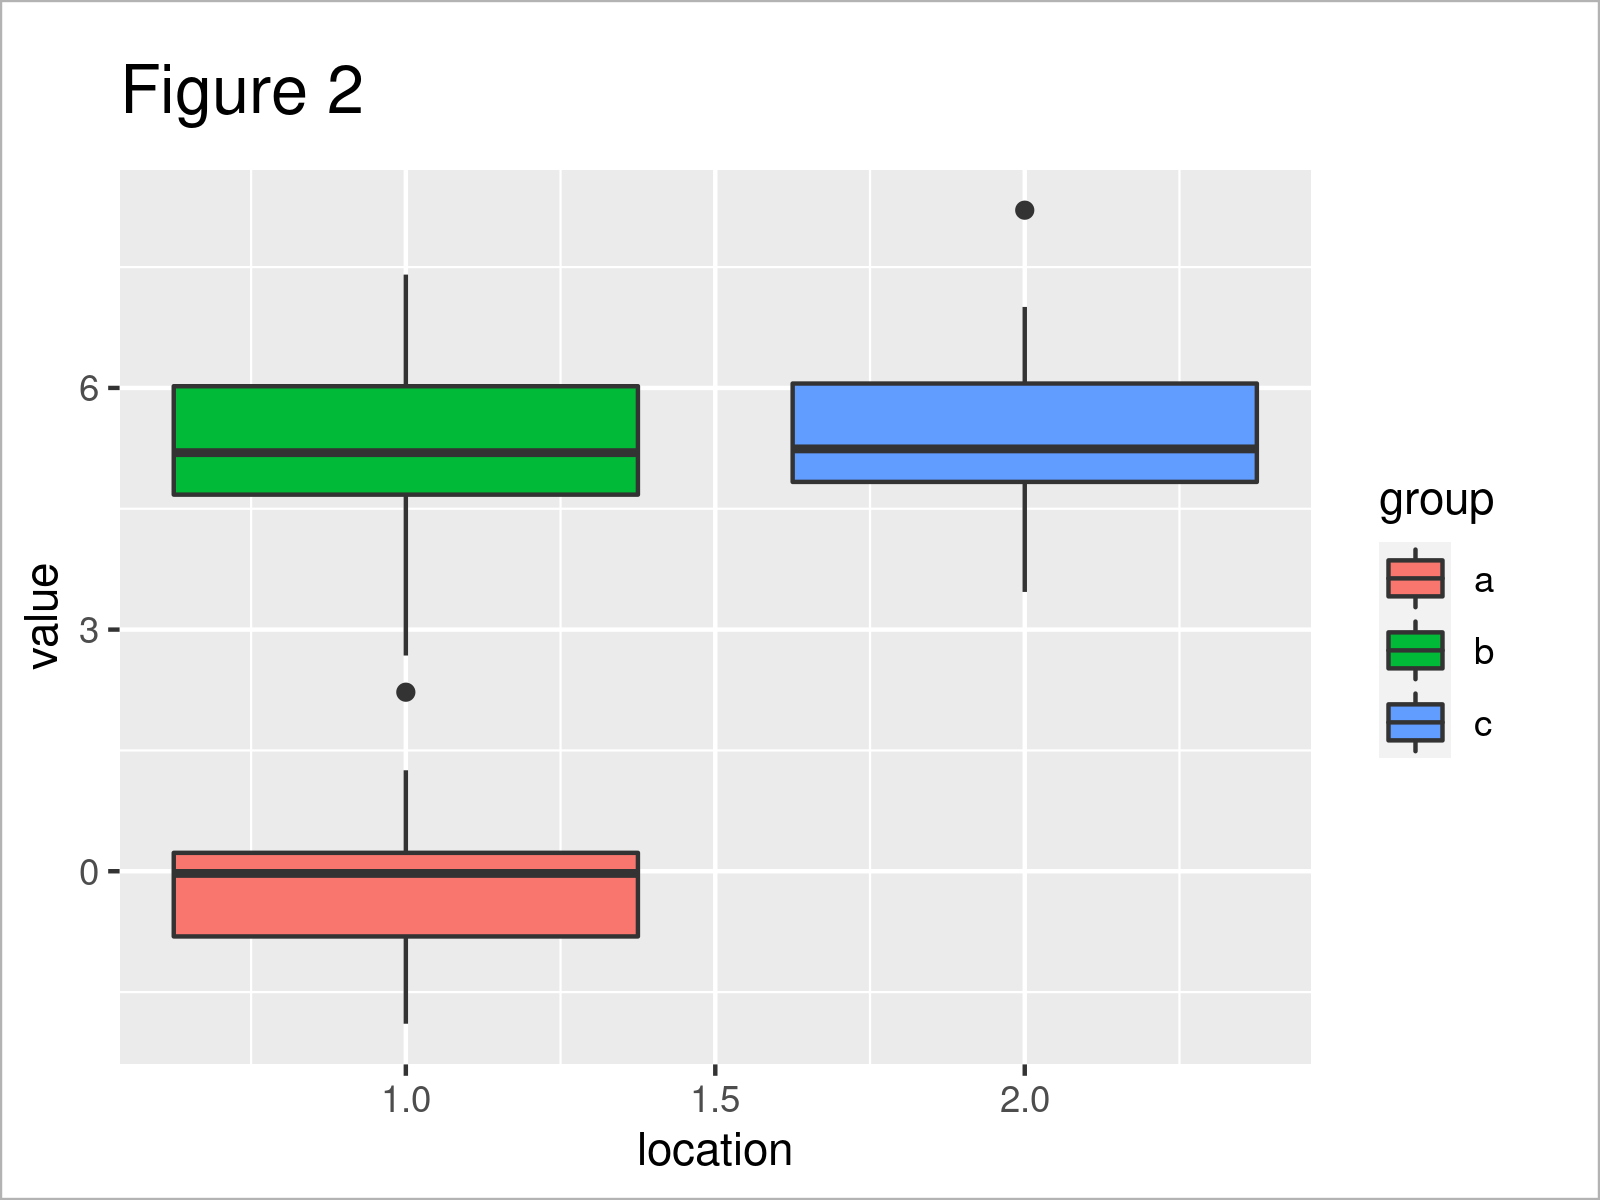
By running the previous R code we have created Figure 2, i.e. a ggplot2 boxplot with two boxes at the same x-axis location.
Video & Further Resources
Have a look at the following video which I have published on my YouTube channel. In the video, I explain the content of this tutorial in a programming session:
In addition, you may want to have a look at some of the related tutorials on my website.
- Draw Dates to X-Axis of Plot in R
- Draw Multiple Variables as Lines to Same ggplot2 Plot
- Draw ggplot2 Plot with Two Y-Axes in R
- Draw ggplot2 Plot with Factor on X-Axis
- Drawing Plots in R
- Introduction to R
This page has explained how to print multiple ggplot2 boxplots on the same axis location in R. If you have further questions and/or comments, let me know in the comments below. Furthermore, please subscribe to my email newsletter in order to receive regular updates on new articles.


