Print data.table Options in R (2 Examples)
In this tutorial, I’ll explain how to alter the way a data.table is printed in the R programming language.
The tutorial looks as follows:
With that, here’s the step-by-step process!
Exemplifying Data & Software Packages
First, we have to install and load the data.table package.
install.packages("data.table")           # Install & load data.table
library("data.table")
Next, we also need to define some data that we can use in the following examples:
data_1 <- data.table( A = 1:200,     # Create example data
                      B = rep(month.abb[1:10], 20),
                      C = seq(0, 1, length.out = 200) )
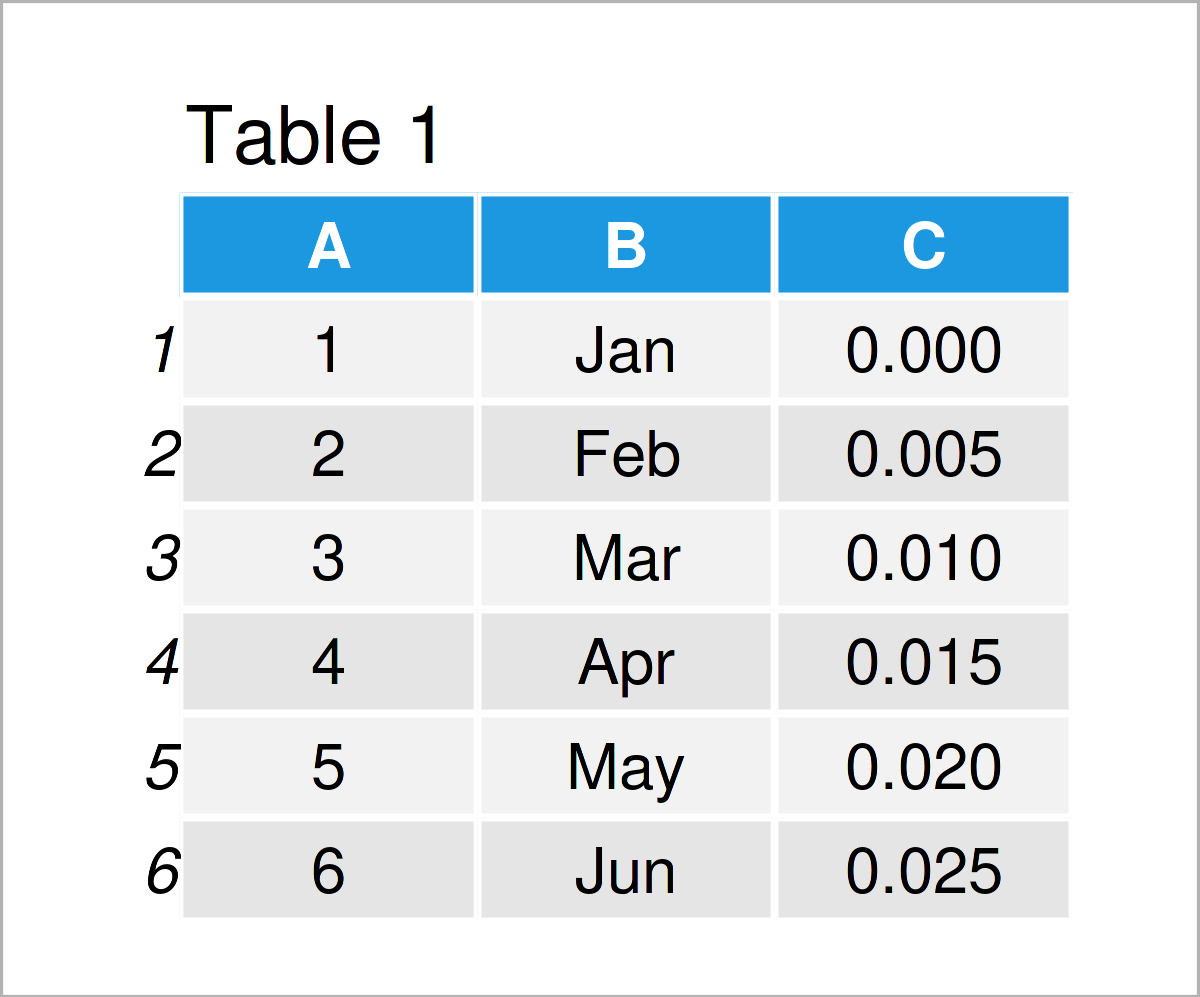
head(data_1)                         # Print head of data
See our post about the sequence function seq() here and the month names month.abb[] here.

Table 1 shows that our example data is constituted of three variables. The variable A is an integer, the variable B is a character, and the variable C is numerical.
Example 1: Print a data.table With Different Printing Options
There are different options for printing a data.table object. To see them, we can use ?print.data.table to open the help file of the print command for data.table objects.
?print.data.table  # See the printing options for a data.table
# ## S3 method for class 'data.table'
# print(x,
#       topn = getOption("datatable.print.topn"), # default: 5
#       nrows = getOption("datatable.print.nrows"), # default: 100
#       class = getOption("datatable.print.class"), # default: FALSE
#       row.names = getOption("datatable.print.rownames"), # default: TRUE
#       col.names = getOption("datatable.print.colnames"), # default: "auto"
#       print.keys = getOption("datatable.print.keys"), # default: FALSE
#       trunc.cols = getOption("datatable.print.trunc.cols"), # default: FALSE
#       quote = FALSE,
#       timezone = FALSE, ...)
When you scroll down in the help file, you find descriptions of each argument. Above, you can see the default printing settings for a data.table. So when you execute data_1 or print(data_1), you see the following output.
data_1                               # Print the data, equivalent to print(data_1)
#        A   B           C
#   1:   1 Jan 0.000000000
#   2:   2 Feb 0.005025126
#   3:   3 Mar 0.010050251
#   4:   4 Apr 0.015075377
#   5:   5 May 0.020100503
# ---
# 196: 196 Jun 0.979899497
# 197: 197 Jul 0.984924623
# 198: 198 Aug 0.989949749
# 199: 199 Sep 0.994974874
# 200: 200 Oct 1.000000000
For example, in the defaults we have topn set to 5, meaning that the first and last five data rows are printed and rownames set to TRUE meaning that the rownames are printed with the data.
To print a data.table with other settings, we can use the function arguments shown above (with ?print.data.table). In the following command, we take topn=2, meaning that we only want to print the first and last two data rows.
print(data_1, topn = 2)
#        A   B           C
#   1:   1 Jan 0.000000000
#   2:   2 Feb 0.005025126
# ---
# 199: 199 Sep 0.994974874
# 200: 200 Oct 1.000000000
In the next example, we additionally remove the row names by argument rownames=FALSE.
print(data_1, topn = 2, row.names = FALSE)
#   A   B           C
#   1 Jan 0.000000000
#   2 Feb 0.005025126
# ---
# 199 Sep 0.994974874
# 200 Oct 1.000000000
To make another example, let us use argument quote=TRUE to print all data in quotation marks.
print(data_1, topn = 2, quote = TRUE)
#        "A"   "B"           "C"
#   1: "  1" "Jan" "0.000000000"
#   2: "  2" "Feb" "0.005025126"
# ---    ""    ""            ""
# 199: "199" "Sep" "0.994974874"
# 200: "200" "Oct" "1.000000000"
Example 2: Change Global Printing Options of data.table
Instead of using the arguments of function print() to determine the way a data.table is displayed, we can also change the global printing settings. As an example, we take datatable.print.class = TRUE to print the classes of each column, datatable.print.rownames = FALSE to remove the row names, and datatable.print.topn = 2 to only show the first and last two data rows.
options(datatable.print.class = TRUE,    # Change global options of data.table
        datatable.print.rownames = FALSE,
        datatable.print.topn = 2)
Now that we changed the global options, we can use print(data_1) to print the data with the new global settings.
print(data_1)
#         A      B           C
#     <int> <char>       <num>
#         1    Jan 0.000000000
#         2    Feb 0.005025126
# ---
#       199    Sep 0.994974874
#       200    Oct 1.000000000
Video, Further Resources & Summary
Data.table in R is great! Take a look at our data.table overview post here and the data.table Gitlab page. There is also a great post about data.table on R-bloggers.
Do you need further info on the R programming codes of this article? Then I recommend having a look at the following video on my YouTube channel. I illustrate the R programming syntax of this tutorial in the video.
The YouTube video will be added soon.
Furthermore, you may want to read some other articles on this website:
- Convert data.table to Data Frame & Matrix in R (4 Examples)
- Create Empty data.table with Column Names in R (2 Examples)
- Join data.tables in R – Inner, Outer, Left & Right (4 Examples)
- Reshape data.table in R (3 Examples)
- Compare Columns of data.table in R (5 Examples)
- R Programming Tutorials
Summary: In this tutorial, I have demonstrated how to change the printing options of data.table in the R programming language. Don’t hesitate to let me know in the comments, if you have any further questions.
This page was created in collaboration with Anna-Lena Wölwer. Have a look at Anna-Lena’s author page to get further information about her academic background and the other articles she has written for Statistics Globe.


