Reshape data.table in R (3 Examples)
In this R tutorial you’ll learn how to use the reshape function on a data.table. For general information concerning data.table, have a look at our Statistics Globe Post here and the information on CRAN here.
The tutorial is structured as follows:
If you want to learn more about these contents, keep reading!
Example Data & Packages
We first have to install and load the data.table software package:
install.packages("data.table")                   # Install data.table package
library("data.table")                            # Load data.table
Furthermore, consider the exemplifying data below:
set.seed(8)
dat_1 <- data.table(expand.grid("ID"   = 1:3,    # Create example data
                                "obs"  = 1:4))
dat_1 <- cbind(dat_1,                            # Add values to the example data
               "value" = rnorm(nrow(dat_1)))
head(dat_1)                                      # Print data head
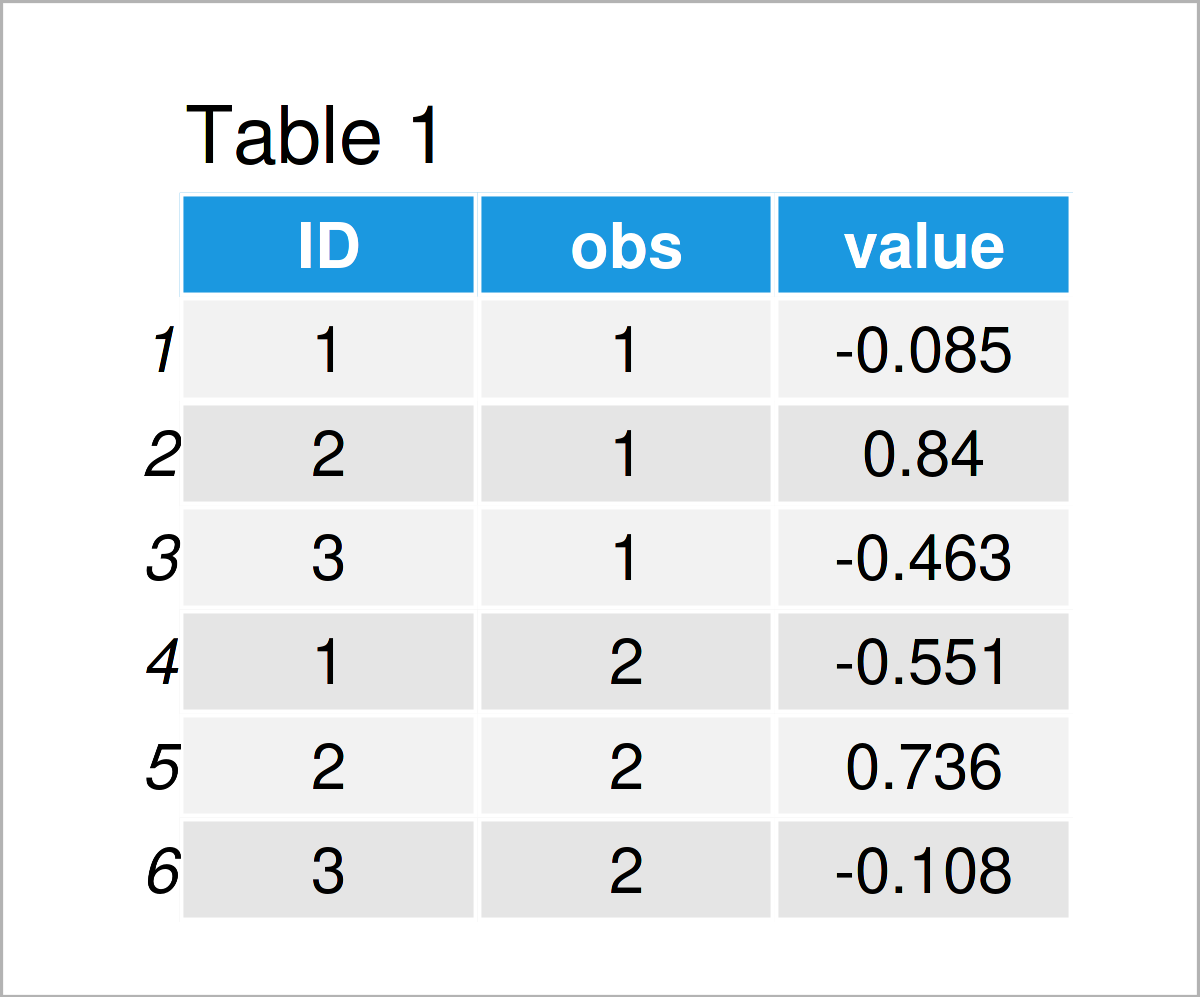
Have a look at the table that has been returned after executing the previous R syntax. It shows the first six rows of our example data, and that our data consists of three columns. We created the data in the long format. That is, for each ID (for example a person), we have one row per observation (for example observations at different occasions).
Example 1: Reshape Function: Long to Wide Format
Example 1 demonstrates how to transform the data such that we have it in a wide format instead of a long format. We use the reshape() function for that. As input, we clarify the ID variable (ID), the time variable (obs) and in which direction we want to transform the data (wide).
dat_2 <- reshape(dat_1,                          # Reshape data from long to wide format
                 timevar   = "obs",
                 idvar     = "ID",
                 direction = "wide")
dat_2                                            # Print data
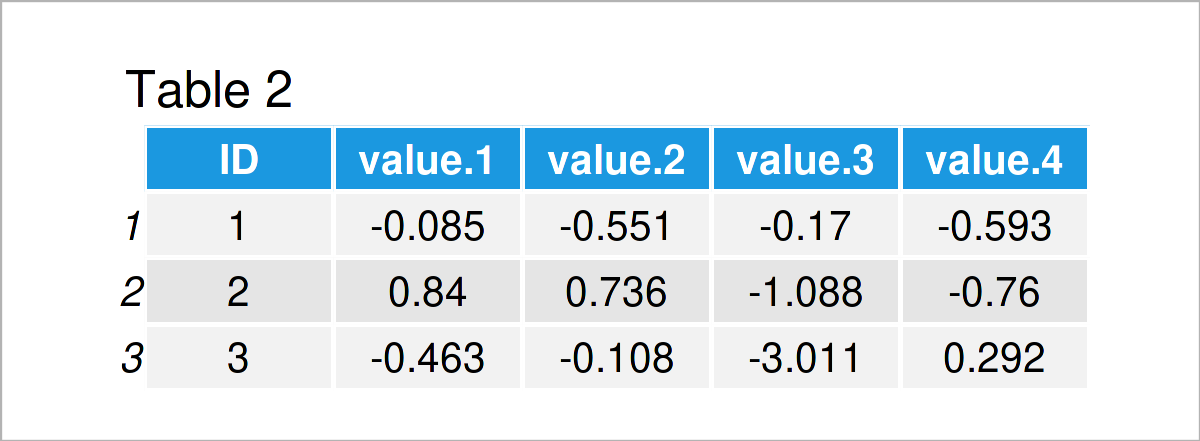
In Table 2 it is shown that we have constructed a data.table in a wide format. Now, we have only one data row per ID. If you also work with data.frames, you might also want to take a look at our post about reshaping data.frames here and here.
In Table 2, the new columns have their default names. We show you another example below, where we explicitly choose the names of the new columns with function inputs v.names and sep.
dat_3 <- reshape(dat_1,                          # Reshape data from long to wide format
                 timevar   = "obs",
                 idvar     = "ID",
                 direction = "wide",
                 v.names   = "value",
                 sep       = "_")
dat_3                                            # Print data
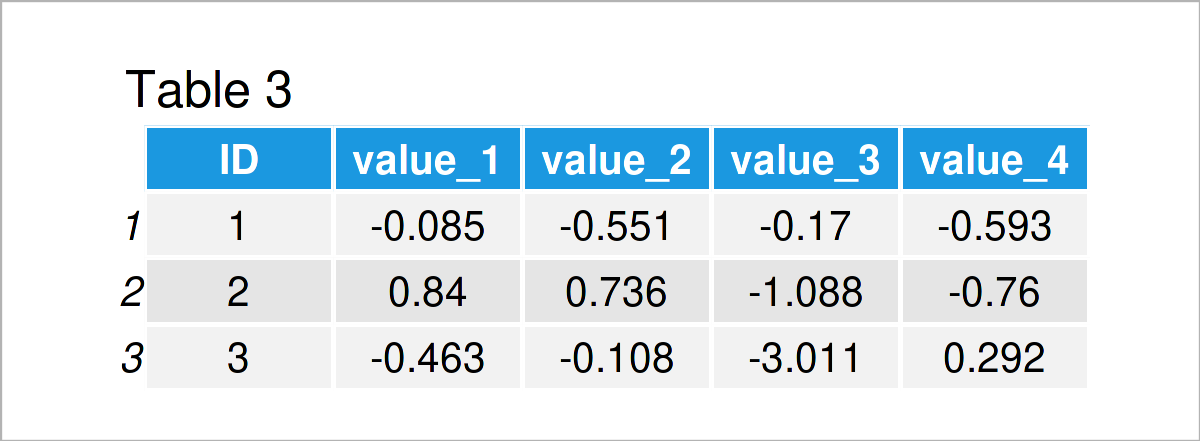
As shown in Table 3, we have managed to construct a data.table in the wide format, in which we explicitly selected the names of the new columns.
Example 2: Reshape Function: Wide to Long Format
The following R programming syntax illustrates how to transform the data from the wide format (data.table dat_3) to the long format. We again use the function reshape(), only that now we set direction = “long”.
dat_4 <- reshape(dat_3,                          # Reshape data from wide to long format
                 idvar     = "ID",
                 direction = "long")
head(dat_4)                                      # Print head of data
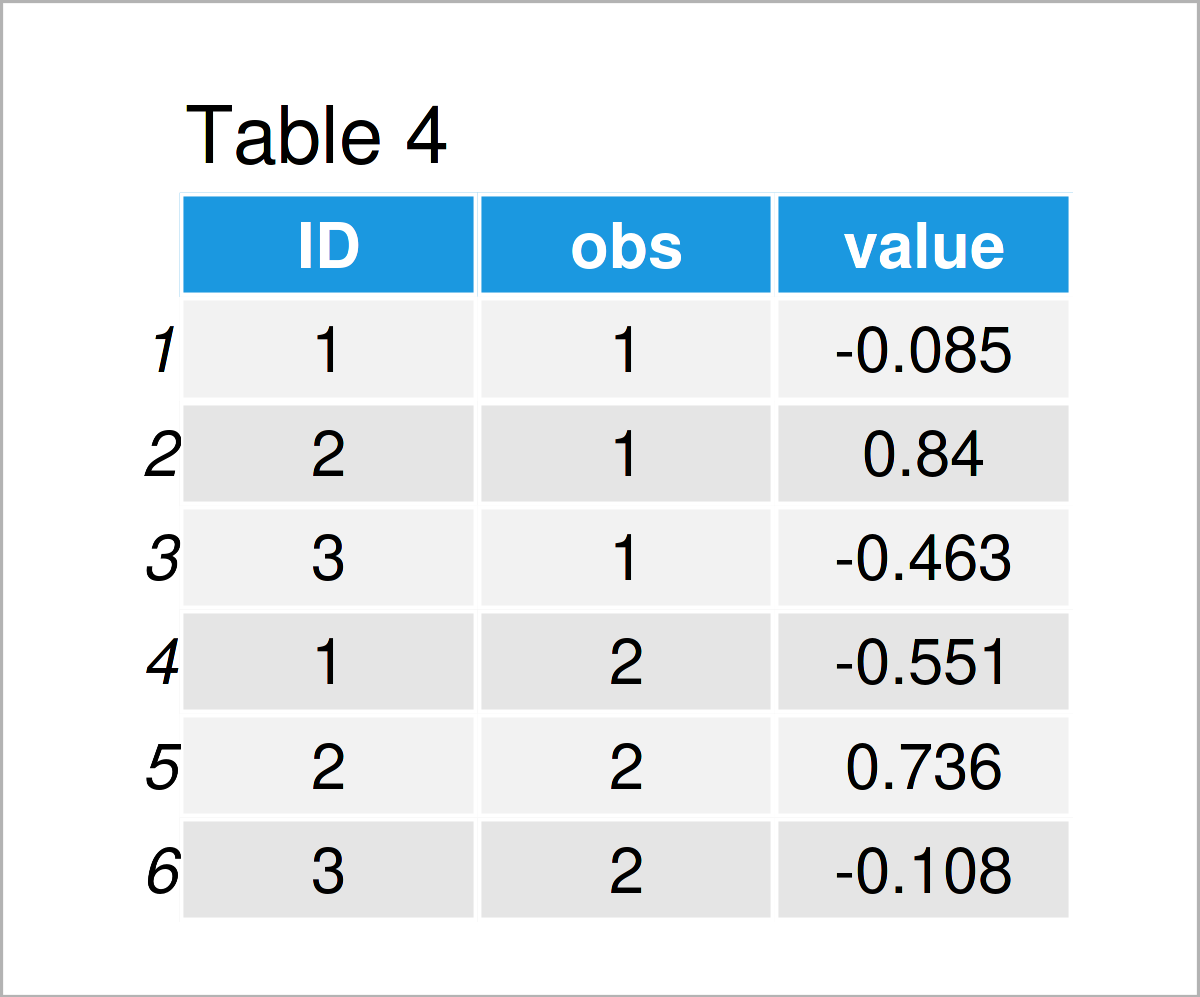
Table 4 shows the output of the previous R programming code – We again received the data in the long format, similar to Table 1.
Example 3: Reshape Function: Long to Wide Format For Unbalanced Data
Often, we have data in a long format which is unbalanced. For example, we might not have observed all individuals at all points. Example 3 demonstrates how to transform data with such an unbalanced block design from long into wide format. We can simply use the reshape() function as done before, the missing values are set to NA.
dat_5 <- dat_1[ -c(1,4), ]                       # Delete certain rows from the data to imitate unbalanced data
dat_6 <- reshape(dat_5,                          # Reshape data from long to wide format
                 timevar   = "obs",
                 idvar     = "ID",
                 direction = "wide")
dat_6                                            # Print data
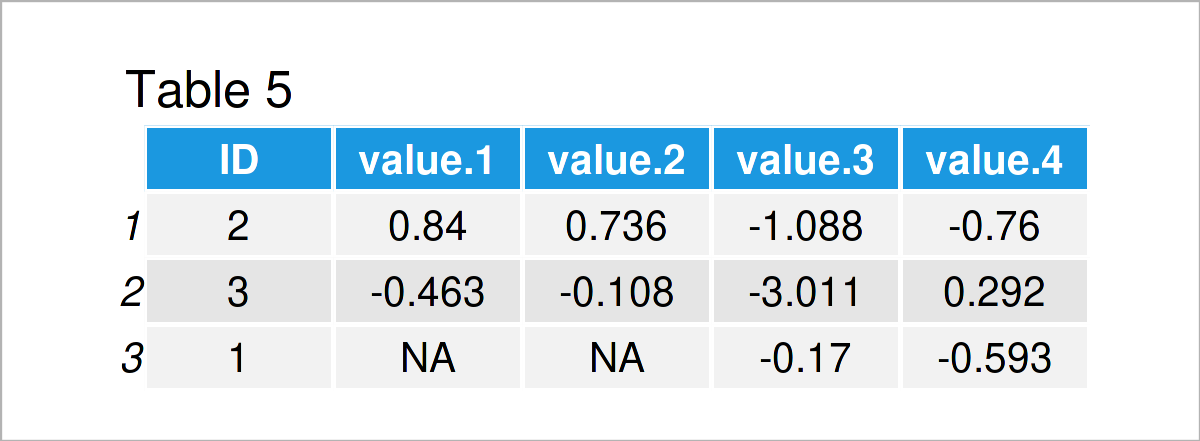
In Table 5 it is shown that we have constructed a data.table in the wide format, any missing values were set to NA.
Video, Further Resources & Summary
There are more options to transform data.tables. For example, you can use the function dcast(). Furthermore, on this CRAN page, several data manipulation options are shown.
If you need more explanations on the R syntax of this article, I can recommend watching the following video on my YouTube channel. In the video, I show the R syntax of this post:
The YouTube video will be added soon.
In addition, you could read some related articles on https://statisticsglobe.com/.
- Join data.tables in R – Inner, Outer, Left & Right (4 Examples)
- Delete Column of data.table by Index in R (2 Examples)
- Sort Rows of data.table in R (3 Examples)
- Group data.table by Multiple Columns in R (Example)
- Introduction to R
In this article, you have learned how to transform a data.table from wide to long format and long to wide format using the reshape function in the R programming language. Please let me know in the comments section below, if you have additional questions.
This page was created in collaboration with Anna-Lena Wölwer. Have a look at Anna-Lena’s author page to get further details about her academic background and the other articles she has written for Statistics Globe.


