Convert data.table to Data Frame & Matrix in R (4 Examples)
In this post, you’ll learn how to transform a data.table to a data.frame and a matrix (and vice versa) in the R programming language. For a general overview of data.table, take a look at our blog post here. You can also combine the information in this post with our post here to convert a time series to a data.table and the other way around.
Table of contents:
Let’s get started…
Example Data & Software Packages
First, we have to install and load the data.table package.
install.packages("data.table")    # Install & load data.table package
library("data.table")
If you did not work with data.tables before, we recommend you to take a look at the R project introduction here and the data.table gitlab page here.
The following data is used as a basis for this R tutorial:
DT_1 <- data.table("v1" = 1:4,    # Create a data.table
                   "v2" = letters[1:4],
                   "v3" = c(T, F, F, T))
head(DT_1)                        # Print first rows of data
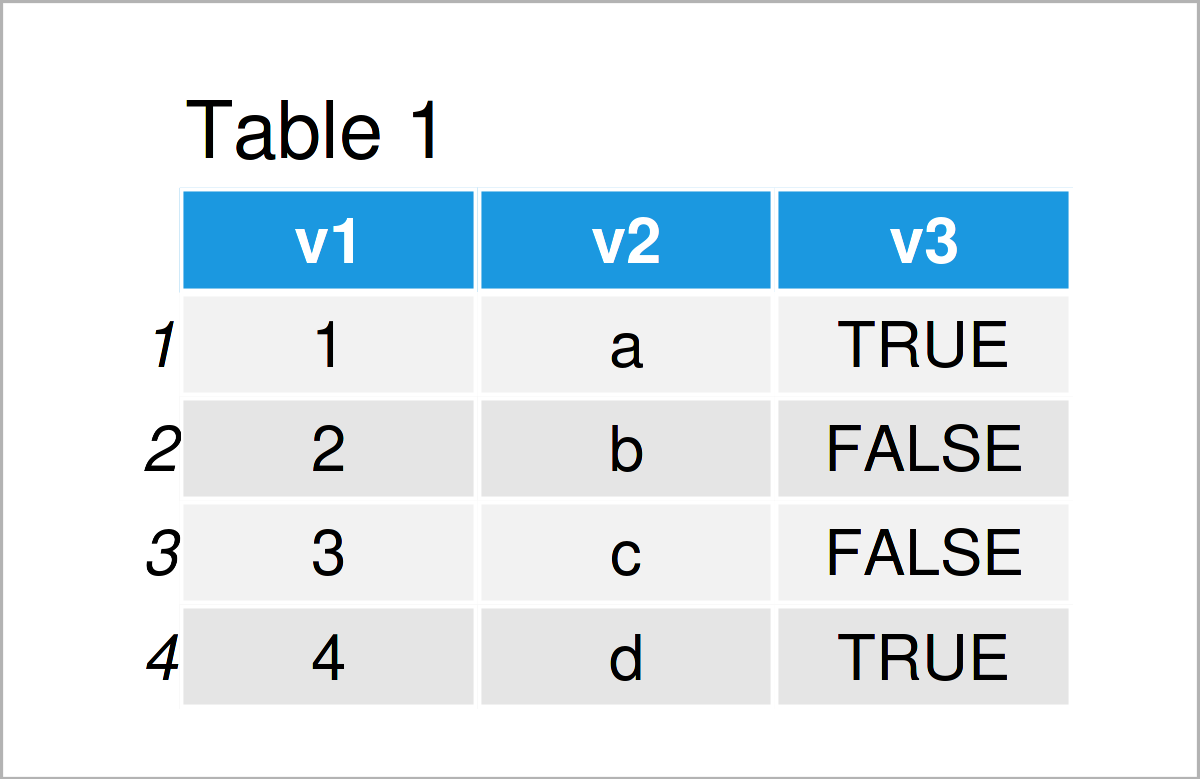
As you can see based on Table 1, our example data is a data table and consists of three columns. We create a second example data.table which contains only numeric columns.
DT_2 <- data.table("v1" = 1:4,    # Create a data.table
                   "v2" = 5:8,
                   "v3" = seq(1, 1.75, by = .25))
head(DT_2)                        # Print first rows of data
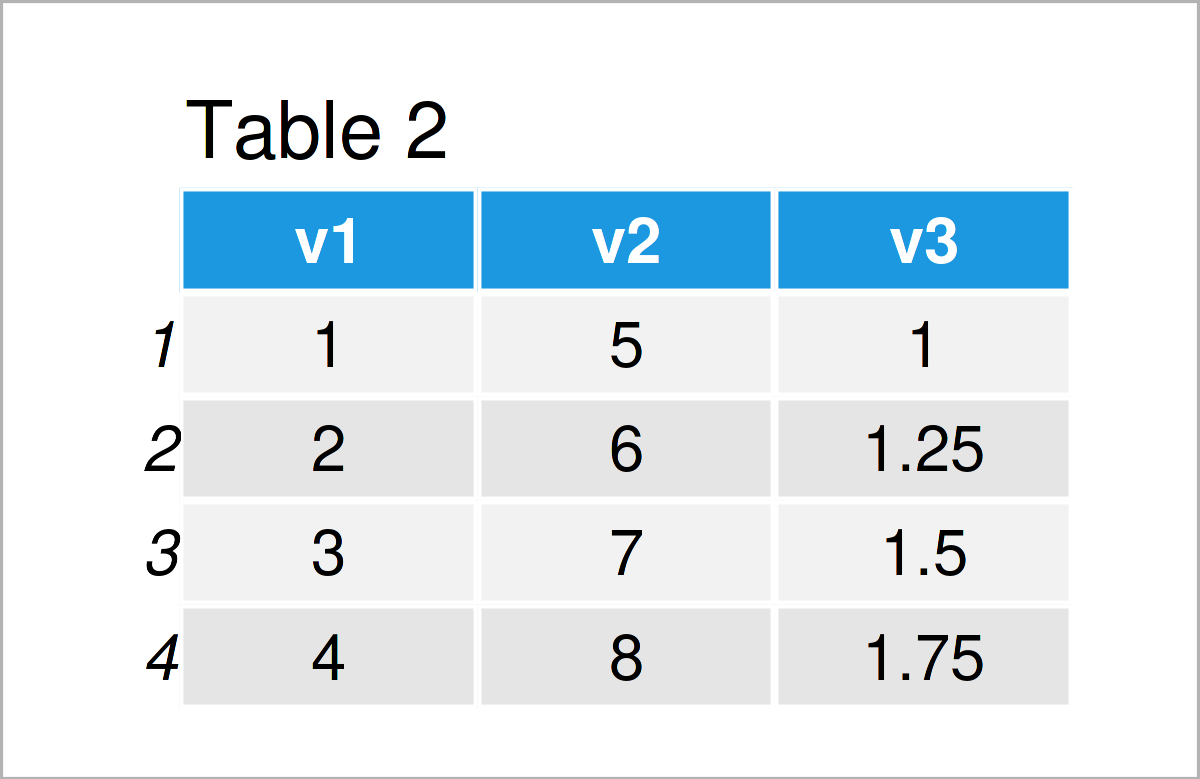
The output of the previous code is shown in Table 2: a data.table with three numeric columns.
Example 1: Transform data.table to data.frame
In Example 1, I’ll show how to convert a data.table to a data.frame using the function as.data.frame().
str(DT_1)                         # Display the structure of the data
# Classes ‘data.table’ and 'data.frame':	4 obs. of  3 variables:
#  $ v1: int  1 2 3 4
#  $ v2: chr  "a" "b" "c" "d"
#  $ v3: logi  TRUE FALSE FALSE TRUE
#  - attr(*, ".internal.selfref")=<externalptr>

DF_1 <- as.data.frame(DT_1)       # Coerce to a data.frame
str(DF_1)                         # Display the structure of the data
# 'data.frame':	4 obs. of  3 variables:
#  $ v1: int  1 2 3 4
#  $ v2: chr  "a" "b" "c" "d"
#  $ v3: logi  TRUE FALSE FALSE TRUE

head(DF_1)                        # Print first rows of data
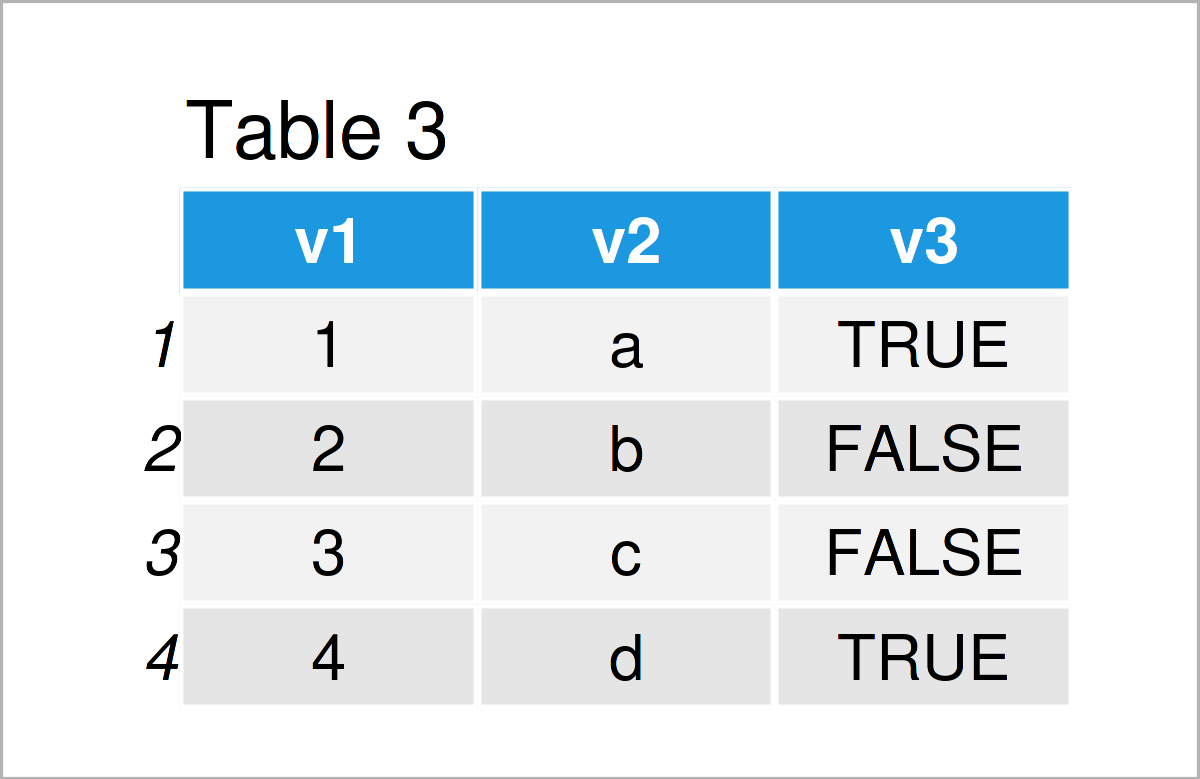
As shown in Table 3, we have created a data.frame with the previous R programming code. You see that data frames and data tables have a very similar structure in R.
Example 2: Transform data.frame to data.table
This example illustrates how to alter the structure of a data.frame to a data.table using the function as.data.table().
DT_1b <- as.data.table(DF_1)      # Coerce to data.table
str(DT_1b)                        # Display the structure of the data
# Classes ‘data.table’ and 'data.frame':	4 obs. of  3 variables:
#  $ v1: int  1 2 3 4
#  $ v2: chr  "a" "b" "c" "d"
#  $ v3: logi  TRUE FALSE FALSE TRUE
#  - attr(*, ".internal.selfref")=<externalptr>

head(DT_1b)                       # Print first rows of data
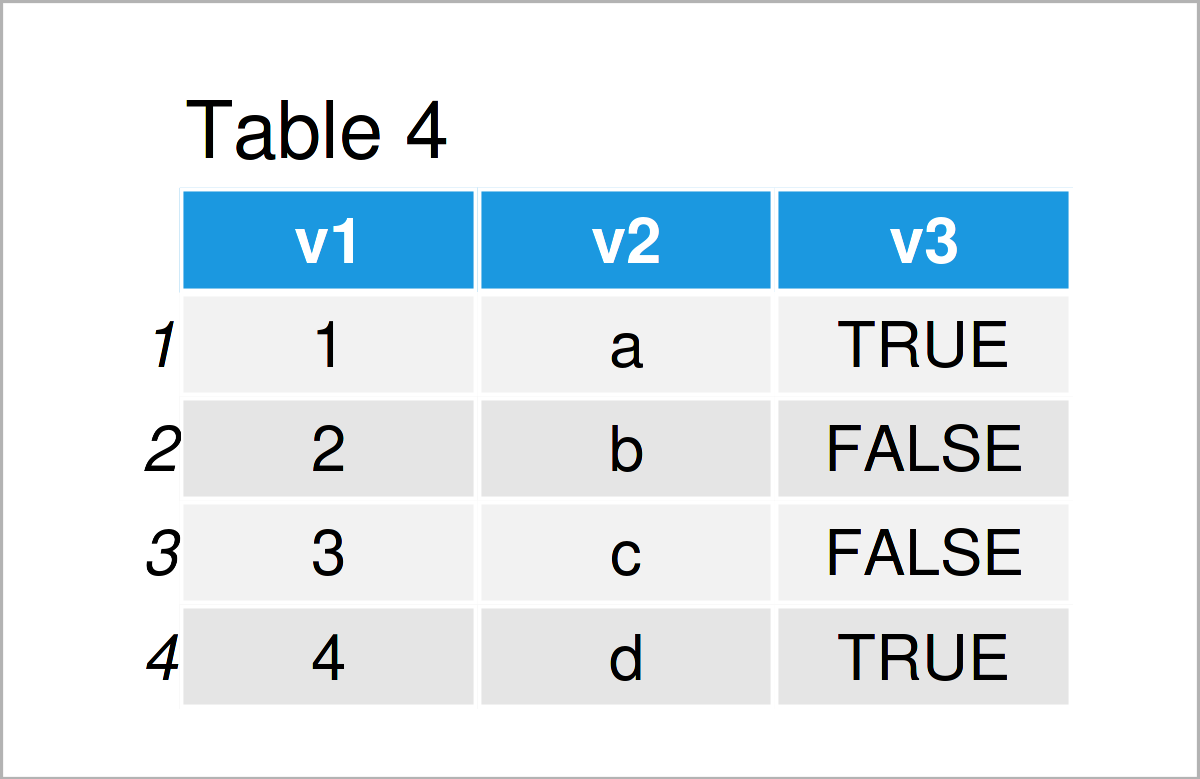
As revealed in Table 4, we have managed to construct a data.table by executing the previous R programming syntax.
Example 3: Transform data.table to Matrix
This example explains how to modify a data.table to a matrix. Note that for this conversion we only consider data.tables with purely numeric values. If there is even one non-numeric column, all cells of the resulting matrix will be formed as characters. In this post, you can see how to select the numeric columns of a data.table or data.frame.
str(DT_2)                         # Display the structure of the data
# Classes ‘data.table’ and 'data.frame':	4 obs. of  3 variables:
#  $ v1: int  1 2 3 4
#  $ v2: int  5 6 7 8
#  $ v3: num  1 1.25 1.5 1.75
#  - attr(*, ".internal.selfref")=<externalptr>

mat_2 <- as.matrix(DT_2)          # Convert a data.table to a matrix
str(mat_2)                        # Display the structure of the data
#  num [1:4, 1:3] 1 2 3 4 5 6 7 8 1 1.25 ...
#  - attr(*, "dimnames")=List of 2
#   ..$ : NULL
#   ..$ : chr [1:3] "v1" "v2" "v3"

head(mat_2)                       # Print first rows of data
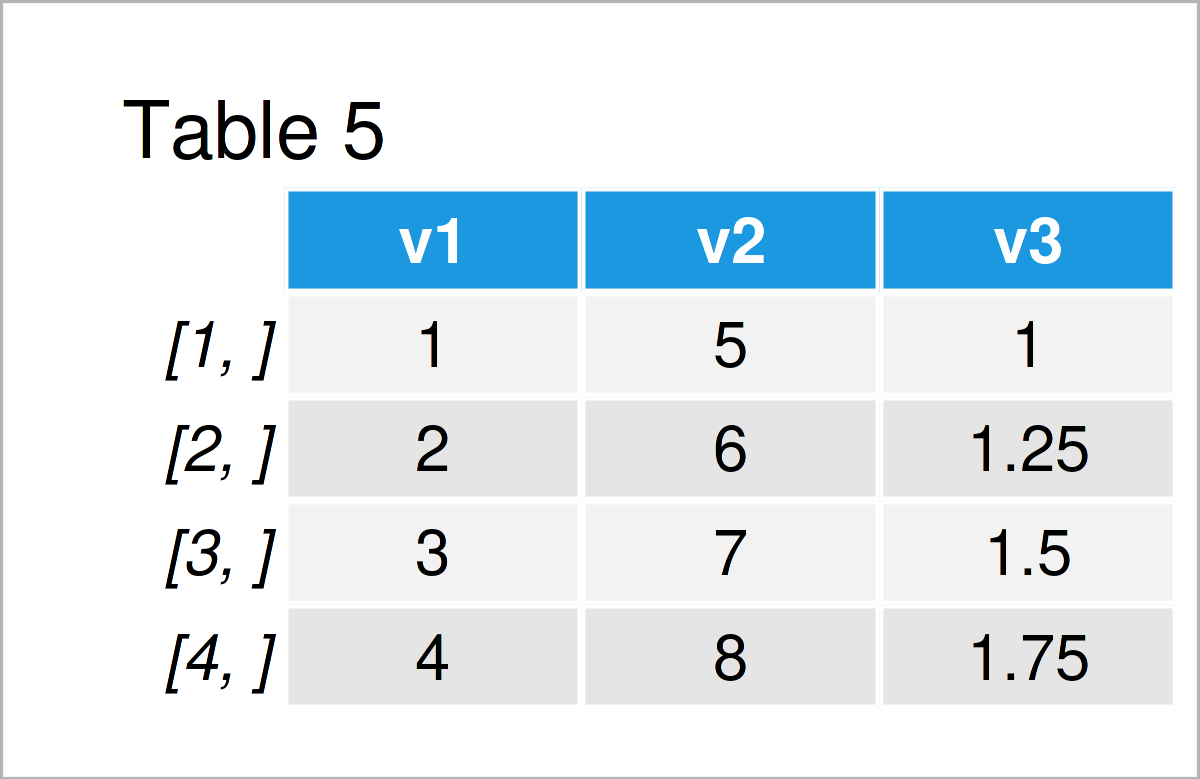
As shown in Table 5, we have constructed a matrix from a data.table by use of function as.matrix().
Example 4: Transform Matrix to data.table
In Example 4, I’ll explain how to transform a matrix into a data.table, using the function as.data.table().
DT_2b <- as.data.table(mat_2)     # Coerce to data.table
str(DT_2b)                        # Display the structure of the data
# Classes ‘data.table’ and 'data.frame':	4 obs. of  3 variables:
#  $ v1: num  1 2 3 4
#  $ v2: num  5 6 7 8
#  $ v3: num  1 1.25 1.5 1.75
#  - attr(*, ".internal.selfref")=<externalptr>

head(DT_2b)                       # Print first rows of data
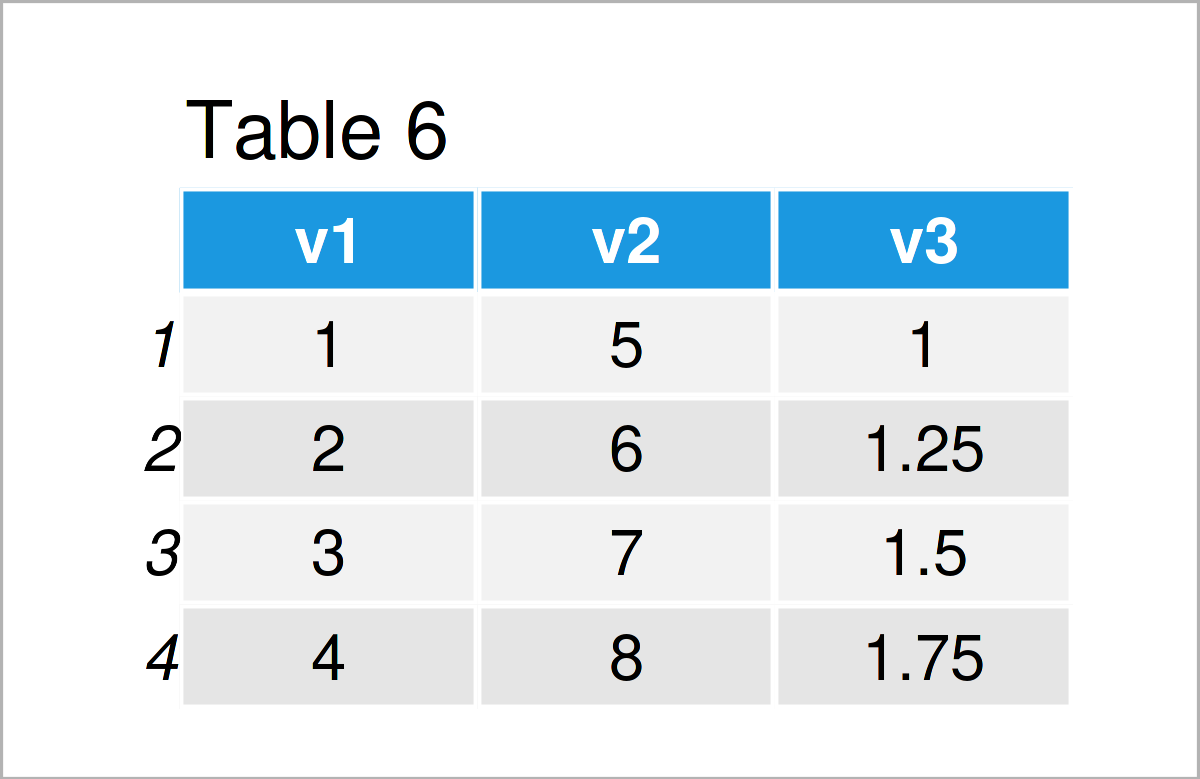
The output of the previous R code is shown in Table 6: A data.table with three numeric columns.
Video, Further Resources & Summary
Would you like to learn more about the conversion from a data.table to a data.frame or a matrix? Then I recommend having a look at the following video on my YouTube channel. In the video, I’m explaining the R codes of this article in RStudio.
The YouTube video will be added soon.
In addition, you may have a look at the other articles on my website. You can find a selection of articles on topics such as matrices and data conversion below:
- Aggregate data.table by Group in R (2 Examples)
- Convert Nested Lists to Data Frame or Matrix
- Convert Matrix to Data Frame in R
- Convert Data Frame to Matrix in R
- The R Programming Language
This article has illustrated how to change the structure of a data.table to a data.frame and a matrix in the R programming language. Please tell me about it in the comments section, if you have any further questions.
This page was created in collaboration with Anna-Lena Wölwer. Have a look at Anna-Lena’s author page to receive further details about her academic background and the other articles she has written for Statistics Globe.


