Compare Columns of data.table in R (5 Examples)
This tutorial demonstrates how to make comparisons of the columns of two data.table objects in the R programming language. For example, we may be interested in whether and how many of the data rows in two data.tables contain information about the same people.
The article consists of five examples, each of which shows a different comparison. More precisely, the page looks as follows:
Here’s how to do it.
Example Data & Software Packages
We first have to install and load the data.table package, to apply the functions that are contained in the package:
install.packages("data.table")                     # Install data.table package
library("data.table")                              # Load data.table
Make sure to visit our data.table overview page here for more information on the package and different tutorials. The official R documentation of the functions of the data.table package can be found here, the CRAN page here, and the github page here.
Next, we’ll also have to construct some example data:
DT1 <- data.table( ID = 1:4,
                   B = letters[1:4],
                   C = seq(.25, 1, length.out = 4) )
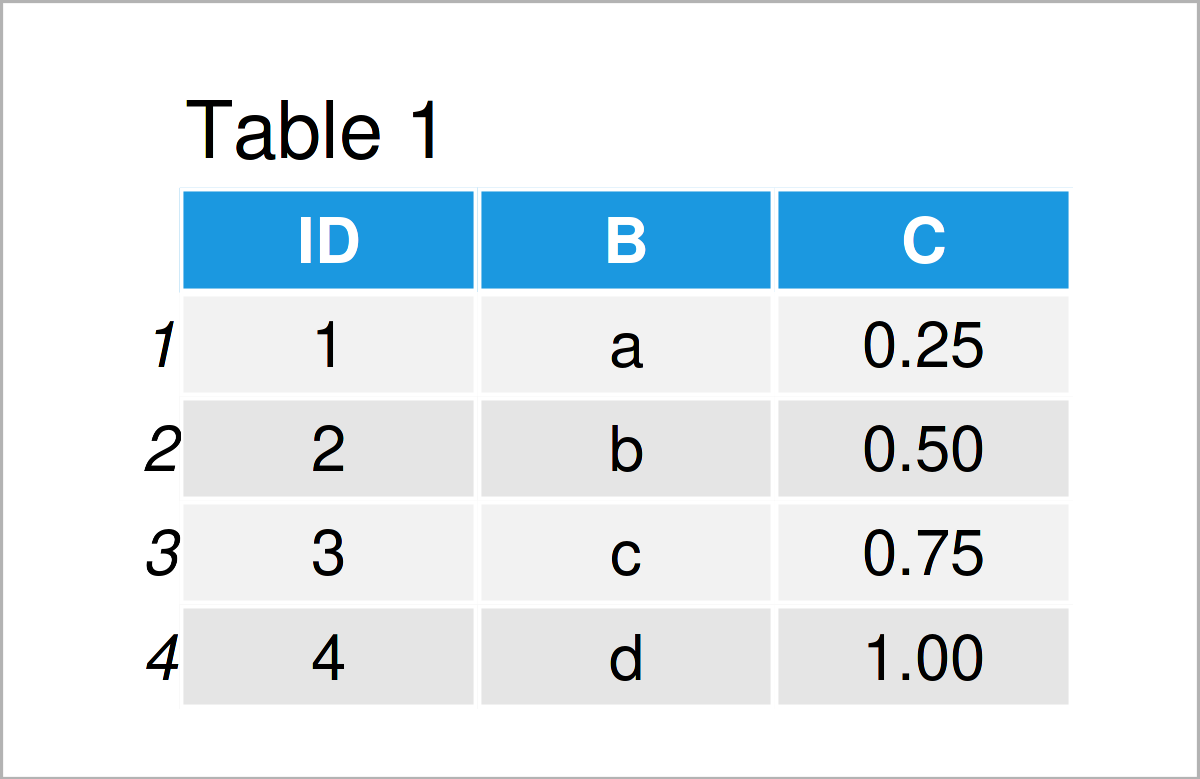
DT1

Have a look at the table that got returned after running the previous syntax. It shows that our example data is constructed of four rows and three columns. The variable ID is an integer, the variable B has the character class, and the variable C is numerical.
We generate a second data.table DT2.
DT2 <- data.table( ID = 4:5,
                   B = letters[4:5],
                   C = seq(1, 1.25, length.out = 2) )
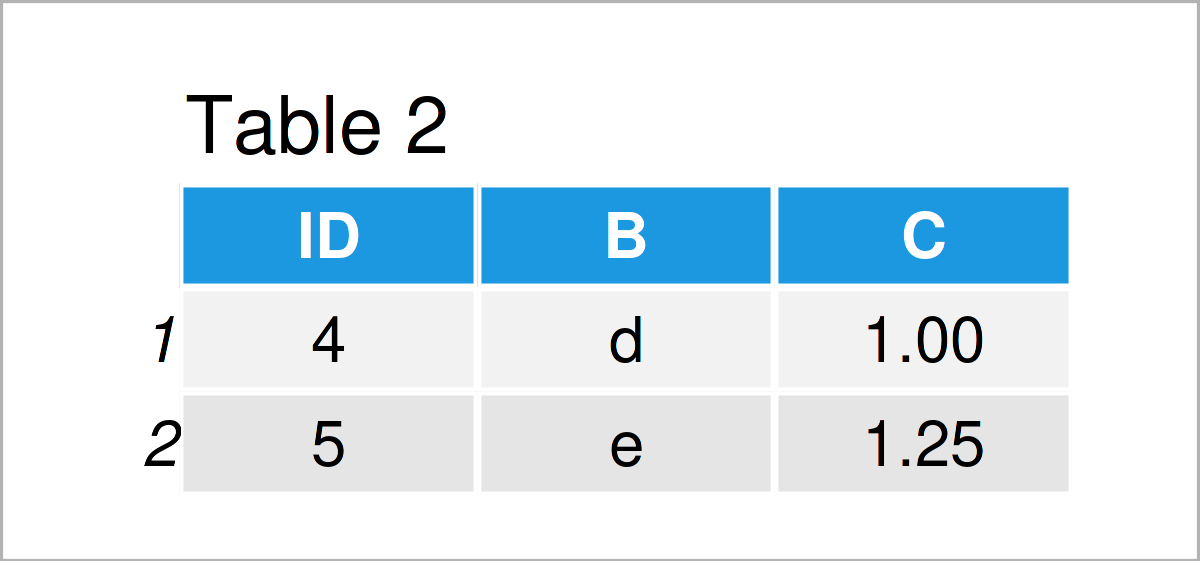
DT2

By running the previous syntax, we have created Table 2, i.e. a data.table with the same structure and variable types and names as DT1, but different values.
For generating the data of the two data.tables, we used different functions. Take a look here for information on letters[] and here for information on the generation of sequences with seq().
Example 1: How Many Rows Correspond To The Same IDs?
In this example, I’ll show how many of the IDs contained in one data.table are also contained in another.
table(DT1$ID %in% DT2$ID)                          # How many of the IDs of DT1 are in DT2?
# FALSE  TRUE
#     3     1
One of the four unique IDs in DT1 is also present in DT2.
table(DT2$ID %in% DT1$ID)                          # How many of the IDs of DT2 are in DT1?
# FALSE  TRUE
#     1     1
One of the two unique IDs in DT2 is also present in DT1.
Example 2: Position of IDs of One data.table Which Also Appear in Another
In this example, I’ll show how to evaluate the position of the IDs of one dataset which appear in another.
which(DT1$ID %in% DT2$ID)                          # Position of IDs of DT1 which appear in DT2
# [1] 4
The ID in data row 4 of DT1 is also present in DT2.
Example 3: Which IDs of One data.table Appear in Another
Example 3 explains how to see the value of the IDs of one dataset which appear in another.
DT1$ID[DT1$ID %in% DT2$ID]                         # IDs of DT1 which appear in DT2
# [1] 4
The ID with value 4 appears in both, DT1 and DT2.
Example 4: Get Rid of Duplicate Rows of One or Multiple data.table Objects
In this example, I’ll illustrate how to merge the information of two data.tables and get rid of duplicate information.
DT_12 <- merge.data.table(DT1, DT2, all = TRUE)    # Merge two data.tables
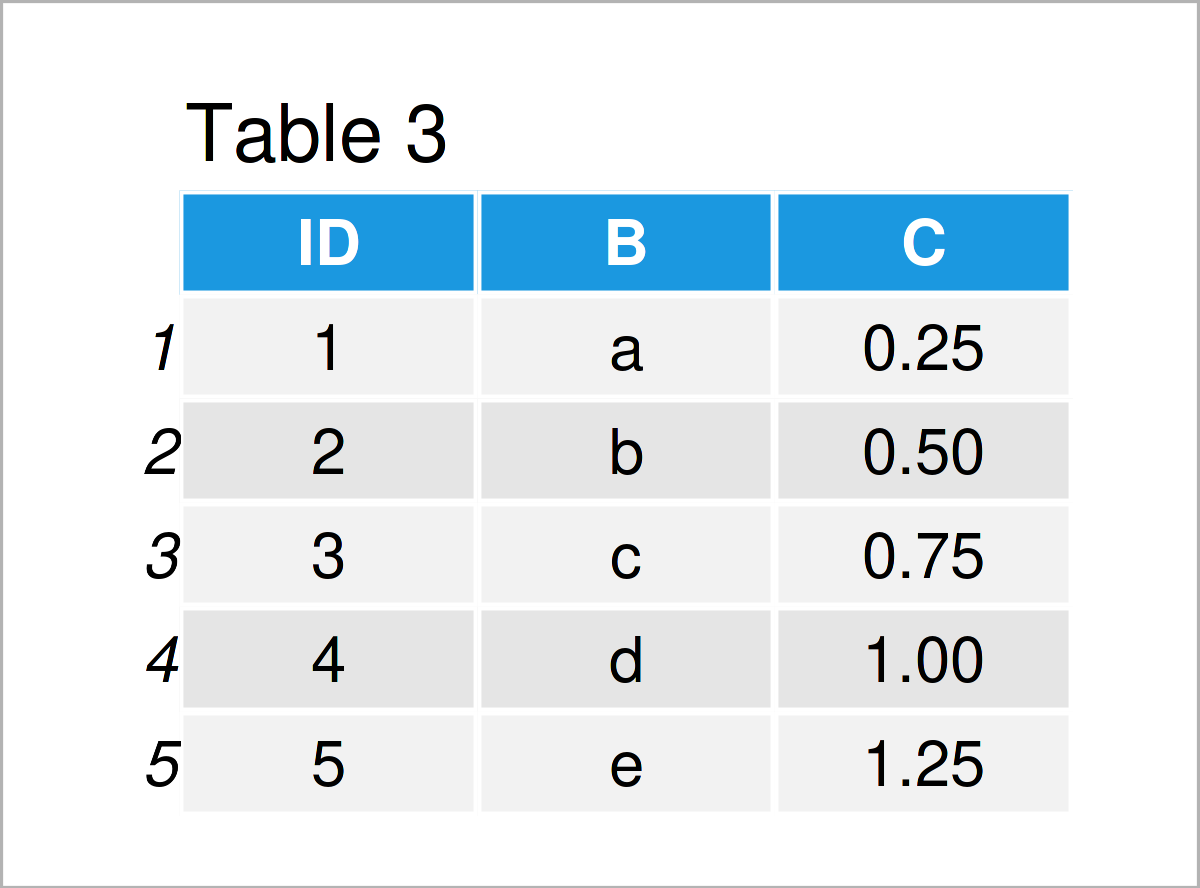
DT_12

As shown in Table 3, the previous code has created a data.table. With argument all = TRUE, function merge.data.table() joins the information of two data.tables and removes duplicate information. That is, both DT1 and DT2 contained the same information on ID=4, but only one data row appears for ID=4 in the merged data.table DT_12.
Example 5: Get Number of Exact Duplicate Rows of Two data.tables
The following R programming syntax demonstrates how to output the number of data rows which are exact duplicates in two data.tables. In the first step, we stack the information of the two data.tables DT1 and DT2 on top of each other. That is: They are combined row-wise.
DT_12b <- rbindlist(list(DT1, DT2))                # Row-wise Combine Two data.tables
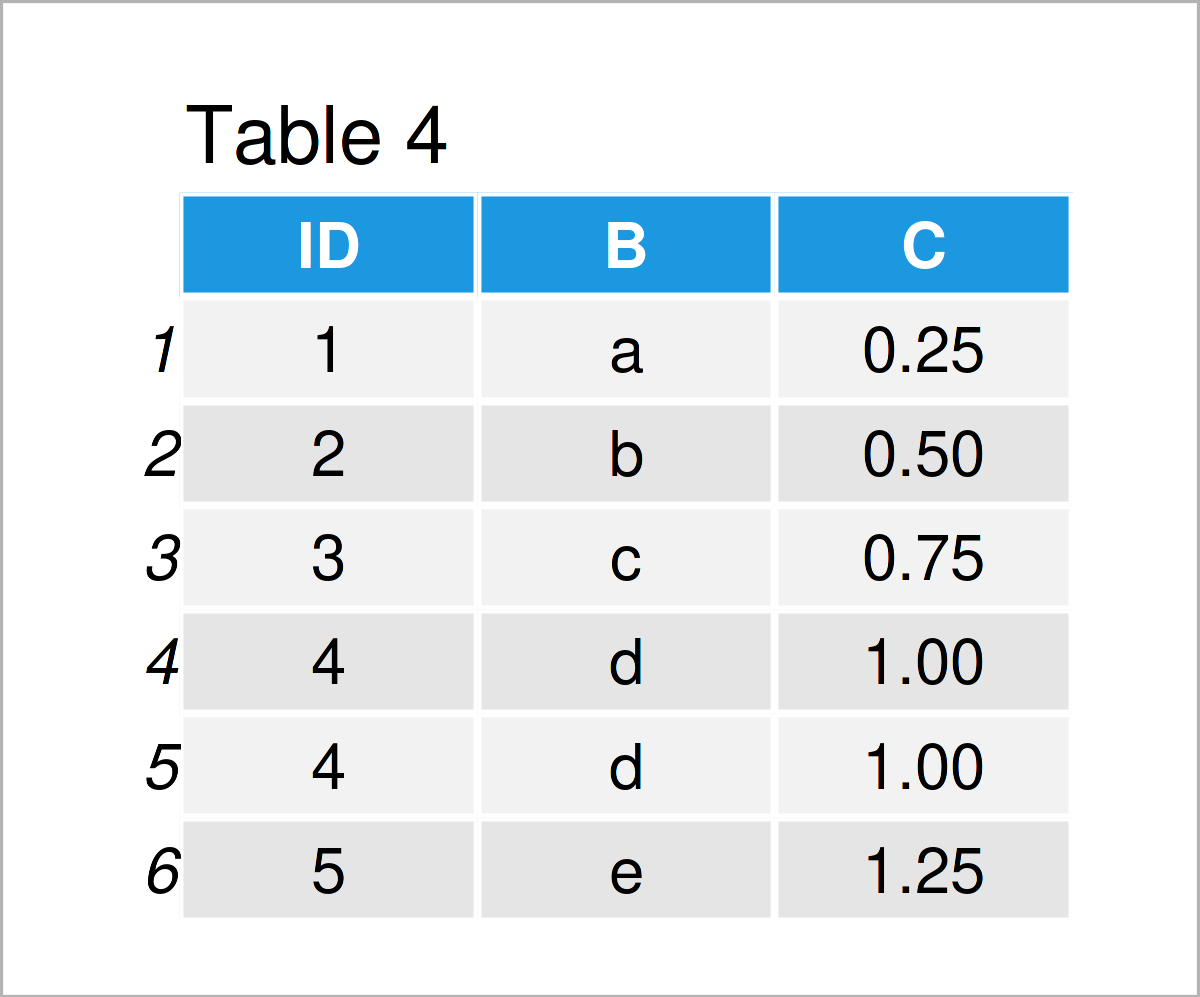
DT_12b

In Table 4 the row-wise combination of the two data.tables is shown. You can see that there is a duplicate data row with ID=4.
We use function duplicated() which returns a logical vector indicating whether the information of a data row is a duplicate of a previous data row. To get the number of duplicates, we take the sum (sum()) of this vector.
sum(duplicated(DT_12b))                            # Number of duplicate rows
# [1] 1
Video, Further Resources & Summary
Have a look at the following video on my YouTube channel. In the video, I explain the R programming codes of this tutorial.
The YouTube video will be added soon.
In addition, you might want to read the other tutorials on this website:
- Summarize Multiple Columns of data.table by Group
- Add Multiple New Columns to data.table
- Rename Columns of data.table in R
- Group data.table by Multiple Columns
- R Programming Overview
In this R article, you have learned how to make different comparisons of the columns of two data.tables. In case you have any additional questions, please let me know in the comments section.
This page was created in collaboration with Anna-Lena Wölwer. Have a look at Anna-Lena’s author page to get further information about her academic background and the other articles she has written for Statistics Globe.


