Join data.tables in R – Inner, Outer, Left & Right (4 Examples)
This article explains how to combine multiple data.tables in the R programming language.
The content is structured as follows:
Let’s dive right into the exemplifying R code!
Example Data & Software Packages
If we want to use the functions of the data.table package, we first have to install and load data.table:
install.packages("data.table")     # Install & load data.table package
library("data.table")
We’ll use the following data as a basis for this R programming tutorial:
DT_1 <- data.table(a = 1:4,        # Create first data.table
                   b = c(TRUE, FALSE, FALSE, TRUE),
                   c = month.abb[1:4],
                   d = 4:7)
DT_2 <- data.table(a = 3:6,        # Create second data.table
                   g = c(TRUE, TRUE, FALSE, TRUE),
                   h = month.abb[9:12])
DT_1 # Print data DT_1
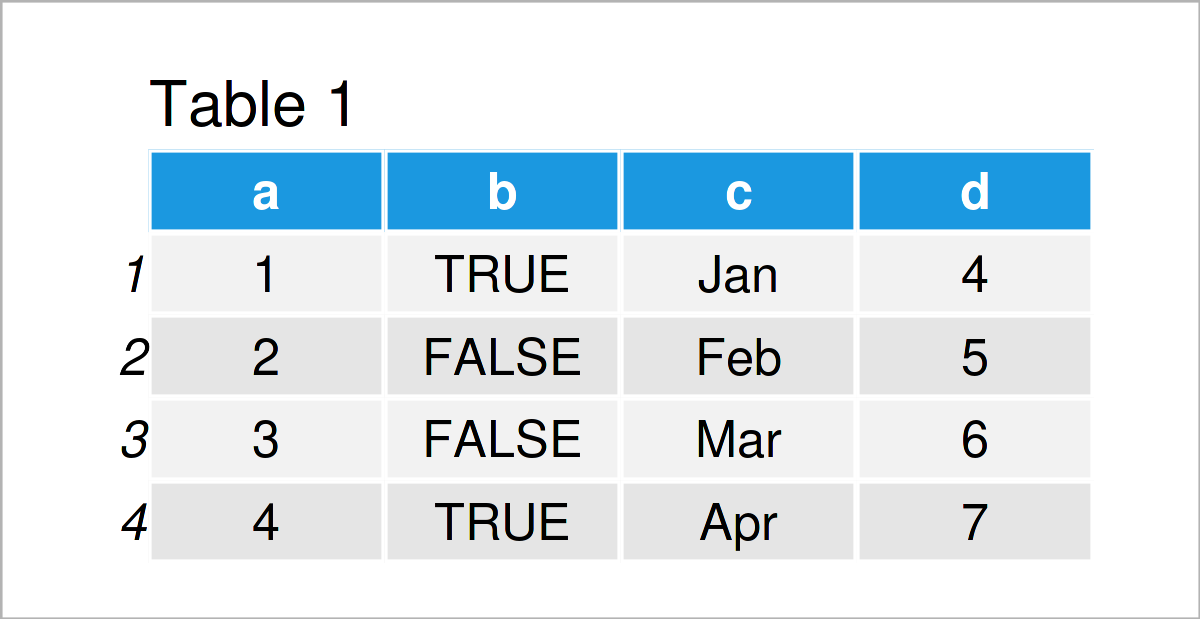
Have a look at the previous table. It shows our first dataset DT_1, which contains four rows and four columns.
DT_2 # Print data DT_2
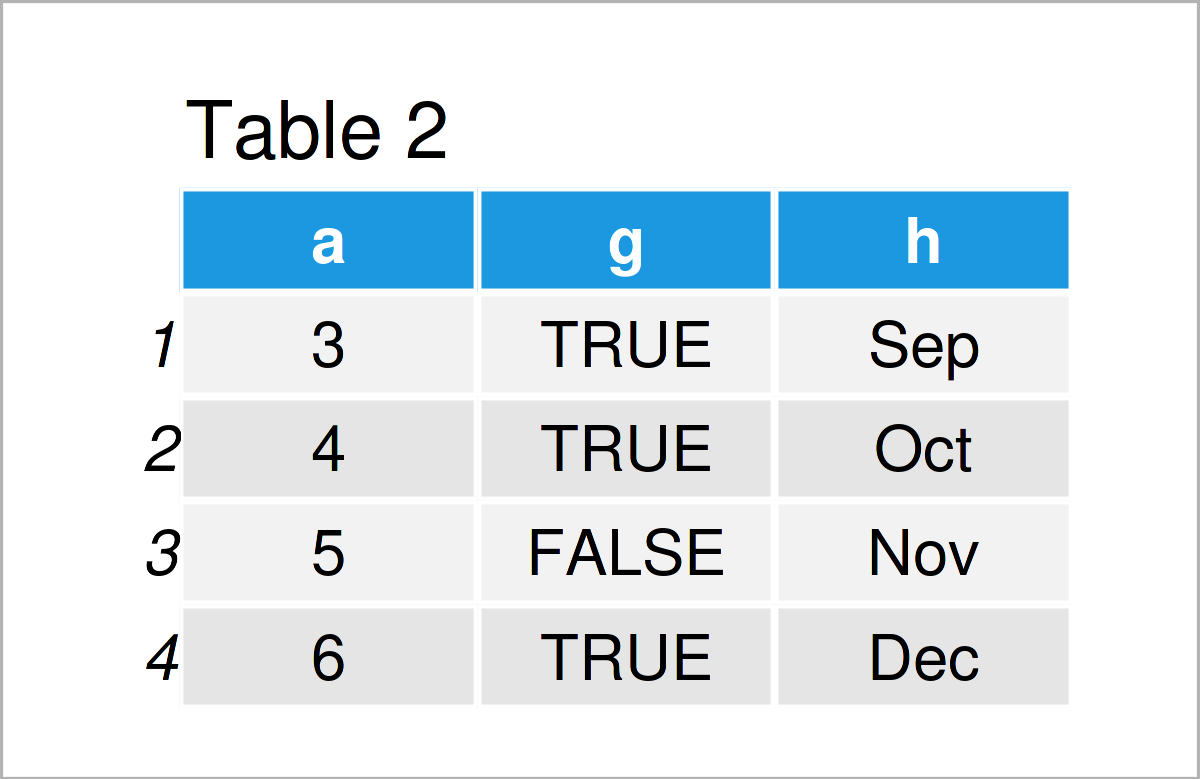
We created a second dataset DT_2. Like the first dataset DT_1 it consists of four rows. Both datasets have a variable called a, which we can use to join the datasets. That is, we can think of variable a as an ID column indicating different units. From comparing the datasets, we see that units 3 and 4 are in both datasets, the others only appear in one of the two.
In the following, we show different ways of merging the two datasets.
Example 1: Right Outer Join
In Example 1, I’ll explain how to do a right outer join. In the example, the variables of DT_1 are left, the additional variables of DT_2 are right. For combining the datasets, we take the rows of DT_2 and add the information of DT_1 for these rows.
DT_12 <- DT_1[DT_2, on = c("a")]    # Join DT_2 to DT_1
DT_12
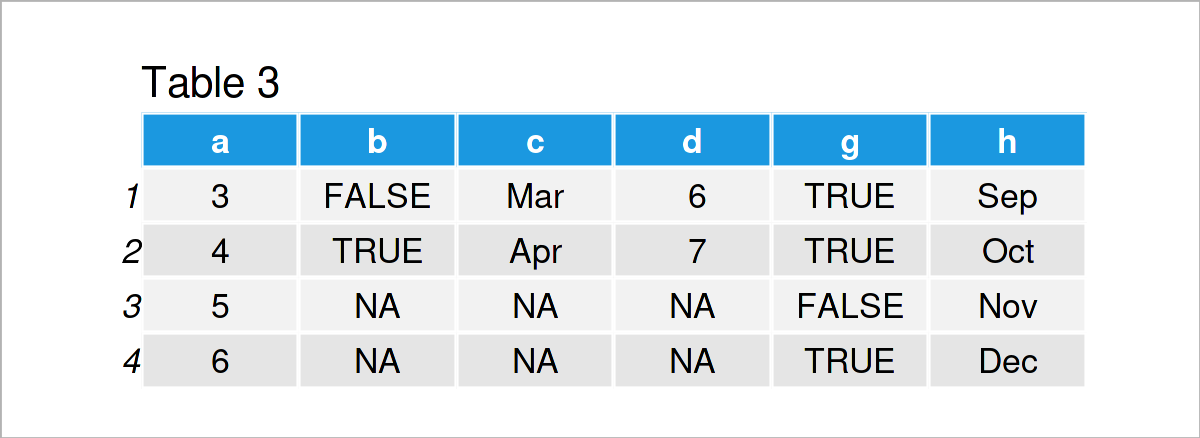
By running the previous R programming syntax, we have created Table 3, i.e. a data.table containing all rows of DT_2 with added information from DT_1. In DT_1, there is no information on units 5 and 6, wherefore the corresponding values are filled by NA.
Example 2: Left Outer Join
In this example, I’ll demonstrate how to join the two datasets the other way around. This time, we take DT_2 and right join DT_1 for the rows appearing in DT_1.
DT_13 <- DT_2[DT_1, on = c("a")]
DT_13
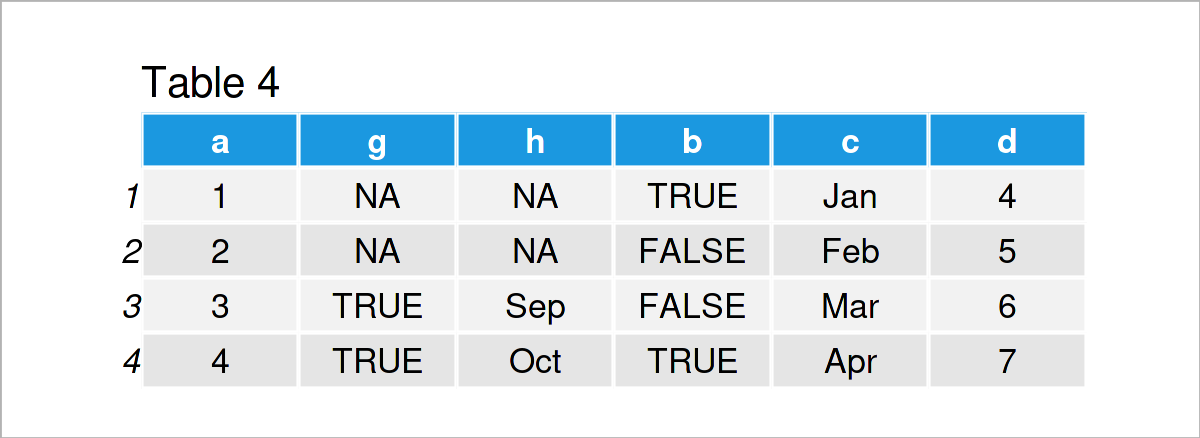
After executing the previous code the data.table shown in Table 4 has been created. Compare it to Table 3. It now only contains the units from DT_1, that is those for which variable a is equal to 1, 2, 3, and 4.
Example 3: Inner Join
In the examples before, we matched one dataset to the other and filled the missing values by NA. Example 3 illustrates how to merge the datasets for the common units, identified by variable a. With option nomatch = 0, we indicate that units which appear in only one of the two datasets should be excluded.
DT_14 <- DT_1[DT_2, on = c("a"), nomatch = 0]
DT_14

By executing the previous R syntax, we have created Table 5, i.e. a data.table containing only information on those units for which variable a is equal to 3 or 4 as those are the units appearing in both datasets.
Example 4: Full Outer Join
In Example 1 and Example 2, we matched the information about one dataset to the information of the other. In this example, I’ll illustrate how to join the two datasets fully by using the option all = TRUE.
DT_15 <- merge(DT_1, DT_2, all = TRUE)
DT_15
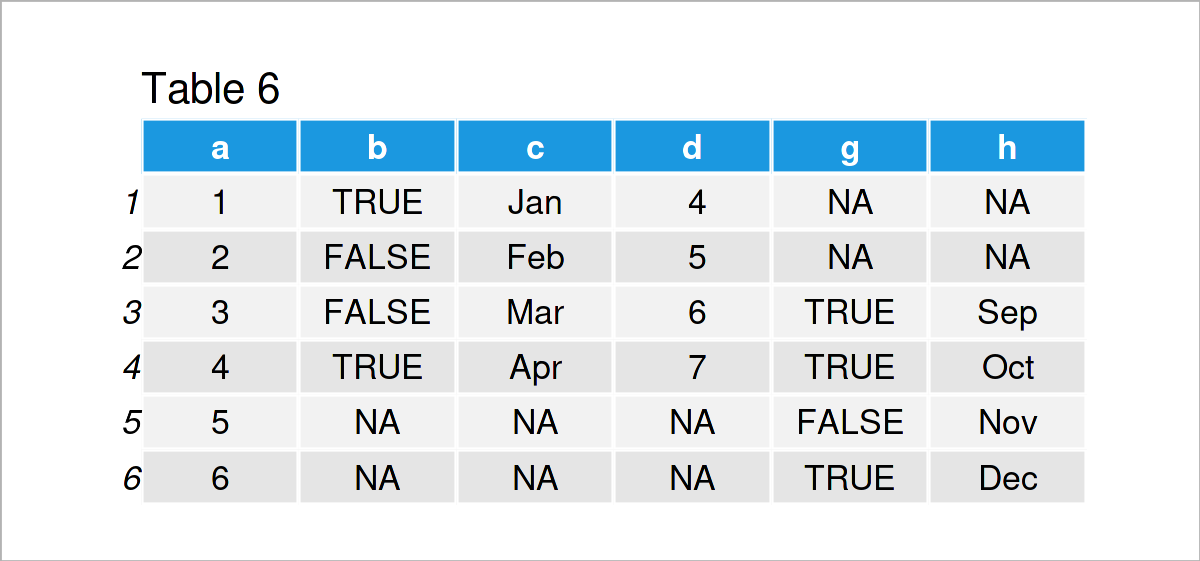
Table 6 shows the output of the previous R programming syntax – a data.table combining all information of both datasets, identified by the common variable a.
Video, Further Resources & Summary
Have a look at the following video on my YouTube channel. In the video, I illustrate the R programming syntax of this article:
The YouTube video will be added soon.
In addition, you may have a look at the other tutorials on my homepage:
- Join Data Frames Using Base R
- Join Data Frames Using the dplyr Package
- Delete Column of data.table by Index in R (2 Examples)
- Rename Columns of data.table in R (2 Examples)
- Create data.table in R (3 Examples)
- Add Multiple New Columns to data.table in R (Example)
- R Programming Overview
Summary: At this point, you should know how to link data.tables in the R programming language. If you have any additional questions, please let me know in the comments.
This page was created in collaboration with Anna-Lena Wölwer. Have a look at Anna-Lena’s author page to get further details about her academic background and the other articles she has written for Statistics Globe.


