Introduction to ggpattern Package in R (6 Examples) | ggplot2 Plots with Textures
This tutorial explains how to draw ggplot2 plots with textures and patterns using the ggpattern package in R programming.
Table of contents:
Let’s dig in…
Some Details About the ggpattern Package
The ggpattern package is used to add geometric and image-based patterns to ggplot2 plots in R.
If you have never heard about the ggpattern package, you may ask: Why do I even need this package?
The reason: This package uplifts data visualizations with the ggplot2 package to the next level!
Especially in case you want to draw different data groups in the same graphic, it might be helpful to have another way (in addition to colors) to differentiate between the different groups in your data.
Sounds good? So how can we install the ggpattern package?
Unfortunately, the ggpattern package is not on CRAN yet (at least the point when I was writing this tutorial). For that reason we have to install the ggpattern package via GitHub:
install.packages("remotes")                    # Install remotes package
remotes::install_github("coolbutuseless/ggpattern")
library("ggpattern")                           # Load ggpattern package
If we want to plot our data with the ggplot2 package, we also have to install and load ggplot2:
install.packages("ggplot2")                    # Install ggplot2 package
library("ggplot2")                             # Load ggplot2 package
Before we jump into the examples of this tutorial, I also want to give credit to Mike FC, the developer of this package. On this homepage, you can find the development process and many additional tutorials on the ggpattern package.
Example Data
The following data will be used as basement for this R tutorial:
set.seed(92634)                                # Create example data
data <- data.frame(x = rnorm(30, 10),
                   group = letters[1:3])
head(data)                                     # Head of example data
#          x group
# 1 9.795025     a
# 2 9.442812     b
# 3 8.954915     c
# 4 9.456803     a
# 5 7.709386     b
# 6 9.589968     c
Have a look at the previous output of the RStudio console. It reveals that our example data has two columns.
The variable x contains randomly distributed numeric values and the variable group defines three different groups in our data.
Let’s draw these data!
Example 1: Drawing Barplot with Pattern Using geom_bar_pattern Function
In Example 1, I’ll show how to create a ggplot2 barchart with the default pattern used by the ggpattern package.
For this, we simply have to replace the geom_bar function of the ggplot2 package by the geom_bar_pattern function of the ggpattern package:
ggplot(data, aes(group, x, fill = group)) +    # Create barplot with pattern
  geom_bar_pattern(stat = "identity")
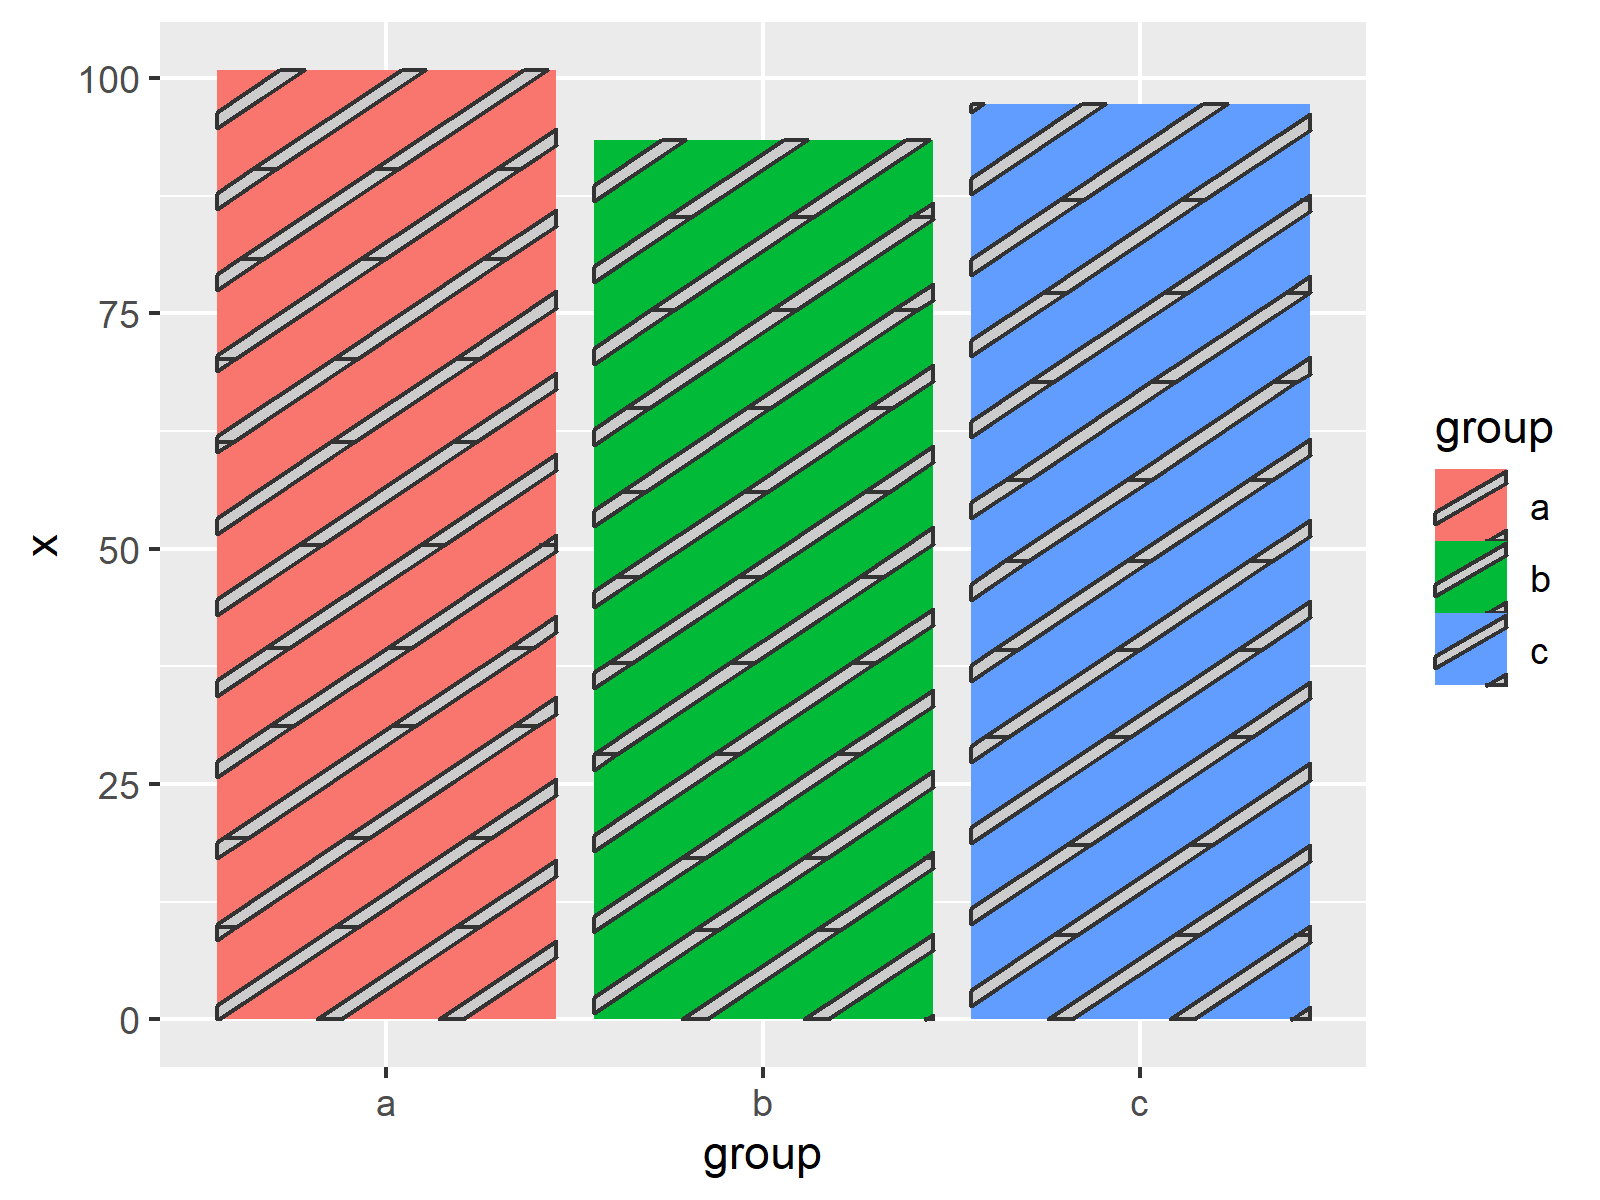
Figure 1 illustrates the output of the previous R programming syntax: A ggplot2 barplot with the same texture in each bar.
Example 2: Manually Specify Colors of Pattern Using pattern_color & pattern_fill Arguments
In Example 2, I’ll illustrate how to change the colors of our pattern.
We can use the pattern_color argument to specify the borders and the pattern_fill argument to edit the filling color of our pattern.
ggplot(data, aes(group, x, fill = group)) +    # Modify colors of pattern
  geom_bar_pattern(stat = "identity",
                   pattern_color = "white",
                   pattern_fill = "black")
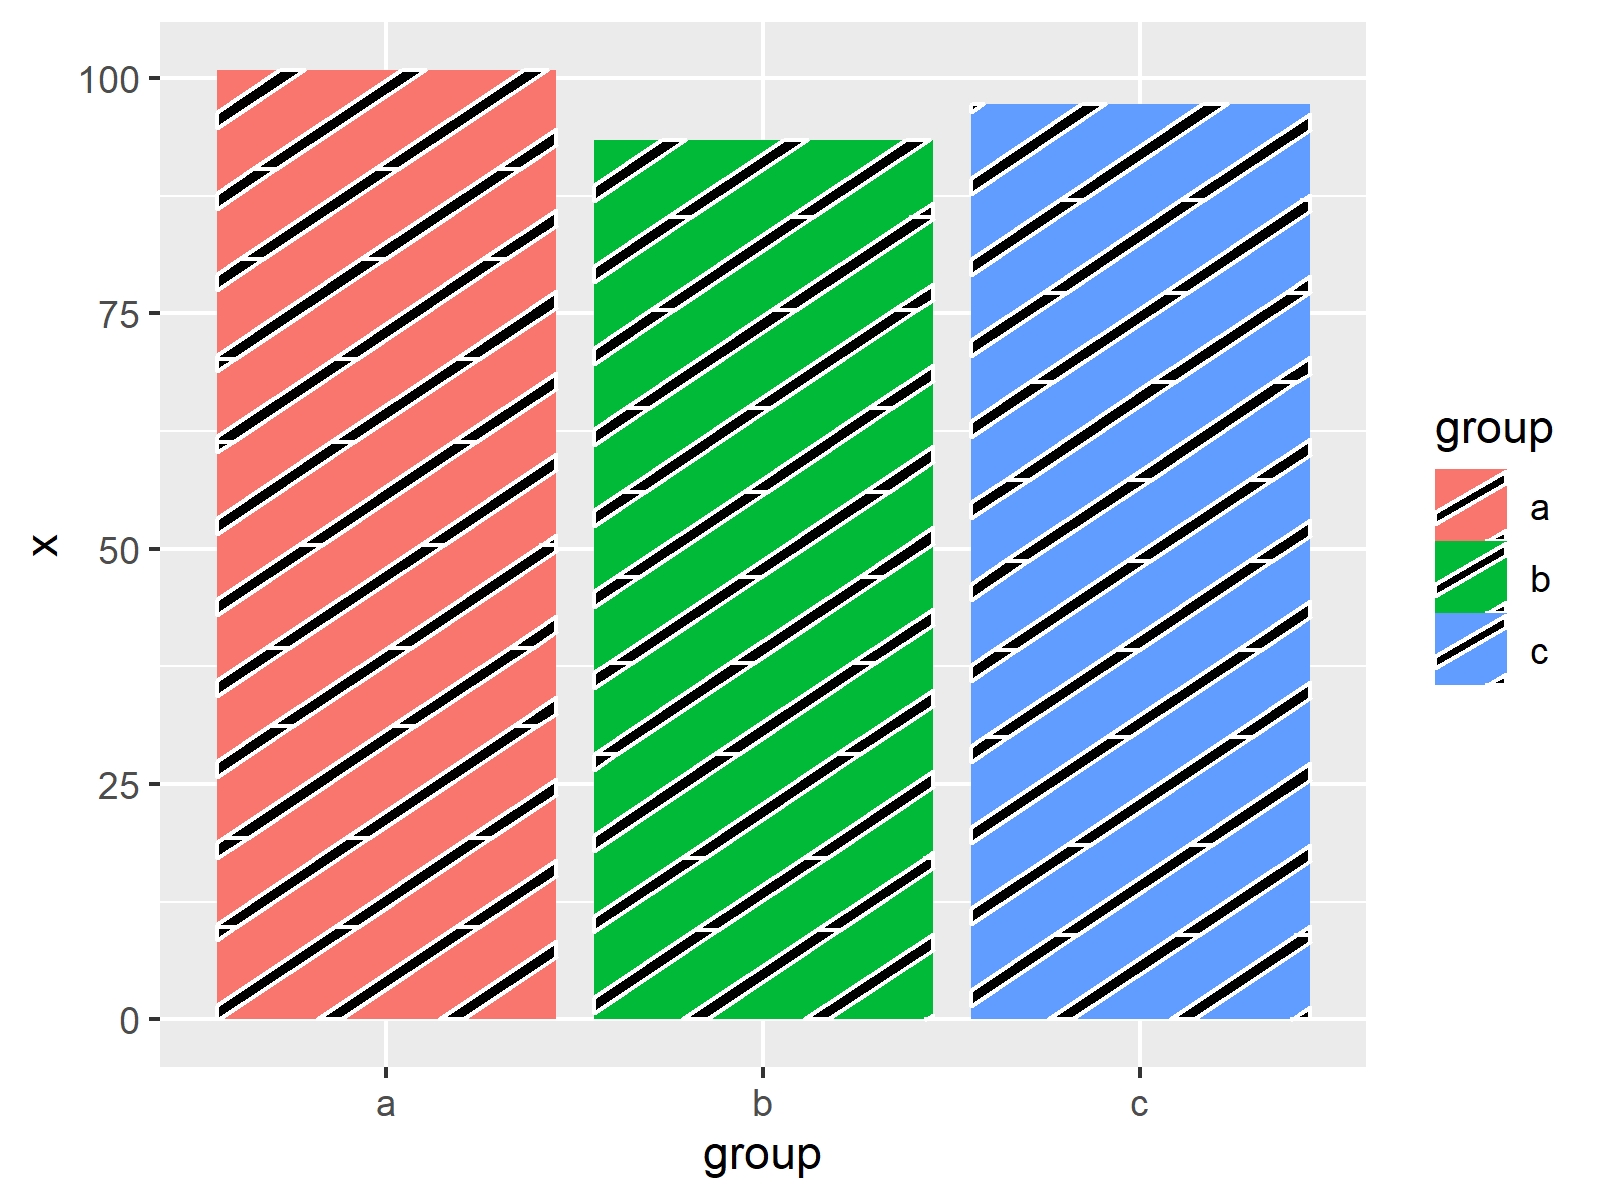
As shown in Figure 2, the previous syntax created another barchart with patterns, but this time the colors of the patterns were set manually.
Example 3: Drawing Barplot with Pattern for Each Group Using aes Function & pattern Argument
In my opinion, this example shows the most important point of the ggpattern package!
The syntax below shows how to specify a different texture for each of the groups in our data frame. For this, we have to use the aes function and the pattern argument as shown below:
ggplot(data, aes(group, x, fill = group)) +    # Different pattern for each group
  geom_bar_pattern(stat = "identity",
                   pattern_color = "white",
                   pattern_fill = "black",
                   aes(pattern = group))
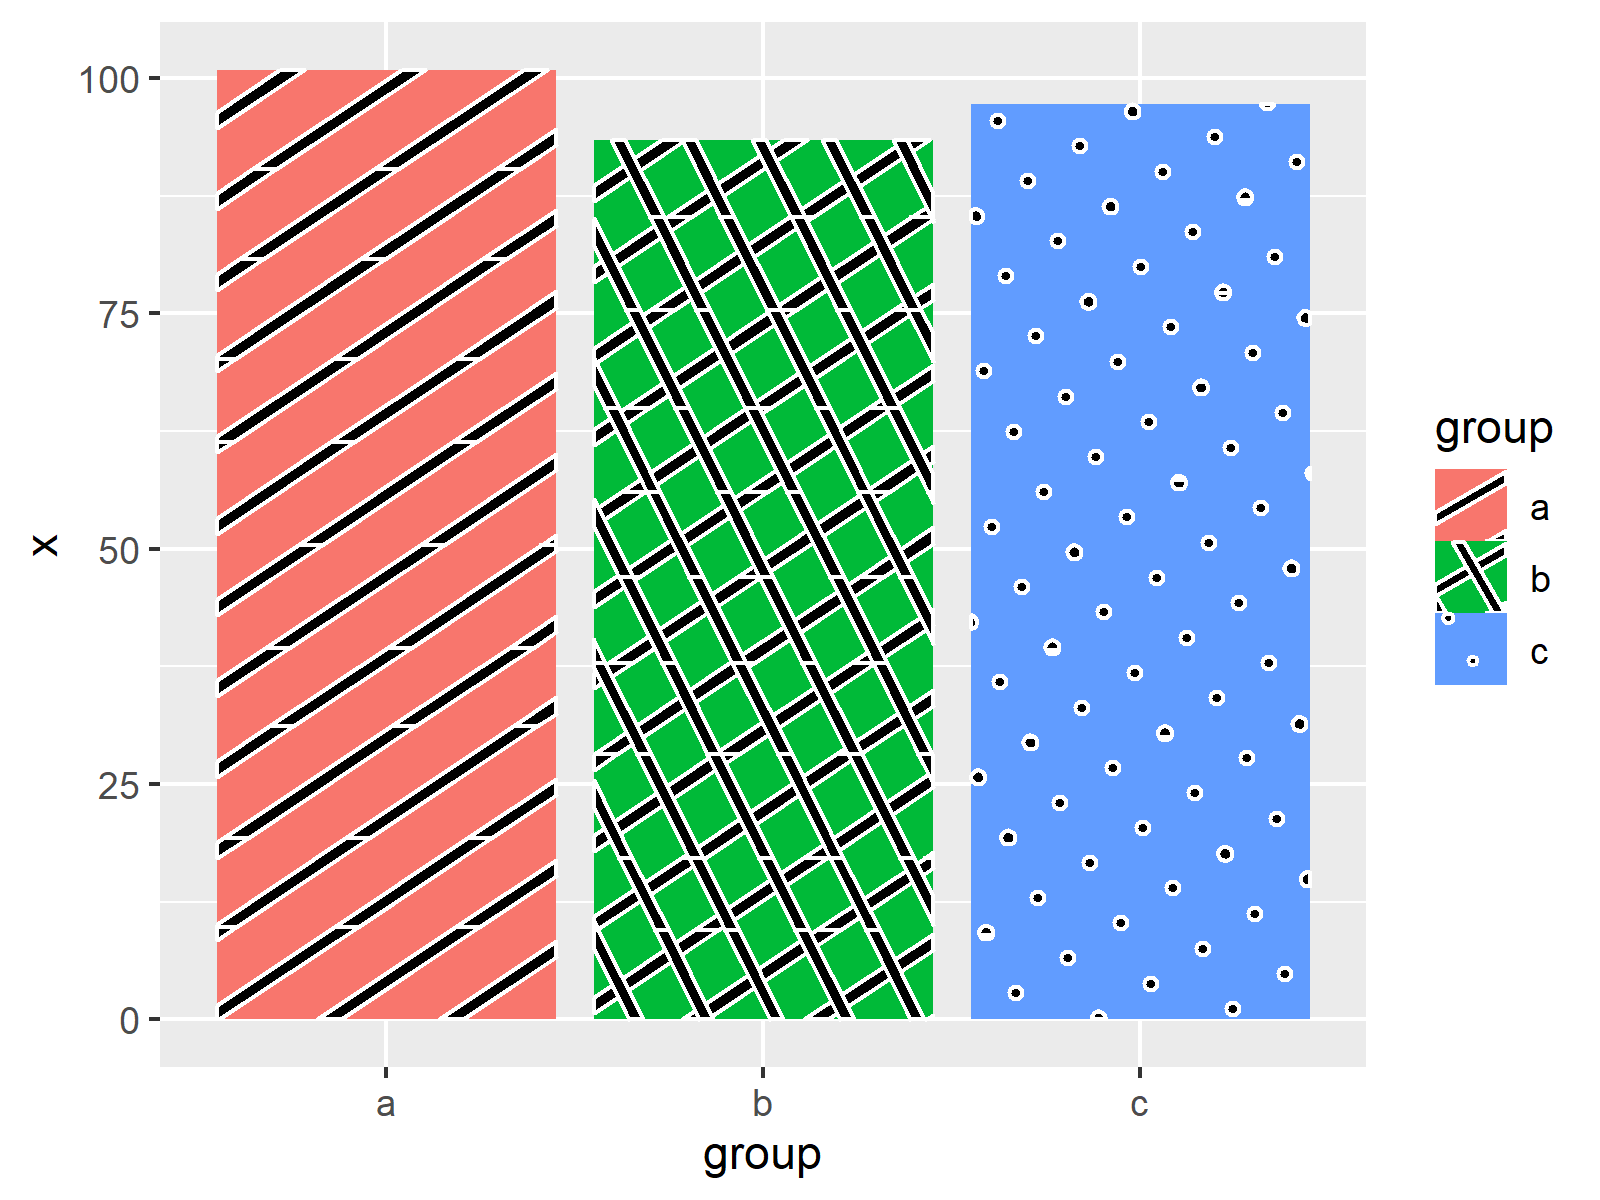
As shown in Figure 3, the previous code drew a barplot with different pattern in each bar. Looks great, doesn’t it?!
Example 4: Drawing Density Plot with Pattern Using geom_density_pattern Function
So far, we have used the ggpattern package only for barcharts.
This example explains how to draw multiple ggplot2 densities in the same graphic with different patterns for each density using the geom_density_pattern function.
ggplot(data, aes(x, fill = group)) +           # Create density plot with pattern
  geom_density_pattern(pattern_color = "white",
                       pattern_fill = "black",
                       aes(pattern = group))
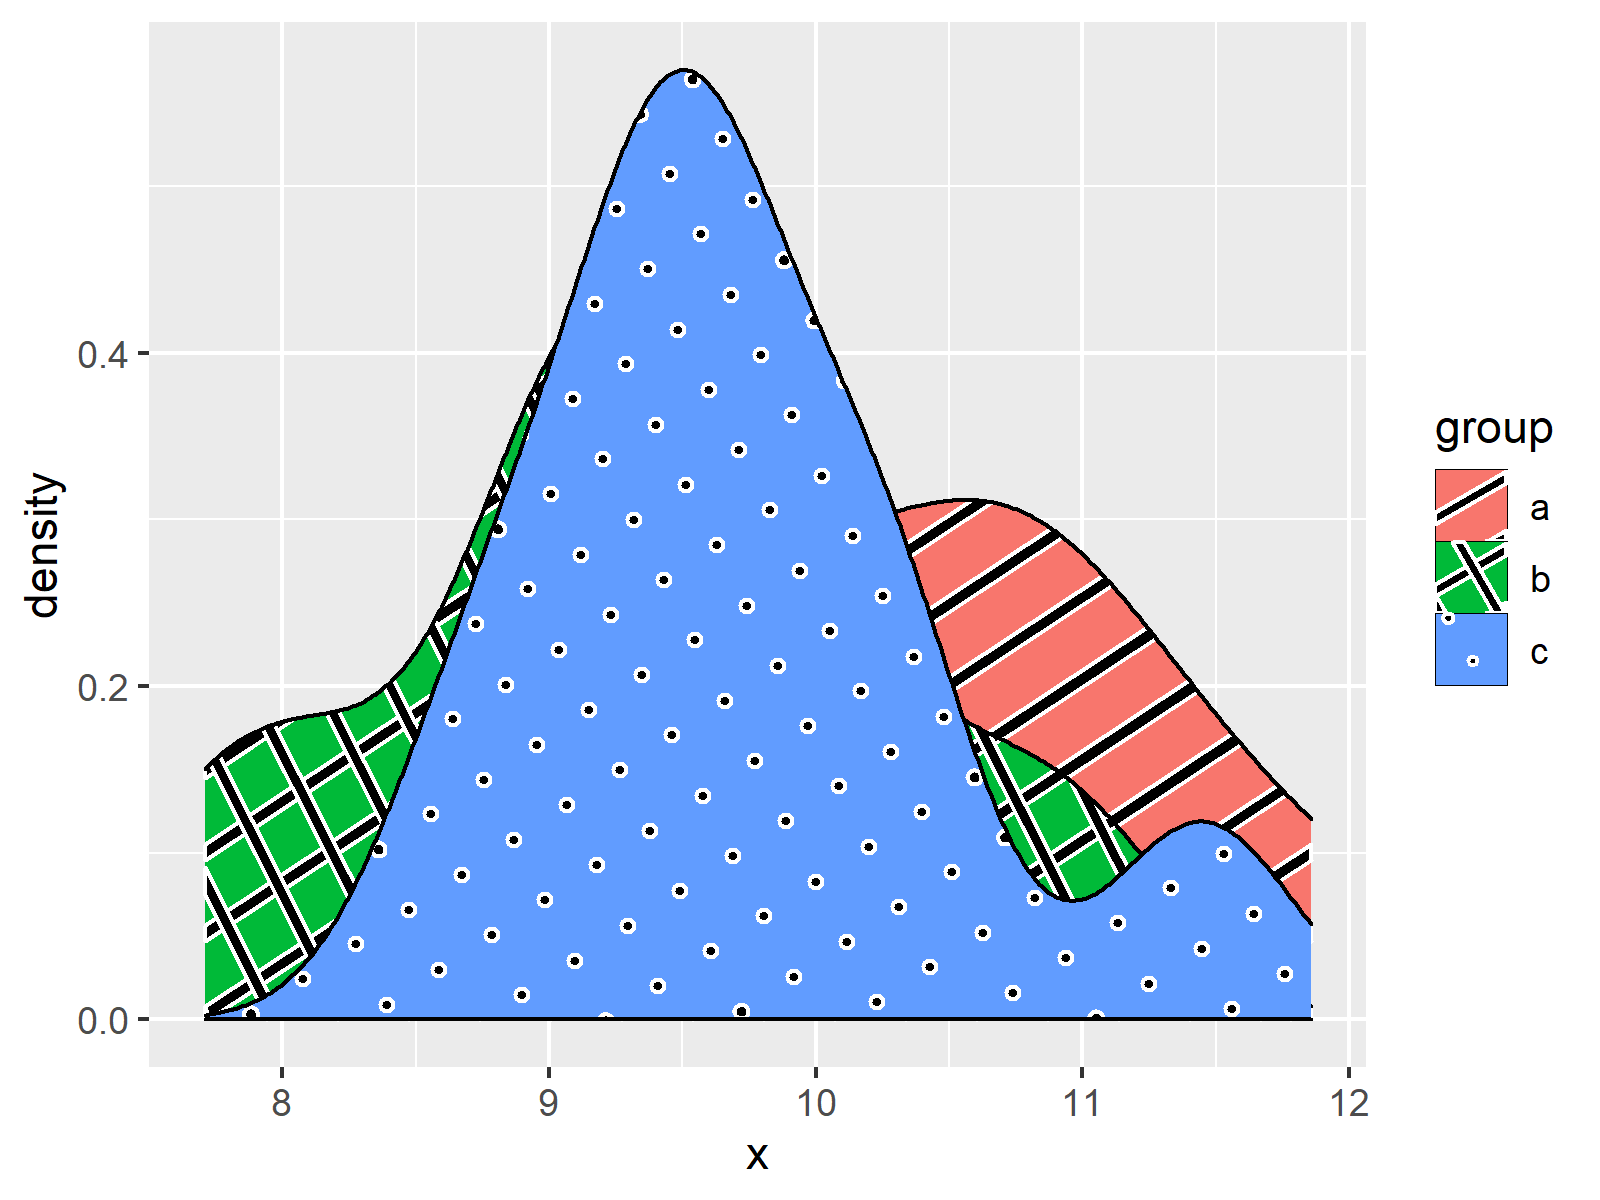
As shown in Figure 4, the previous R programming syntax created a graph showing multiple densities with different textures.
Example 5: Drawing Transparent Density Plot with Pattern Using alpha & pattern_alpha Arguments
In graphics containing multiple overlapping densities, it might be useful to make the densities transparent.
For this, we can use the alpha argument provided by the ggplot2 package in combination with the pattern_alpha argument provided by the ggpattern package.
Have a look at the following R code and its output:
ggplot(data, aes(x, fill = group)) +           # Transparent density plot with pattern
  geom_density_pattern(pattern_color = "white",
                       pattern_fill = "black",
                       alpha = 0.5,
                       pattern_alpha = 0.5,
                       aes(pattern = group))
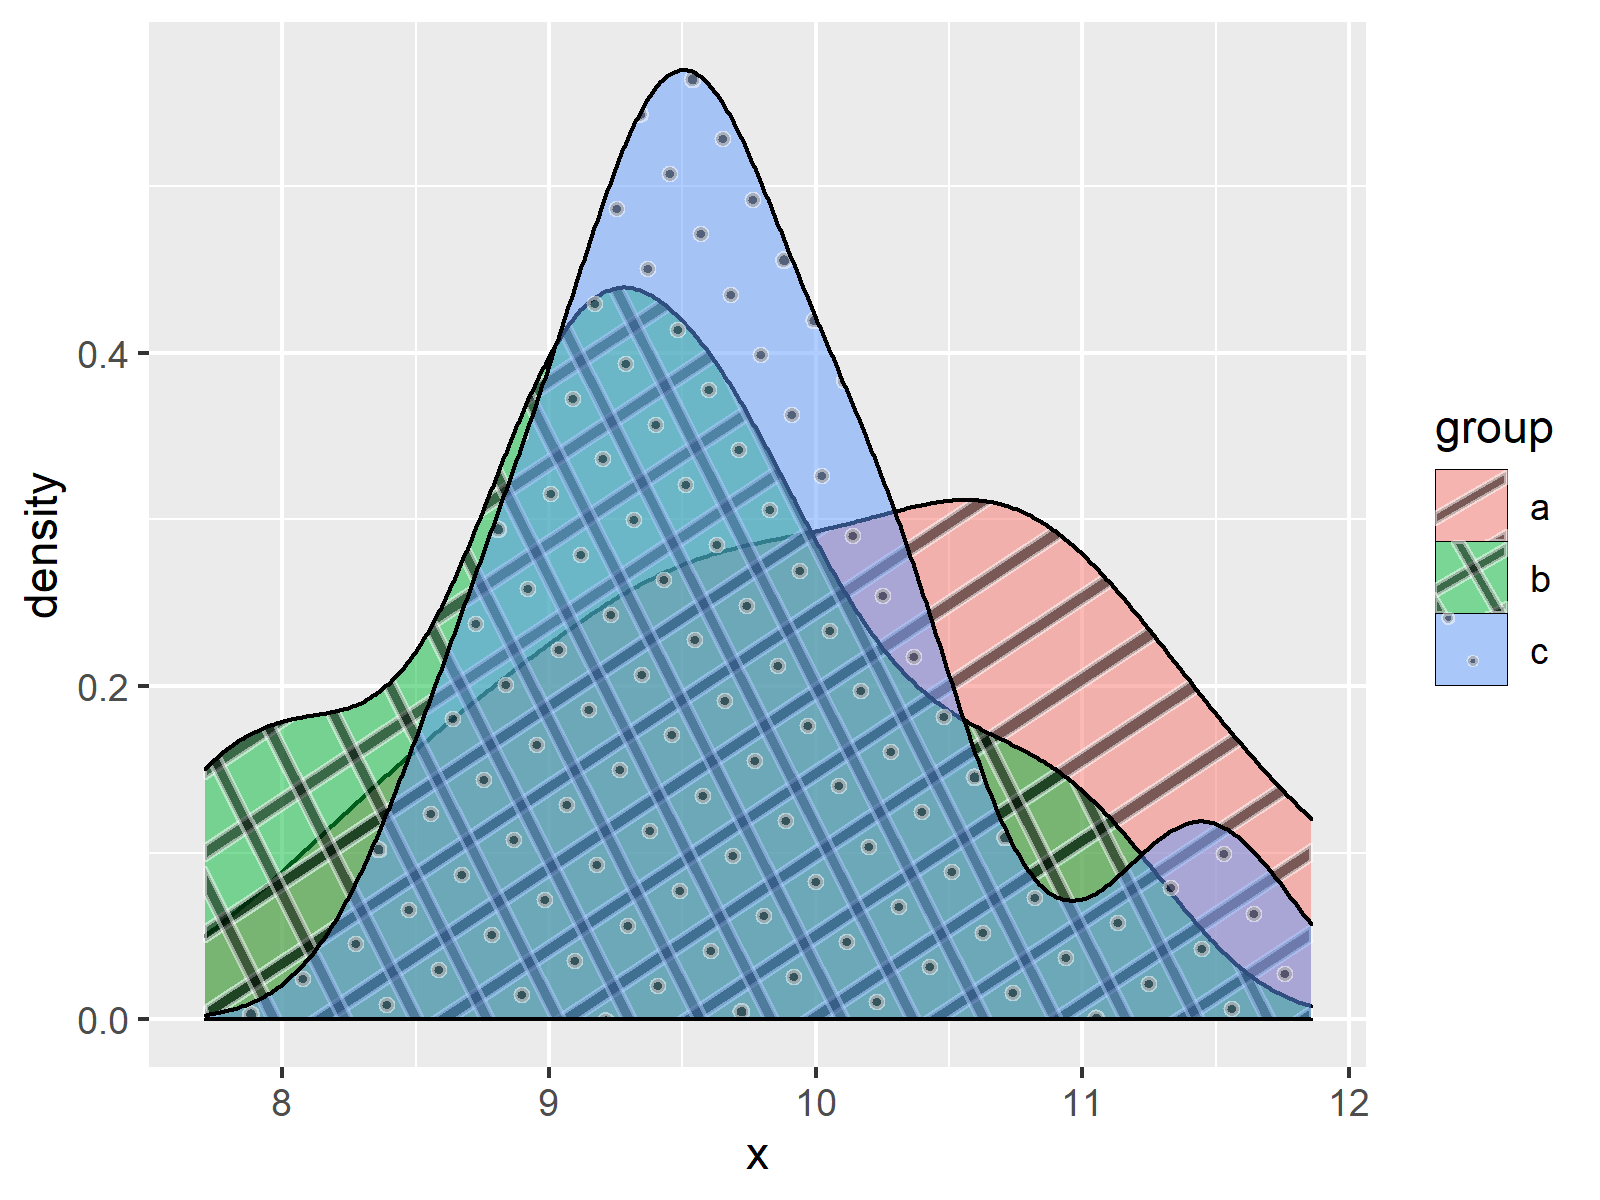
Figure 5 shows the previously created transparent density plot.
Example 6: Drawing Boxplot with Pattern Using geom_boxplot_pattern Function
The following syntax explains how to apply the geom_boxplot_pattern function to draw multiple ggplot2 boxplots with patterns in the same graph:
ggplot(data, aes(x, fill = group)) +           # Create boxplot with pattern
  geom_boxplot_pattern(pattern_color = "white",
                       pattern_fill = "black",
                       aes(pattern = group))
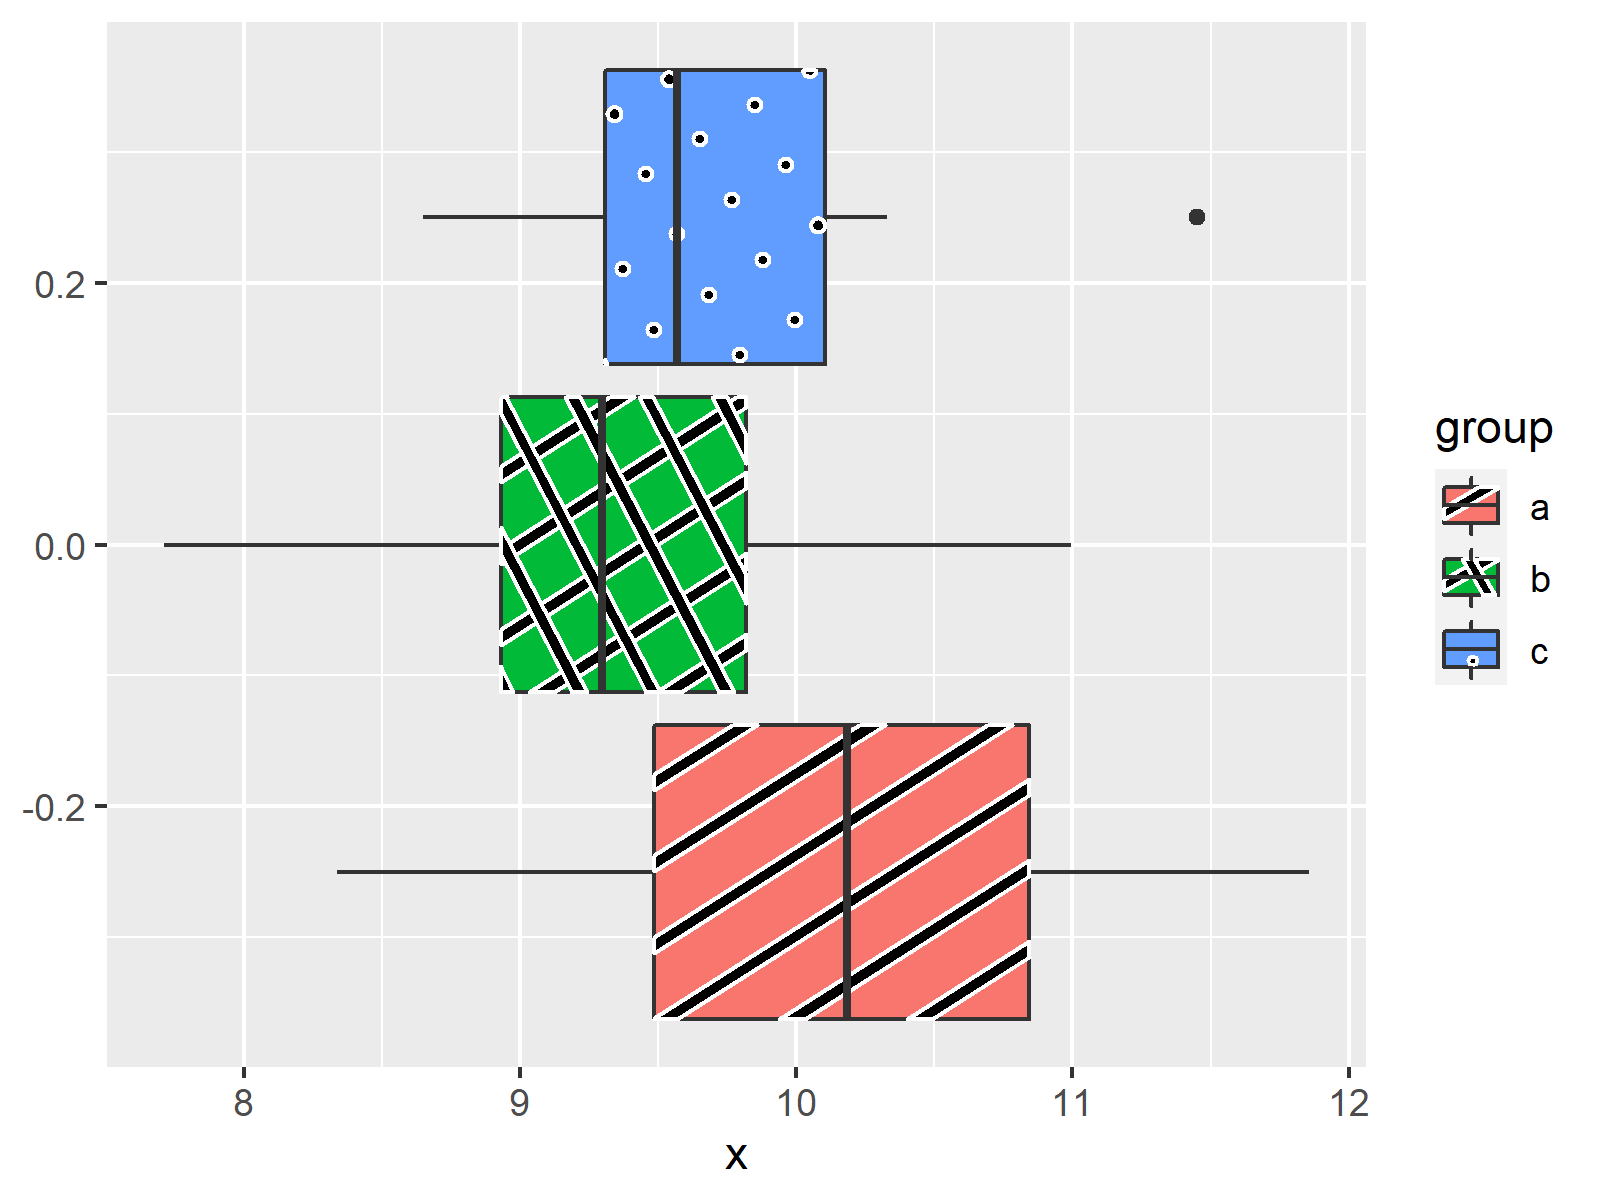
The output of the previous code is shown in Figure 6 – A graphic containing several boxplots. Each boxplot is shown with a different pattern.
Video, Further Resources & Summary
Do you need more explanations on the R programming codes of this page? Then you might want to watch the following video of my YouTube channel. I explain the R programming codes of this tutorial in the video tutorial:
Besides that, you may want to read some of the related articles on my homepage:
- Change Colors of Bars in ggplot2 Barchart
- Overlay Histogram with Fitted Density Curve
- Draw Multiple Overlaid Histograms with ggplot2 Package
- Draw Multiple Boxplots in One Graph in R Side-by-Side
- Introduction to the patchwork Package in R
- Graphics in R
- All R Programming Examples
Summary: You learned in this tutorial how to apply the functions of the ggpattern package in R. Don’t hesitate to tell me about it in the comments section, in case you have further questions.




24 Comments. Leave new
Hi Joachin, thanks for your script and notes. I’m Alexis.
I was looking forward to install ggpattern and test with ggplot2 but after few hours it was no possible and this is message I got:
> remotes::install_github(“coolbutuseless/ggpattern”)
Downloading GitHub repo coolbutuseless/ggpattern@HEAD
Error in utils::download.file(url, path, method = method, quiet = quiet, :
download from ‘https://api.github.com/repos/coolbutuseless/ggpattern/tarball/HEAD’ failed
Any suggestion.
Thanks a best regards!
Alexis
Hey Alexis,
Thank you for your message. Could you check if you have installed the newest version of R?
Regards,
Joachim
The official ggpattern repository advises you to make sure you install a bunch of dependencies prior to install ggpattern itself. This way, you will know exactly where your installation is getting stuck. In my case, I had to install some system-wide libraries first, so I could install R dependencies, so I could finally get ggpatterns running.
“`
install.packages(‘ggplot2’)
install.packages(‘scales’)
install.packages(‘grid’)
install.packages(‘glue’)
install.packages(‘rlang’)
install.packages(‘sf’)
install.packages(‘png’)
# install.packages(“remotes”)
remotes::install_github(“trevorld/gridpattern”)
remotes::install_github(“coolbutuseless/ggpattern”)
“`
https://github.com/coolbutuseless/ggpattern/
Thanks for jumping in Erik, I’m certain this will help many readers!
The number of patterns it can generate is not more than 3. So, if you have more than 3 groups, there use to be the repetition of patterns. Any suggestions?
Regards,
Shantanu.
Hey Shantanu,
The ggpattern package provides much more than only three patterns. Have a look here for more details: https://coolbutuseless.github.io/package/ggpattern/
Regards
Joachim
Hello!
Thank you very much for the helpful information. I have used ggpattern for a manuscript I’m working on. Do you know how to properly cite ggpattern?
Hey William,
Thank you for the kind feedback, glad you found the tutorial helpful!
I guess I would cite this link as online resource: https://coolbutuseless.github.io/package/ggpattern/ I’m afraid there is no perfect solution in this specific case, since the package is not on CRAN yet.
Regards
Joachim
Sounds great. Thank you!
Glad to hear that! 🙂
Hi, is there a way to specify for each boxplot the patterns and color?
I would need to have, let’s say, “circle” in the first box, “stripes” in the second and so on..
Thank you!!
Hey Valentina,
Yes, this is possible. Please have a look at the ggpattern gallery. It shows different examples on how to manually change the patterns of your graph.
Regards
Joachim
I keep having this problem of discovering “ggpattern” and “ggplot2” everytime i quit and reopened the session, what can I do to make them permanent?
Hey Issa,
Could you please explain what you mean with “discovering”? Generally speaking, you would have to load all packages you want to use after every restart.
Regards,
Joachim
Hello,
Is it possible to combine geom_boxplot_pattern and scale_fill_manual with specified colors and patterns for groups? I receive errors.
Thank you
Hey Robin,
Could you share your code?
Regards,
Joachim
Could you please share your code?
Hey Ahmend,
What do you mean? The code is shown in the tutorial 🙂
Regards,
Joachim
Hi Joachim,
thanks for sharing this tutorial!
I have problems using the “pattern_shape” command. Especially when I choose “pattern=”pch”. In which section of the script, can I define “pch”, for example to use simple shares with no fill, as mentioned here https://trevorldavis.com/R/gridpattern/dev/reference/grid.pattern_pch.html
Thank you in advance!
Regards,
Lucas
Hey Lucas,
Thank you for the kind comment, glad you like the tutorial!
Please excuse the late response. I was on a long holiday so unfortunately I wasn’t able to reply sooner. Still need help with your code?
Regards,
Joachim
Hi Joachim,
Thank you for such an awesome package! The density plot function is working great for me until I try to add a y-value (so that each density plot is on a separate line). When I do this, it just creates a box with one fill pattern. Any ideas for fixing this?
Thank you so much!
Camille
Code:
ggplot(test.2, aes(x= .value, y = contrast, fill= partner, xmin= 0, xmax= .10))+ geom_density_pattern(aes(pattern= task))
Hello Camille,
As you see, densities are calculated based on the x values; hence you don’t input any y values. To plot different densities, you should use fill=somehting as shown in the tutorial. Or do you like just to change the line type? Let me know if I got you wrong.
Regards,
Cansu
Ah, I see my problem. I was trying to create a density ridgeline plot rather than a plain density plot. Thanks for the help, Cansu!
Hello Camille,
I am glad that you solved your problem anyhow.
Regards,
Cansu