Add Title to Venn Diagram in R (3 Examples)
This tutorial demonstrates how to draw a venn diagram with main title in the R programming language.
Since venn diagrams can be created based on many different packages, I have prepared three examples for three different packages.
The post looks as follows:
Let’s get started.
Example 1: Add Title to Venn Diagram Created by VennDiagram Package
In Example 1, I’ll illustrate how to draw a venn diagram with titles using the VennDiagram package.
In order to use the functions of the VennDiagram package, we first need to install and load VennDiagram:
install.packages("VennDiagram")     # Install & load VennDiagram package
library("VennDiagram")
In the next step, we can use the draw.pairwise.venn function to draw a pairwise venn diagram. Note that we are also creating a plot object called my_venndiag:
my_venndiag <- draw.pairwise.venn(area1 = 12, # Create venn diagram
                                  area2 = 18,
                                  cross.area = 5)
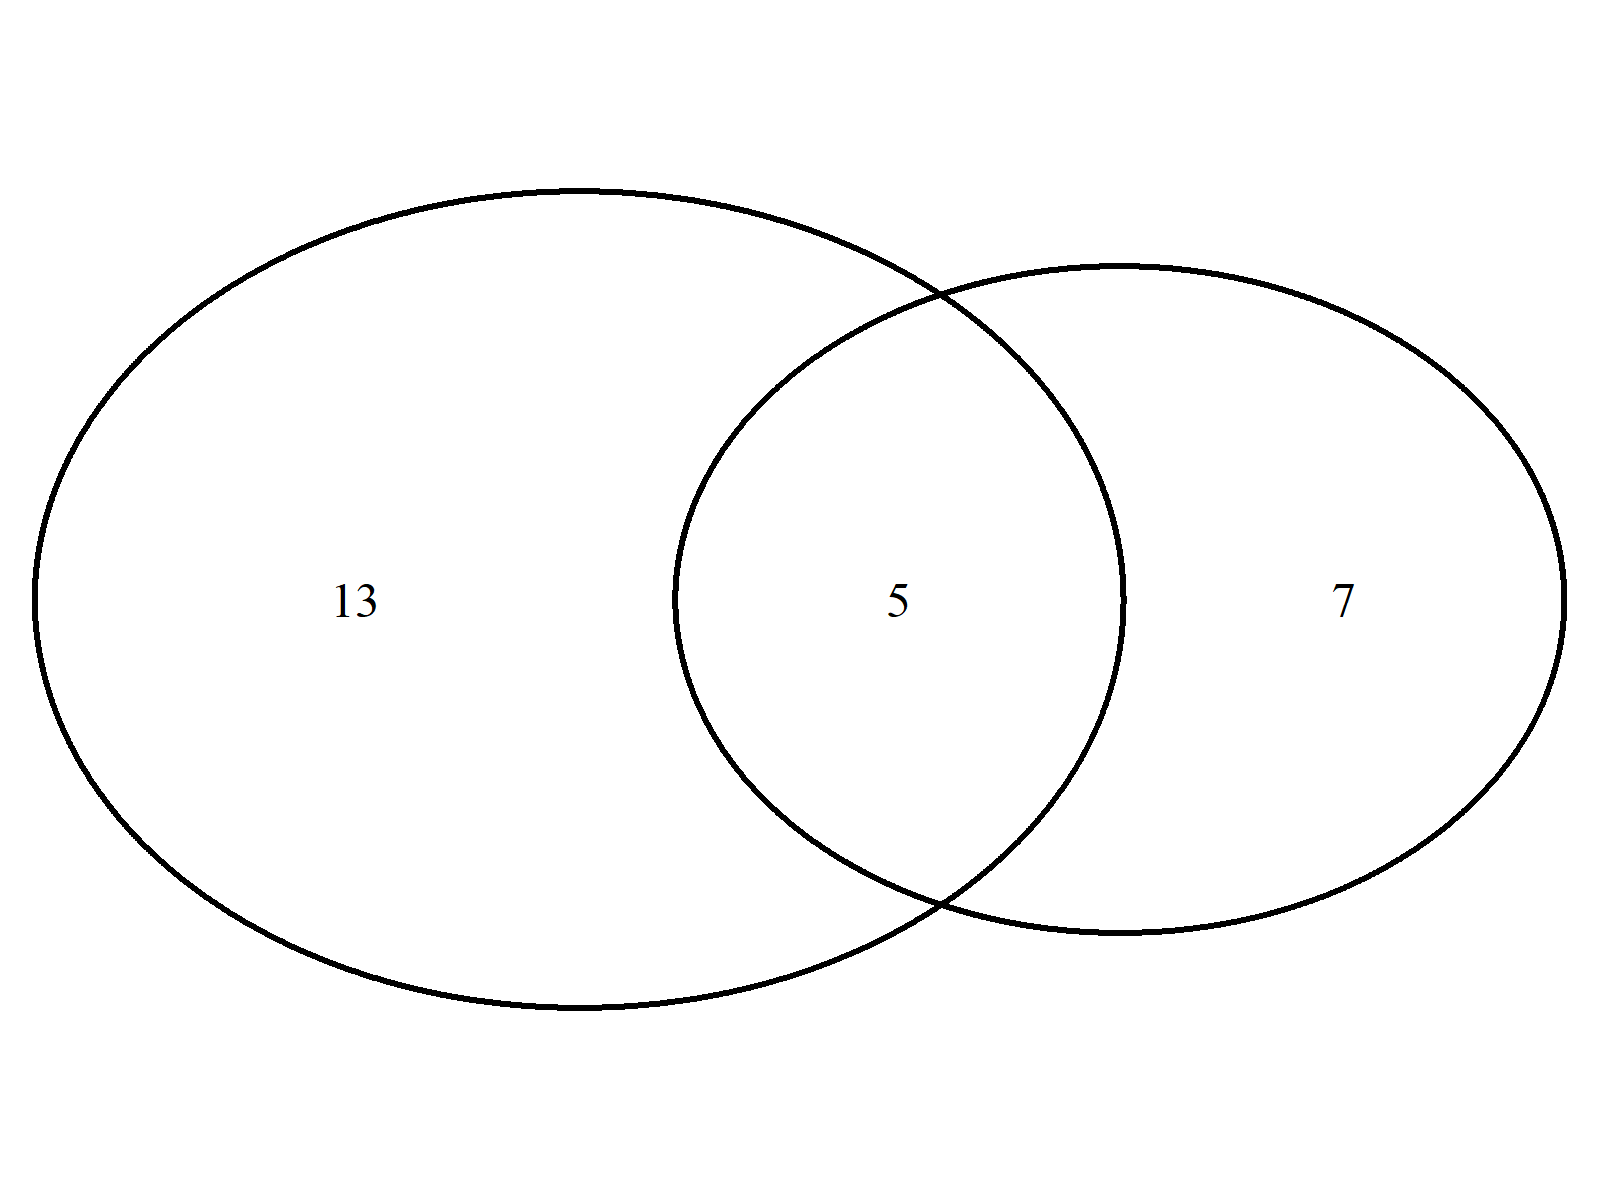
In the next step, we have to install and load the gridExtra package:
install.packages("gridExtra")       # Install gridExtra package
library("gridExtra")                # Load gridExtra package
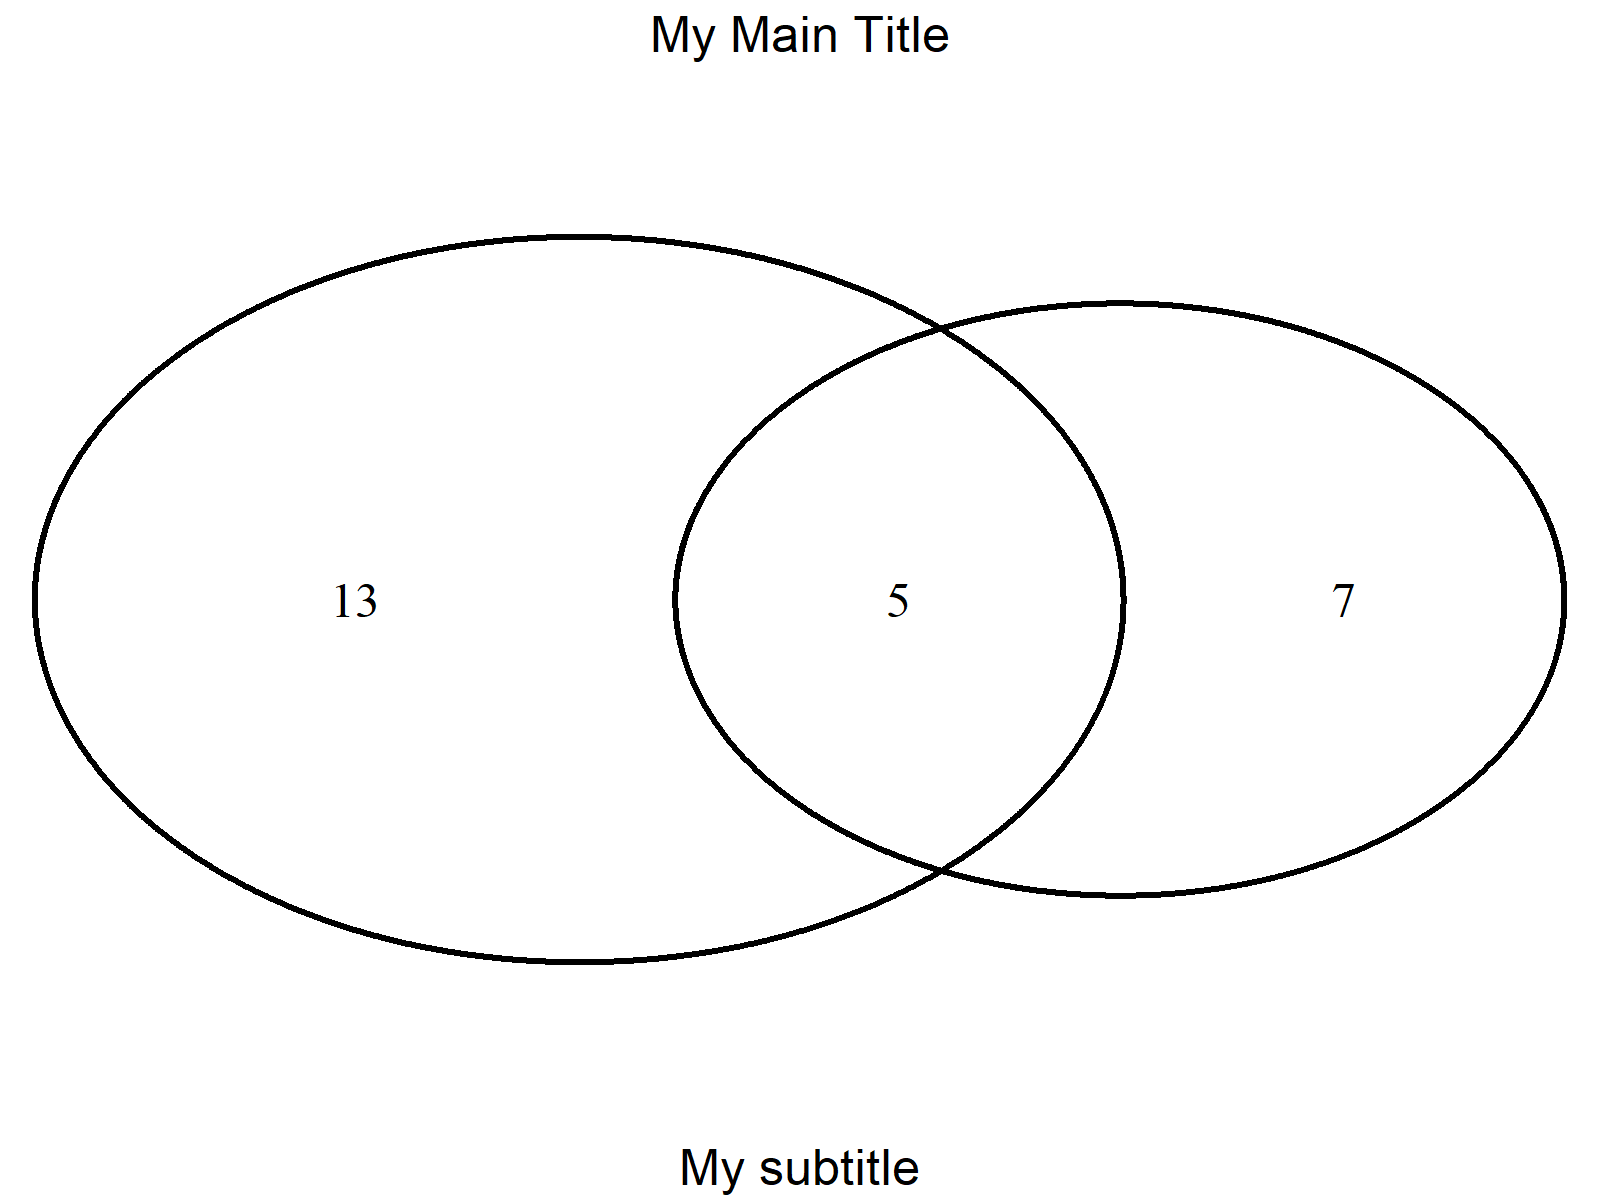
We can now use the functions of the gridExtra package to add titles to our plot. In the following R code, I’m using the top argument to add a main title and the bottom argument to add a subtitle:
grid.arrange(gTree(children = my_venndiag), # Add title & subtitle
             top = "My Main Title",
             bottom = "My subtitle")
Example 2: Add Title to Venn Diagram Created by ggvenn Package
The following R syntax demonstrates how to add a main title to venn diagrams created by the ggvenn package.
For this, we first have to create an exemplifying data set that we can use later on to create a ggvenn venn diagram:
set.seed(68195)                     # Create example data frame
data_venn <- data.frame(value = 1:50,
                        A = FALSE,
                        B = FALSE)
data_venn$A <- data_venn$value %in% list_venn$A
data_venn$B <- data_venn$value %in% list_venn$B
head(data_venn)                     # Head of example data frame
#   value     A     B
# 1     1  TRUE FALSE
# 2     2  TRUE FALSE
# 3     3  TRUE FALSE
# 4     4 FALSE  TRUE
# 5     5 FALSE FALSE
# 6     6  TRUE  TRUE
Next, we have to install and load the ggvenn add-on package:
install.packages("ggvenn")          # Install ggvenn package
library("ggvenn")                   # Load ggvenn
The ggvenn package works in combination with the ggplot2 package, so let’s install and load the ggplot2 package as well:
install.packages("ggplot2")         # Install ggplot2 package
library("ggplot2")                  # Load ggplot2
In the next step, we can use the ggplot and geom_venn functions to draw a pairwise venn diagram:
ggp <- ggplot(data_venn, # Apply geom_venn function
              aes(A = A, B = B)) +
  geom_venn()
ggp
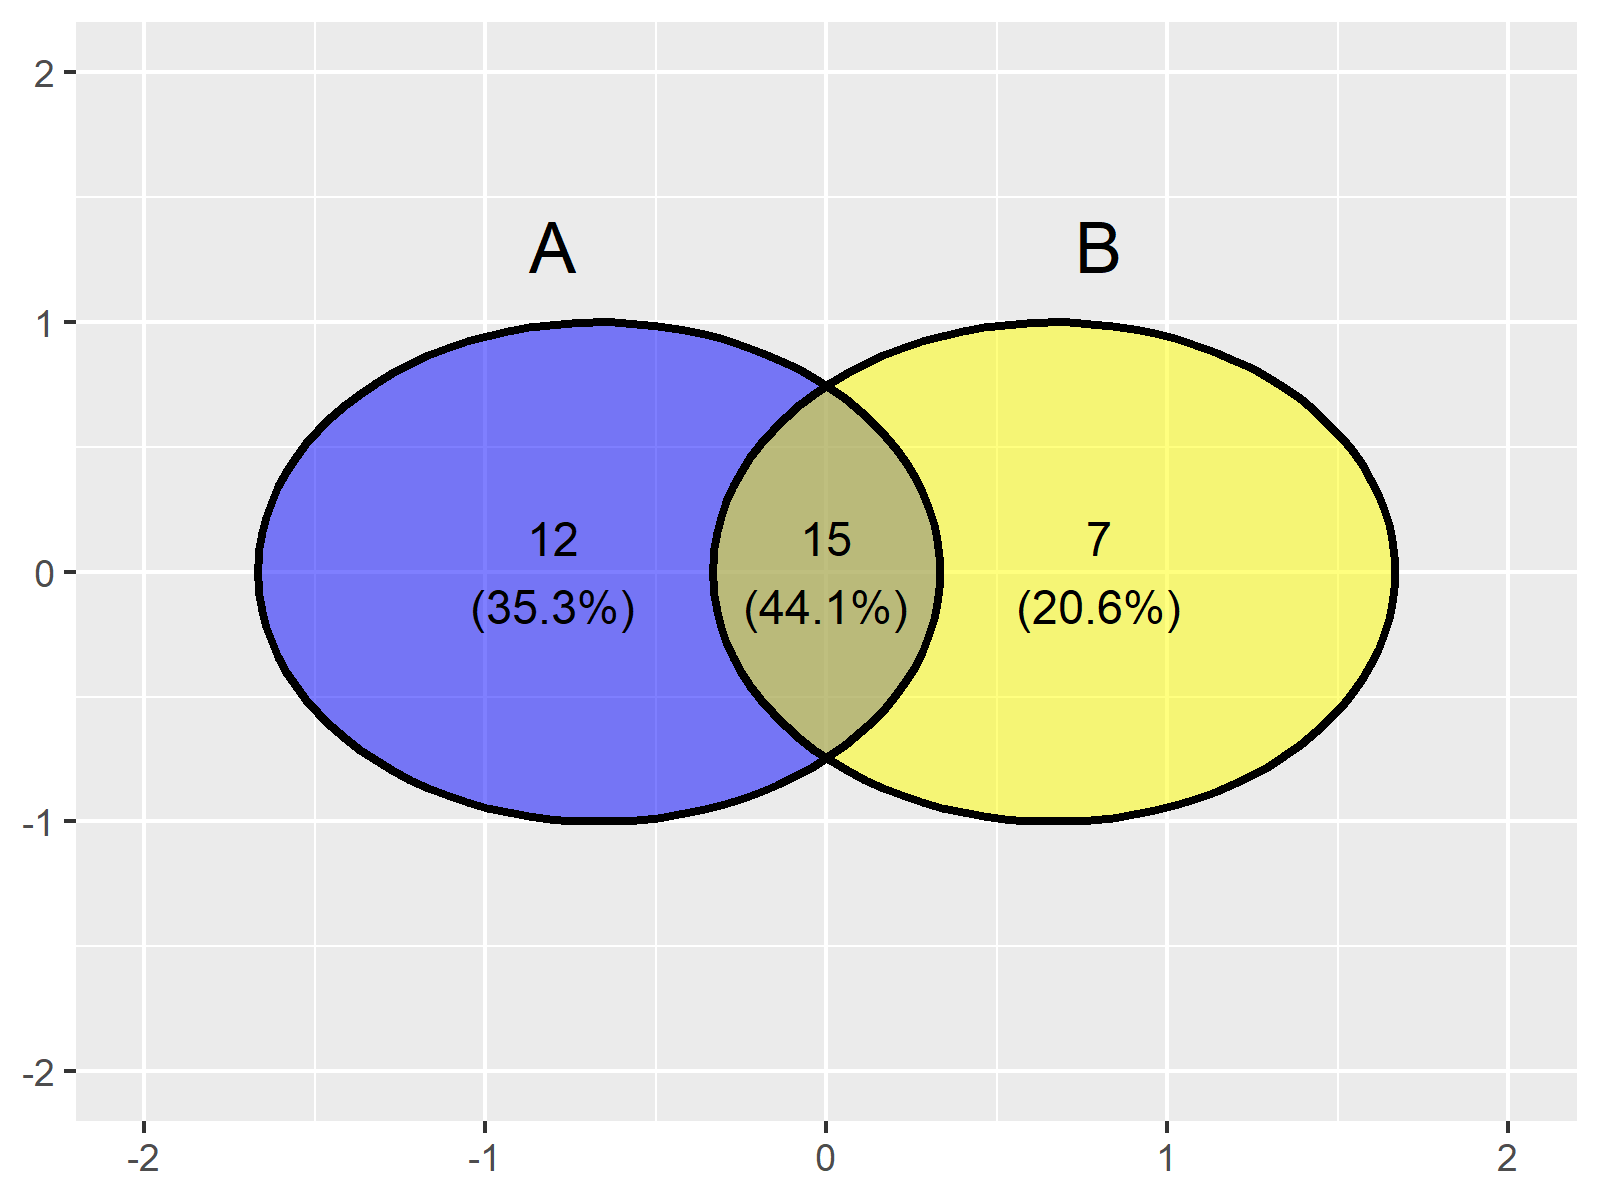
Figure 3 visualizes the output of the previous code, a venn diagram without title.
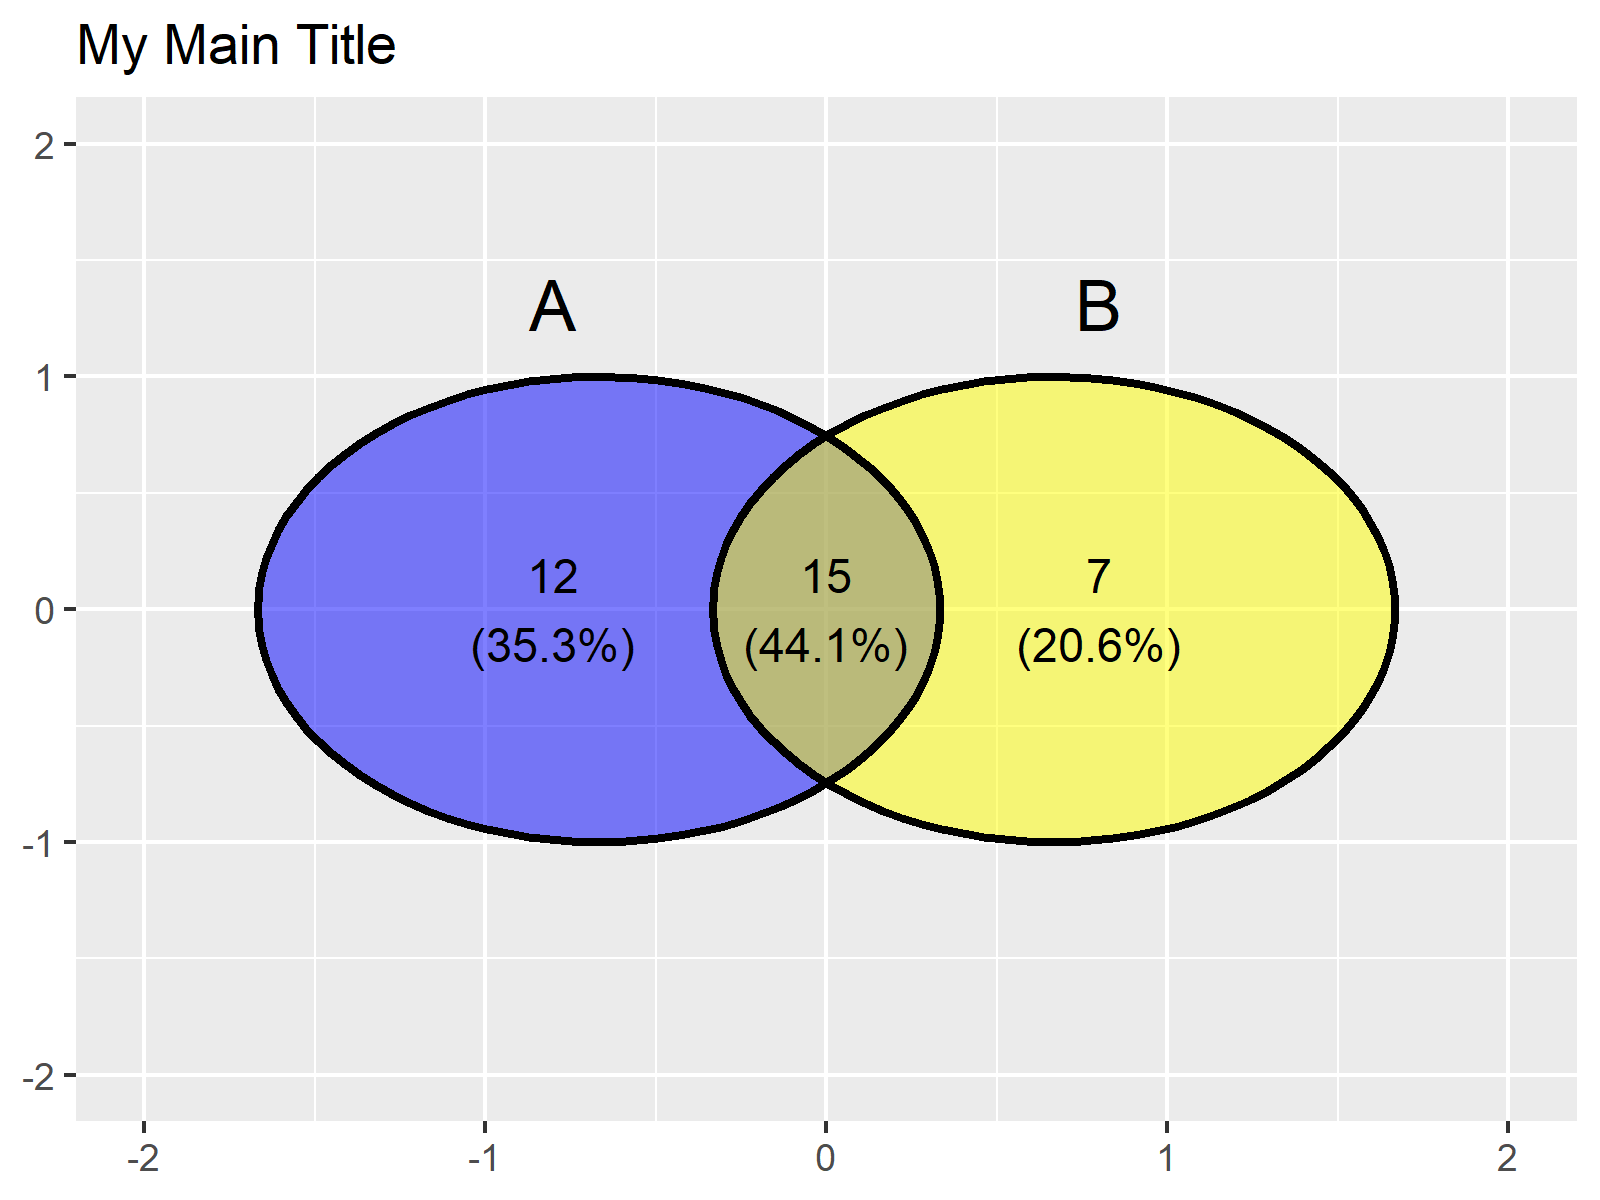
We can now use the typical ggplot2 syntax to add a title on top of our plot:
ggp + # Add title to ggplot2 venn diagram
  ggtitle("My Main Title")
Example 3: Add Title to Venn Diagram Created by venneuler Package
Another package that can be used to create venn and Euler diagrams is the venneuler package.
We first have to install and load the venneuler add-on package, to be able to use the functions that are contained in the package:
install.packages("venneuler")       # Install venneuler package
library("venneuler")                # Load venneuler
Next, we can use the plot and venneuler functions to create a venn diagram without a main title:
plot(venneuler(c(A = 10,    # Draw pairwise venn diagram
                 B = 75,
                 "A&B" = 4)))
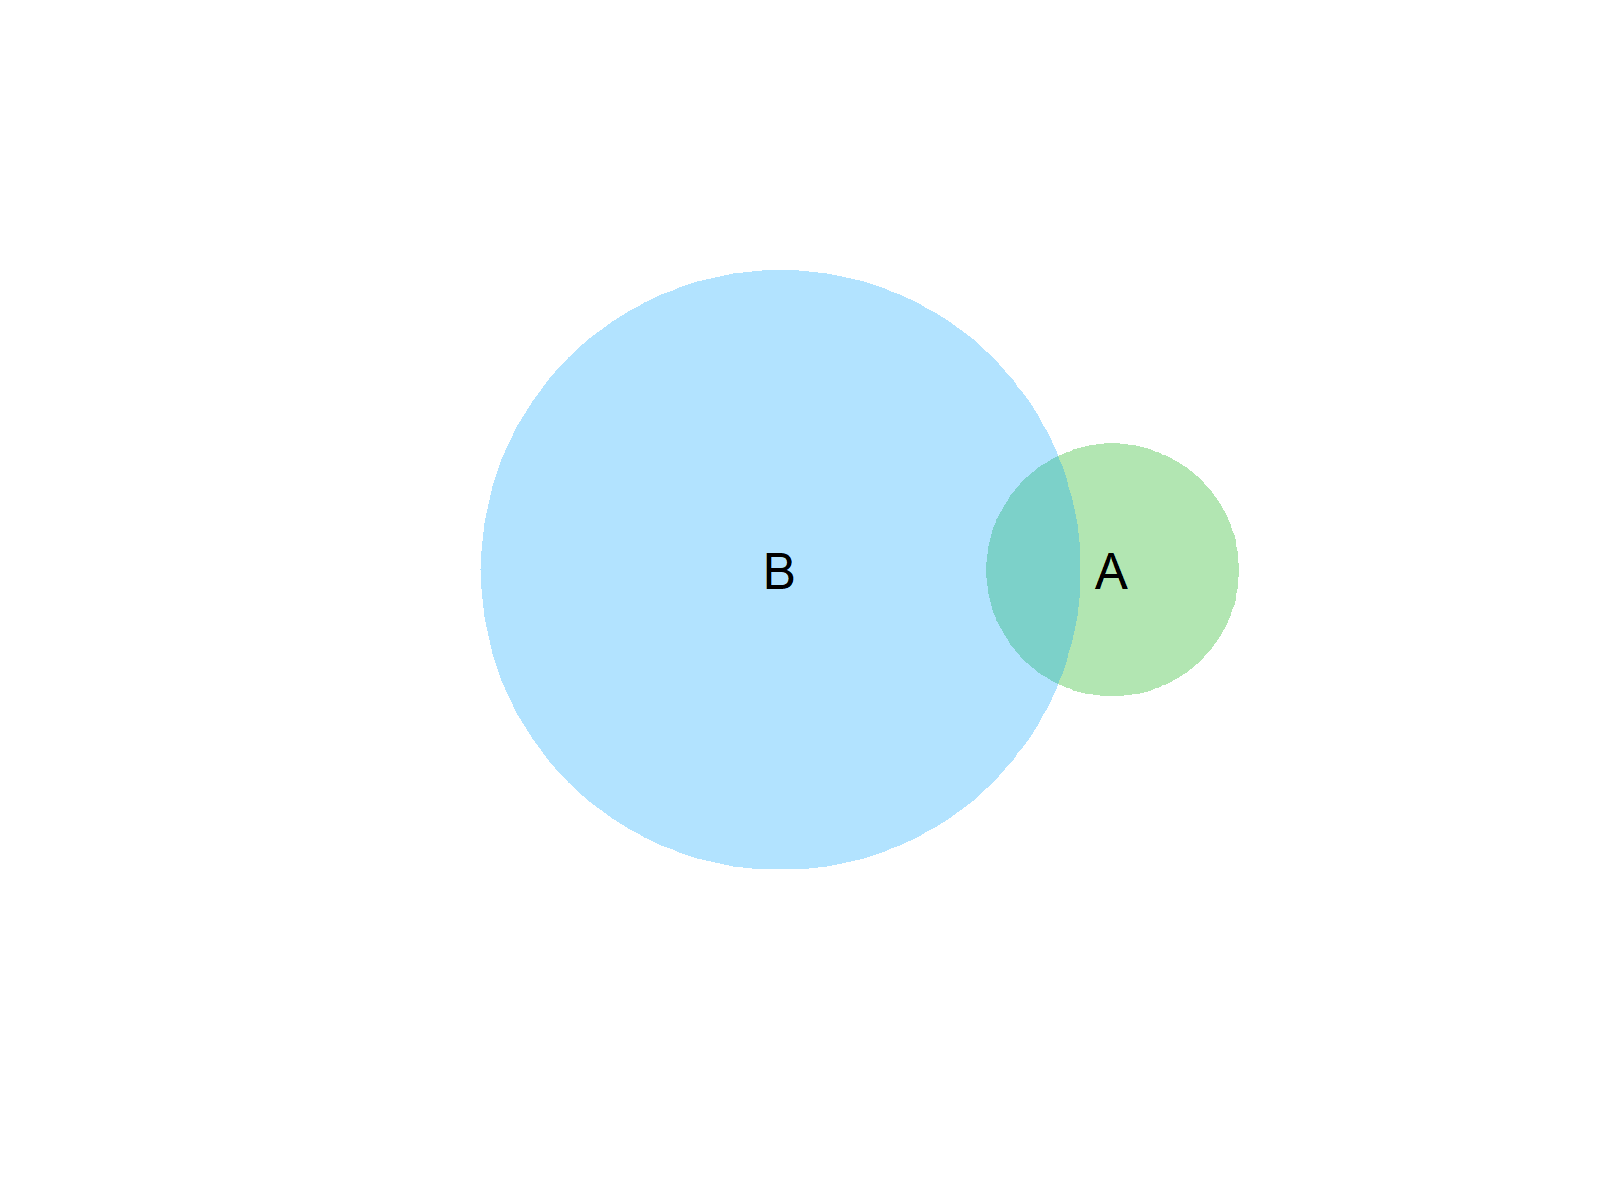
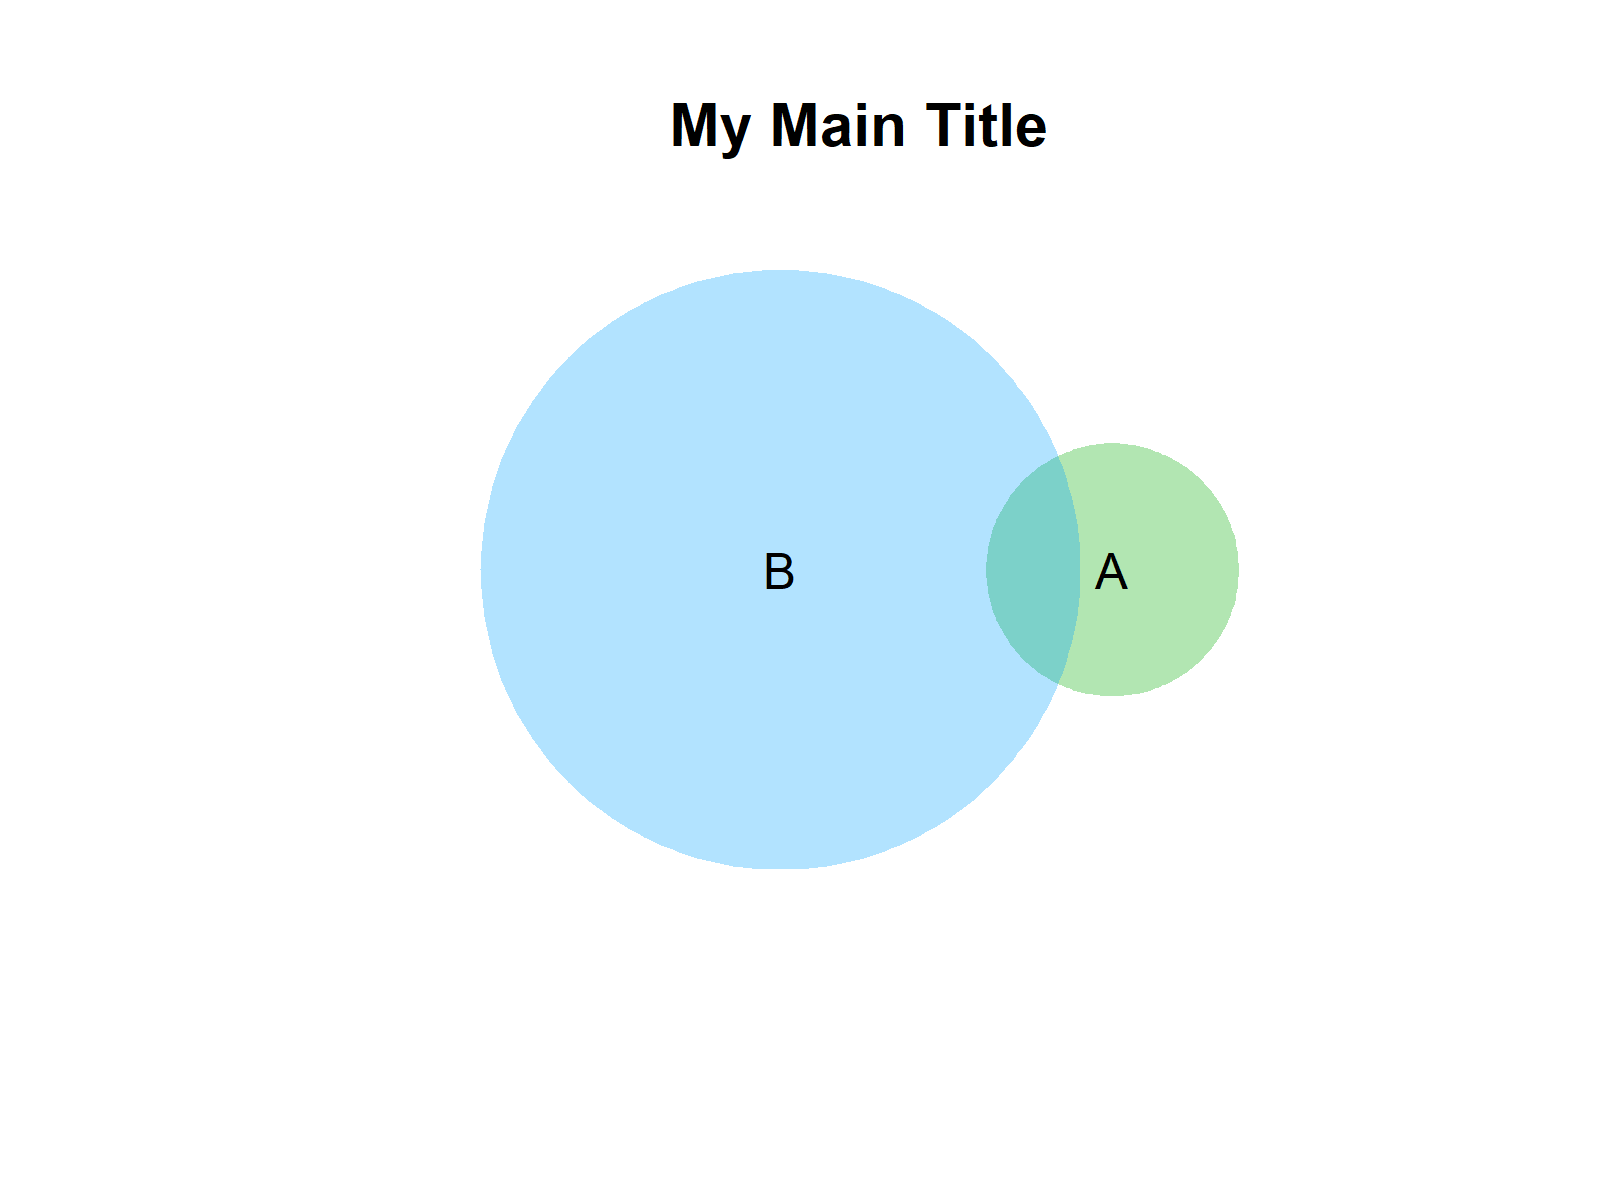
If we now want to append a title above our graph, we can use the main argument of the plot function:
plot(venneuler(c(A = 10,    # Add title to venn diagram
                 B = 75,
                 "A&B" = 4)),
     main = "My Main Title")
Video, Further Resources & Summary
I have recently published a video on my YouTube channel, which explains the contents of this tutorial. Please find the video below.
Furthermore, you might read the other tutorials on this website. I have published several tutorials already.
- Venn Diagram with Opacity in R
- How to Create a Venn Diagram in R
- Venn Diagram with Proportional Size in R
- Drawing Plots in R
- R Programming Overview
To summarize: You have learned in this article how to create a venn diagram with title on top of the plot in the R programming language. If you have additional questions, please let me know in the comments below.


8 Comments. Leave new
Hi Joachim,
thanks for the helpful tutorial. I just created a venn diagram with the ggvenn package, but it bothers me that the label of the circles is not centerd over them. Is there a way to change that?
Thanks in advance,
Moritz
Hello Moritz,
Can you share the code please?
Regards,
Cansu
Hello Cansu,
sure, sorry about that. Thats my Code:
nh <- list(`with` = c(1:67),
`without` = c(36:79))
ggvenn(nh, c("with", "without"),
digits = 0,
fill_color = c("blue2", "yellow2"),
fill_alpha = 0.6,
set_name_size = 21,
text_size = 18,
stroke_size = 1.5)
I would like to move the two labels 'with' and 'without' over the center of the corresponding circles. I guess it doesn't matter whether the plot is viewed in R or saved to a file? I already tried theme(text = element_text(hjust = .1)), but that didn't do anything.
Thanks for the help,
Moritz
Hello Moritz,
I think they are centered by default. In your case, the text size is the problem if I got your question well. Please see the code below for the Venn diagram with reduced-size text.
Regards,
Cansu
Hello Cansu,
thanks for looking into it. I made the text that big to have a pixel-free plot after saving it via png(height = 2000, width = 2000). Also I checked if the text appears centerd with the smaller text and for me it still looks a bit off, both after saving and in the plot window. But it is not that important. I was just wondering if it is possible to move it, but it seems to be quite difficult, so I guess I have to live with it.
Thanks again,
Regards,
Moritz
Hello Moritz,
I couldn’t find anything relevant on the internet, unfortunately. Maybe you post your question on our Facebook discussion group, and someone else can help.
Regards,
Cansu
The old gplots library does not document this, but you can add a title to Venn diagrams using a simple “text” command in a rectangle of 400×400, e.g. if you issue a text(200,400,”This is my title”) you can add the title just above the Venn diagram. This is also useful to add notes to plots.
Hope it helps
Hey Matteo,
Thank you so much for sharing this information!
Regards,
Joachim