Exclude Specific Predictors from Linear Regression Model in R (Example)
This tutorial explains how to remove particular predictors from a GLM in the R programming language.
The tutorial will consist of these contents:
With that, let’s just jump right in…
Creation of Example Data
We’ll use the following data as basement for this R programming tutorial:
set.seed(3296563)                    # Construct example data
x1 <- rnorm(100)
x2 <- rnorm(100) + x1
x3 <- rnorm(100) + x1 + x2
y <- rnorm(100) + x1 + x2 + x3
data <- data.frame(x1, x2, x3, y)
head(data)                           # Print head of example data

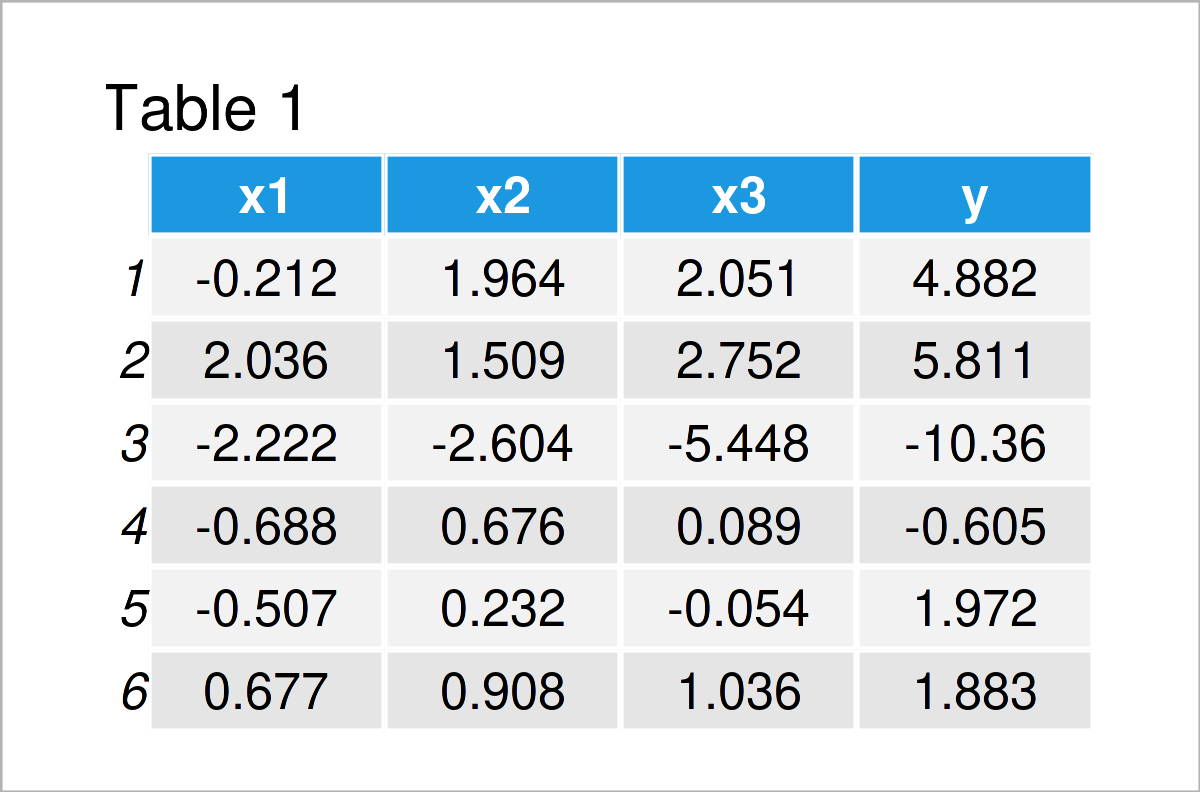
Have a look at the table that has been returned after running the previous syntax. It shows the top six lines of our example data, and that our data consists of the four numerical columns “x1”, “x2”, “x3”, and “y”.
In the next step, we may estimate a linear regression model of our data using the lm() function.
Note that we are using the syntax “~ .” to tell R that we want to use all columns in our data frame as predictors (or independent variables).
mod1 <- lm(y ~ ., data)              # Estimate linear model with all predictors
summary(mod1)                        # Print model summary
# Call:
# lm(formula = y ~ ., data = data)
#
# Residuals:
#     Min      1Q  Median      3Q     Max
# -2.9459 -0.8251 -0.2386  0.8411  2.7221
#
# Coefficients:
#             Estimate Std. Error t value Pr(>|t|)
# (Intercept)  0.07387    0.11503   0.642    0.522
# x1           1.00022    0.20658   4.842 4.92e-06 ***
# x2           1.12449    0.17337   6.486 3.82e-09 ***
# x3           0.90350    0.12907   7.000 3.47e-10 ***
# ---
# Signif. codes:  0 ‘***’ 0.001 ‘**’ 0.01 ‘*’ 0.05 ‘.’ 0.1 ‘ ’ 1
#
# Residual standard error: 1.136 on 96 degrees of freedom
# Multiple R-squared:  0.9472,	Adjusted R-squared:  0.9455
# F-statistic: 573.9 on 3 and 96 DF,  p-value: < 2.2e-16
The previous RStudio console output shows the summary statistics of our regression model. As you can see, all variables have been used to predict our target variable y.
In the next example, I’ll show how to delete some of these predictors from our model.
Example: Exclude Particular Data Frame Columns from Linear Regression Model
In this example, I’ll explain how to remove specific predictor variables from a linear regression model formula.
For this, we simply have to specify the variable names after “~ .” with a – sign in front:
mod2 <- lm(y ~ . - x1 - x3, data)    # Remove certain predictors from model
summary(mod2)                        # Print model summary
# Call:
# lm(formula = y ~ . - x1 - x3, data = data)
#
# Residuals:
#     Min      1Q  Median      3Q     Max
# -3.9239 -1.3692  0.0459  1.3205  4.3373
#
# Coefficients:
#             Estimate Std. Error t value Pr(>|t|)
# (Intercept) -0.09373    0.19646  -0.477    0.634
# x2           3.08398    0.13578  22.714   <2e-16 ***
# ---
# Signif. codes:  0 ‘***’ 0.001 ‘**’ 0.01 ‘*’ 0.05 ‘.’ 0.1 ‘ ’ 1
#
# Residual standard error: 1.955 on 98 degrees of freedom
# Multiple R-squared:  0.8404,	Adjusted R-squared:  0.8387
# F-statistic: 515.9 on 1 and 98 DF,  p-value: < 2.2e-16
As you can see, we have removed the variables x1 and x3 from the model.
Video & Further Resources
Do you want to know more about the removal of particular predictors from a GLM? Then you may watch the following video on my YouTube channel. In the video, I’m explaining the R code of this article in a live session:
In addition, you might have a look at the related tutorials on this homepage.
- Write Model Formula with Many Variables of Data Frame
- Extract Significance Stars & Levels from Linear Regression Model
- Extract F-Statistic, Number of Predictor Variables/Categories & Degrees of Freedom from Linear Regression Model in R
- Extract Regression Coefficients of Linear Model
- Extract Residuals & Sigma from Linear Regression Model
- Extract Standard Error, t-Value & p-Value from Linear Regression Model
- R Programming Examples
To summarize: You have learned in this tutorial how to extract specific predictors from a GLM in R programming. In case you have any further questions, please tell me about it in the comments section.


