Extract Residuals & Sigma from Linear Regression Model in R (3 Examples)
This tutorial shows how to return the residuals of a linear regression and descriptive statistics of the residuals in R.
Table of contents:
With that, let’s do this!
Introduction of Example Data
As a first step, I need to define some example data:
set.seed(726459222)                        # Drawing random data
x1 <- rnorm(2000)
x2 <- rnorm(2000) - 0.3 * x1
x3 <- rnorm(2000) - 0.3 * x1 + 0.2 * x2
x4 <- rnorm(2000) + 0.3 * x1 - 0.2 * x3
x5 <- rnorm(2000) - 0.03 * x2 - 0.4 * x3
y <- rnorm(2000) + 0.1 * x1 - 0.3 * x2 + 0.5 * x3 - 0.4 * x4 + 0.25 * x5
data <- data.frame(y, x1, x2, x3, x4, x5)
head(data)                                 # Returning first lines of data
#             y          x1         x2         x3         x4         x5
# 1 -0.01272386  0.52688742 -0.4070360 -1.8470650 -0.6239712  2.0839218
# 2 -0.32813299 -0.09053833  0.5812325 -0.9994400  1.0530599  0.9098407
# 3  1.27146418 -0.24375999 -1.8188502  0.4346308 -0.7196681  1.3162403
# 4 -2.50062497 -0.36291912  0.9134926  0.5542066 -1.8640787 -1.6864915
# 5  0.53293830 -2.57378147  0.2067142  2.9226927 -1.0644401 -2.4786637
# 6  0.90625820  1.57446816 -0.1246766 -0.8809393 -0.1204054 -1.5850237
Have a look at the previous output of the RStudio console. It shows that our example data has six columns. The variable y is the outcome variable of our model and the variables x1-x5 are the predictors.
Let’s apply the summary and lm functions to estimate our linear regression model in R:
mod_summary <- summary(lm(y ~ ., data))    # Estimating linear regression model
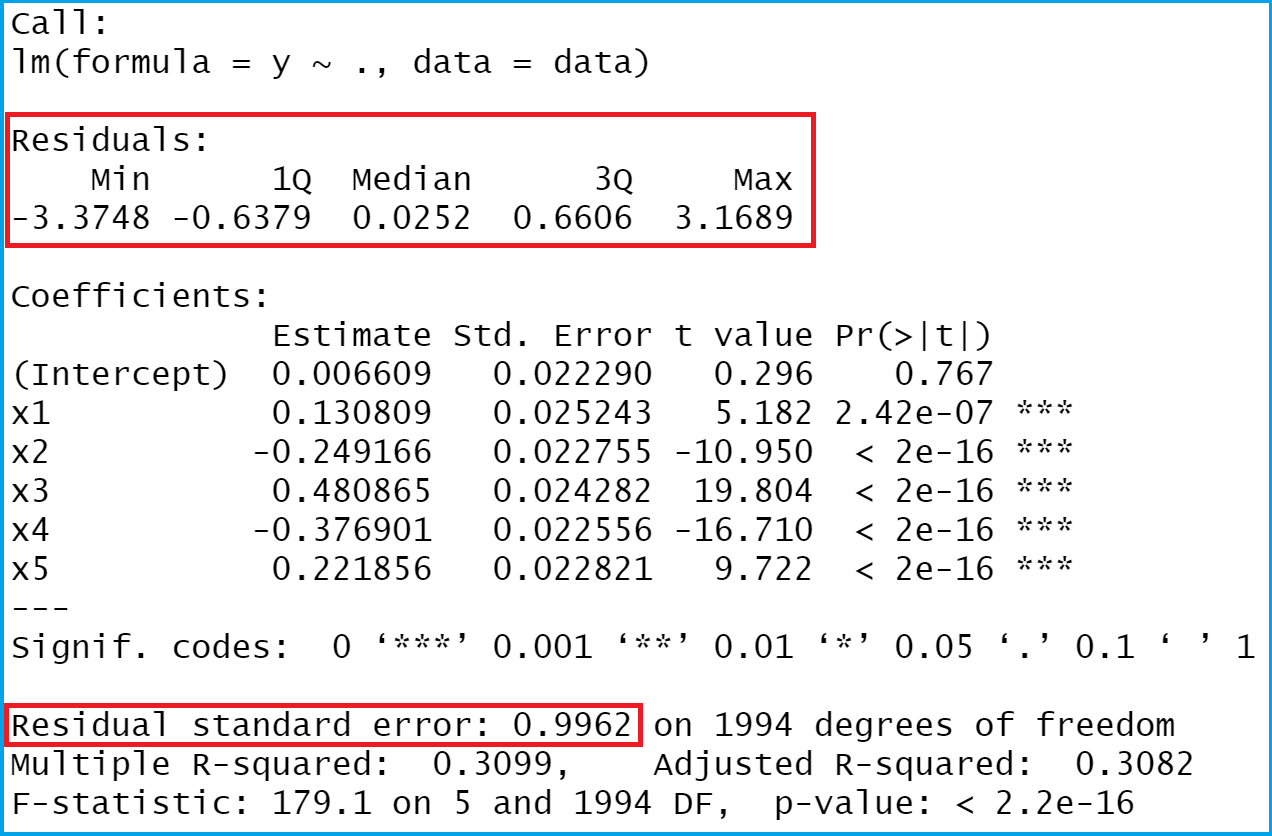
mod_summary                                # Showing linear regression output

The previous Figure shows the output of our linear model. The red boxes show the values that we want to extract, i.e. the residuals and some descriptive statistics of the residuals.
Let’s do this in R!
Example 1: Extracting Residuals from Linear Regression Model
The syntax below explains how to pull out the residuals from our linear regression model.
mod_summary$residuals                      # Pull out residuals
#           1            2            3            4            5            6  ...
# 0.001008608  0.497565558  0.071287729 -2.827061108 -0.342191054  1.392509066  ...
As you can see based on the previous RStudio console output, we printed a named vector of residuals – one residual for each of the 2000 observations of our data set.
Example 2: Compute Summary Statistics of Residuals Using summary() Function
We can compute descriptive statistics of our residuals by applying the summary function to our residuals vector that we have extracted in Example 1:
summary(mod_summary$residuals)             # Applying summary function to residuals
#     Min.  1st Qu.   Median     Mean  3rd Qu.     Max.
# -3.37479 -0.63787  0.02516  0.00000  0.66056  3.16887
The previous output is showing minimum, 1st. quartile, median, mean, 3rd quartile and the maximum value of our residuals.
Example 3: Extracting Residual Standard Error from Linear Regression Model
The R syntax below explains how to pull out the standard error of our residuals. In the terminology of the lm function, the residual standard error is called sigma:
mod_summary$sigma                          # Pull out residual standard error
# 0.9961942
The residual standard error of our linear model is 0.9961942.
Video & Further Resources
In case you need further info on the examples of this post, you may want to watch the following video of my YouTube channel. I’m explaining the R programming codes of this article in the video.
The YouTube video will be added soon.
Furthermore, you might want to have a look at some of the related tutorials of my homepage. I have published several articles about topics such as regression models, coding errors, and extracting data:
To summarize: In this article, I explained how to extract residuals from a linear model in R programming. Let me know in the comments section below, if you have additional questions.


