Extract Significance Stars & Levels from Linear Regression Model in R (Example)
In this R tutorial you’ll learn how to create a named vector containing significance stars of all linear regression predictors.
The tutorial consists of one example for the identification of significance levels. To be more precise, the article contains these contents:
Here’s the step-by-step process!
Creation of Exemplifying Data
We’ll use the following data as basement for this tutorial:
set.seed(115599)                                    # Randomly distributed data
x1 <- rnorm(50)
x2 <- rnorm(50) - 0.6 * x1
x3 <- rnorm(50) + 0.5 * x1 - 0.2 * x2
x4 <- rnorm(50) - 0.4 * x2 - 0.2 * x3
x5 <- rnorm(50) + 0.2 * x1 + 0.4 * x3
y <- rnorm(50) + 0.5 * x1 - 0.25 * x2 + 0.15 * x3 - 0.4 * x4 - 0.25 * x5
data <- data.frame(y, x1, x2, x3, x4, x5)
head(data)                                          # Show first six lines
#            y          x1         x2          x3         x4         x5
# 1  0.5375759 -1.00368050  1.3737289  0.19861707 -0.3165390 -0.3771629
# 2 -1.1195362 -0.01963203  0.2298544  1.19969646 -0.6180654  0.2138540
# 3  0.2822981  0.14565618  0.1629700  0.83424806  0.1570481 -0.5419311
# 4 -0.7367076 -1.38151223  1.5029506  0.08264055 -0.4200876  0.6078677
# 5 -1.1538607  0.17576957  1.0001372 -2.20030115  0.4793736 -0.9195514
# 6  1.0447863 -0.05807407 -0.7184001 -0.47148192  0.6143885 -0.6875134
As you can see based on the previous output of the RStudio console, our example data has six columns. The variable y is the outcome and the other variables are the predictors.
Let’s estimate a linear regression model in R:
mod_summary <- summary(lm(y ~ ., data))             # Run linear model
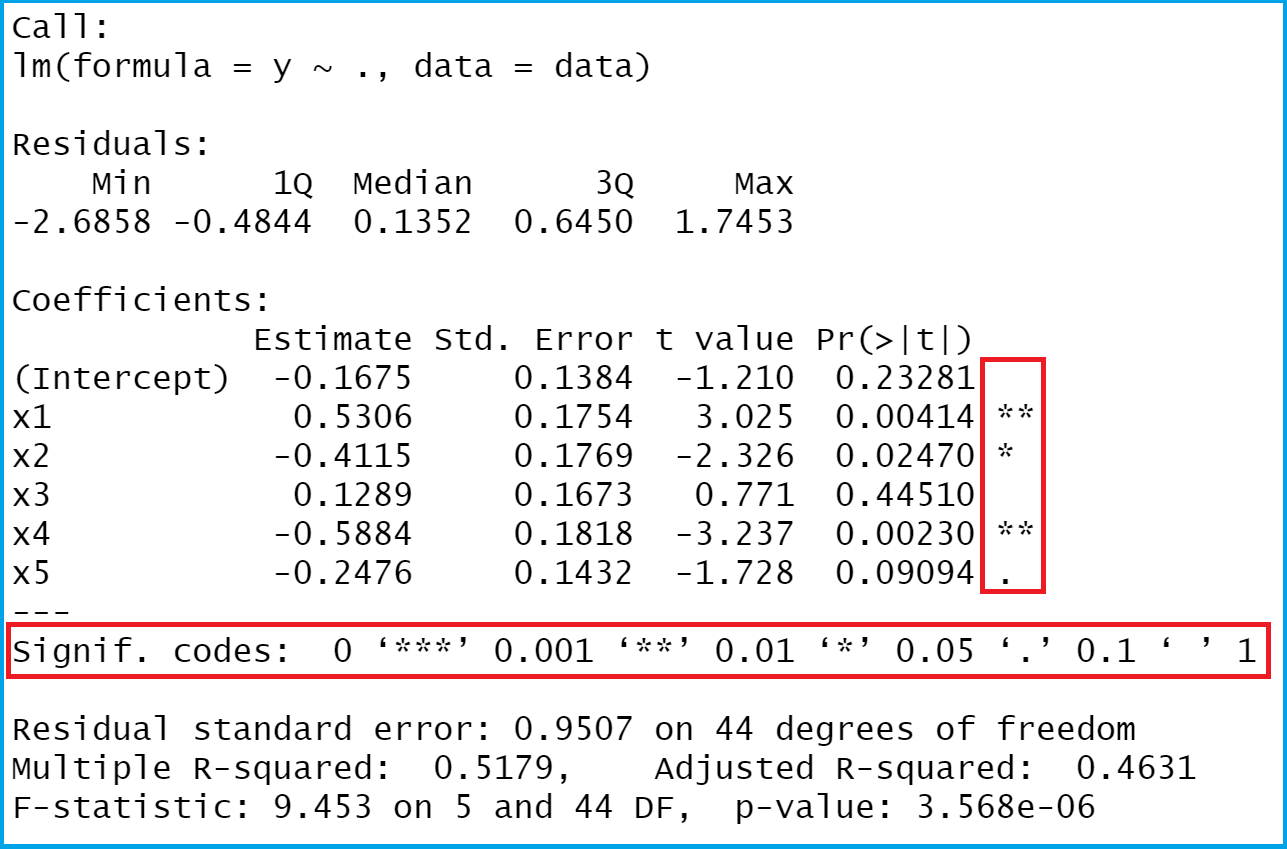
mod_summary                                         # Summary of linear regression

The previously shown figure illustrates the output of our linear regression model as well as the values we want to extract. In this tutorial, we are interested in the significance stars shown in the regression output.
Example: Extracting Significance Stars from Linear Regression Model
The following R programming code illustrates how to extract p-values from our linear regression analysis and how to convert these p-values to a named vector of significance stars.
mod_summary_sign <- mod_summary$coefficients[ , 4]  # Pull out p-values
mod_summary_stars <- NA                             # Named vector with significance stars
mod_summary_stars[mod_summary_sign < 0.1] <- "."
mod_summary_stars[mod_summary_sign < 0.05] <- "*"
mod_summary_stars[mod_summary_sign < 0.01] <- "**"
mod_summary_stars[mod_summary_sign < 0.001] <- "***"
mod_summary_stars[is.na(mod_summary_stars)] <- "n.s."
names(mod_summary_stars) <- names(mod_summary_sign)
mod_summary_stars                                   # Print named vector
# (Intercept)          x1          x2          x3          x4          x5
#      "n.s."        "**"         "*"      "n.s."        "**"         "."
As shown in the previous RStudio console output, our final result is a named vector showing significance stars of the intercept and the predictors of our model.
Video, Further Resources & Summary
Have a look at the following video of my YouTube channel. I illustrate the R code of this article in the video.
The YouTube video will be added soon.
Furthermore, you could have a look at some of the related tutorials of this website. I have released several other tutorials about regression models in R already.
- Specify Reference Factor Level in Linear Regression
- Add Regression Line to ggplot2 Plot in R
- Extract Regression Coefficients of Linear Model
- R Programming Examples
You learned in this tutorial how to pull out the significance stars of a regression model in the R programming language. If you have additional questions, please let me know in the comments section below. Furthermore, don’t forget to subscribe to my email newsletter for updates on new tutorials.


