Difference Between facet_grid & facet_wrap ggplot2 Functions in R (2 Examples)
In this tutorial, I’ll illustrate how to use the facet_grid and facet_wrap functions of the ggplot2 package in the R programming language.
The tutorial consists of two examples for the application of facet_grid and facet_wrap. To be more precise, the article consists of this content:
Let’s get started:
Example Data, Add-On Packages & Basic Graph
I use the following data as basement for this R programming tutorial:
data <- data.frame(x = 1:12,        # Create example data frame
                   y = 1:12,
                   g1 = rep(LETTERS[1:4], each = 3),
                   g2 = letters[1:4])
data                                # Print example data frame
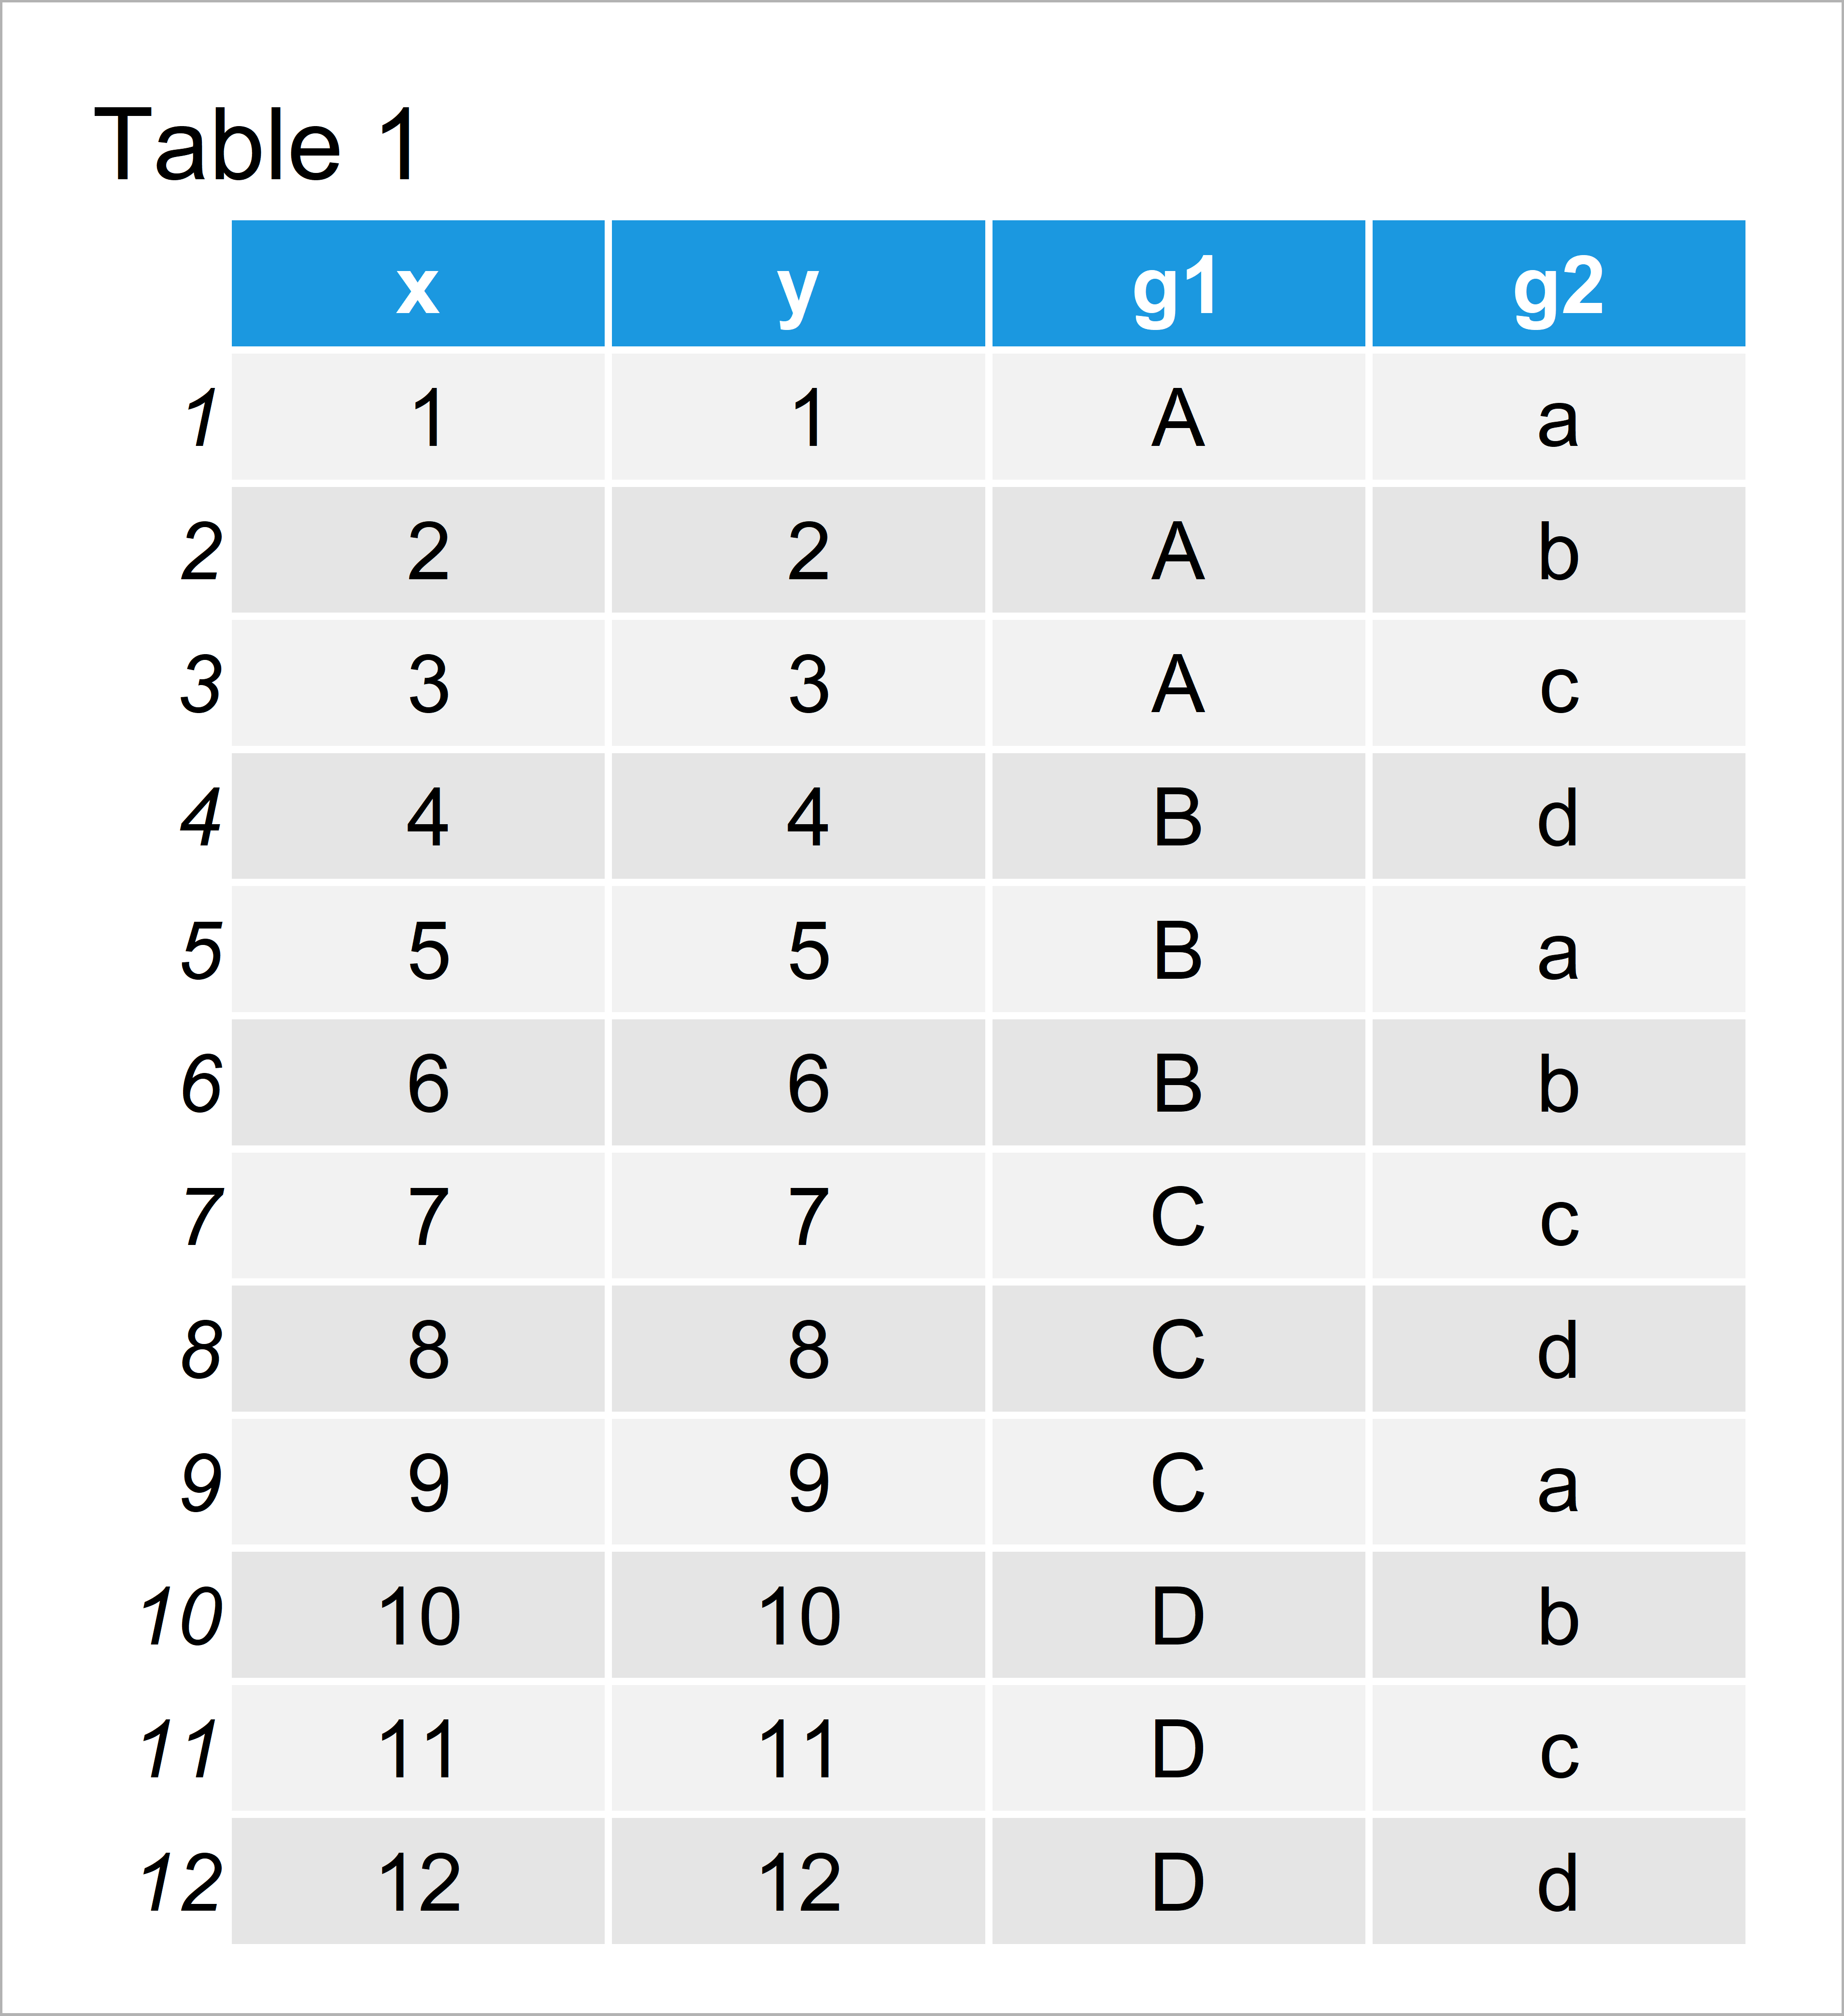
Have a look at the table that got returned after executing the previous R programming code. It shows that our example data consists of twelve rows and four variables.
In order to use the functions of the ggplot2 package, we also need to install and load ggplot2:
install.packages("ggplot2")         # Install & load ggplot2 package
library("ggplot2")
Now, we can draw the data without categorizing it in a facet plot as shown below:
ggp <- ggplot(data, aes(x, y)) +    # Create plot without facets
  geom_point()
ggp                                 # Print plot without facets
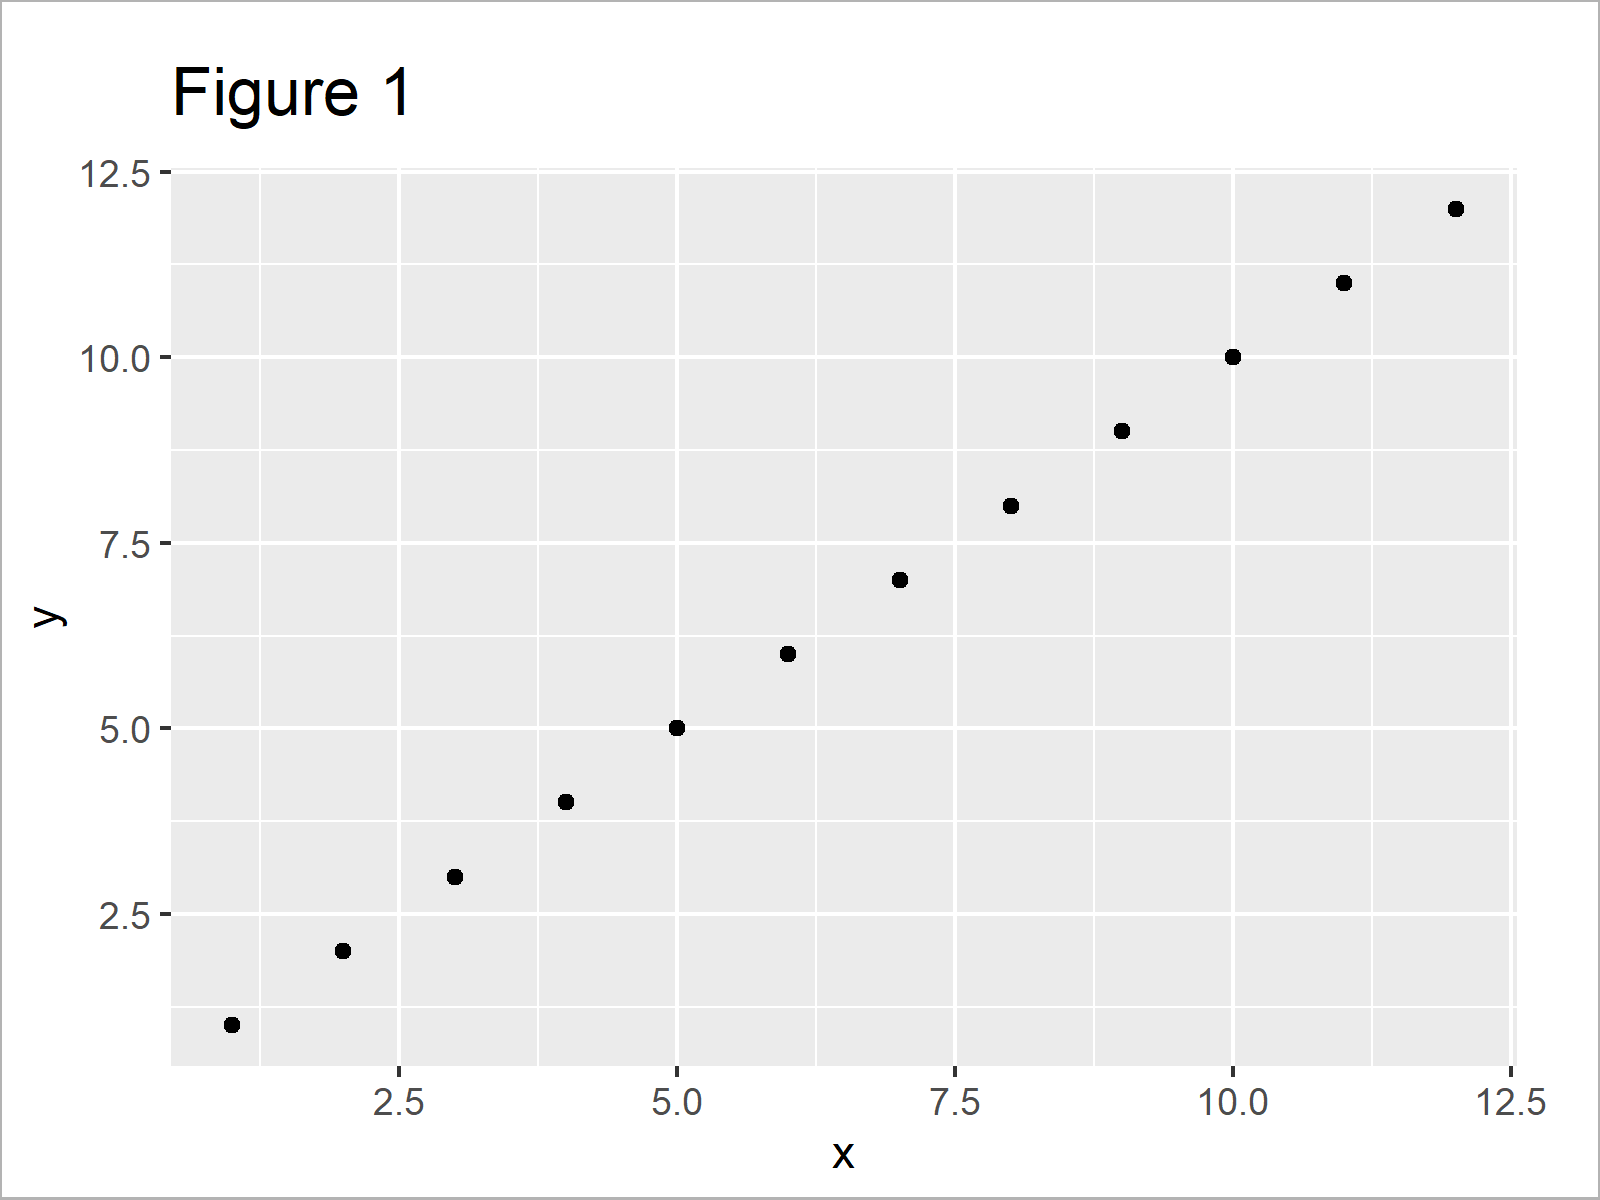
Figure 1 illustrates the output of the previous R programming code – A ggplot2 scatterplot without facet panels.
Example 1: Using facet_grid() Function to Visualize Groups in ggplot2 Plot
Example 1 explains how a facet plot created based on the facet_grid function looks like. Let’s draw such a plot in R:
ggp + facet_grid(g1 ~ g2) # Apply facet_grid
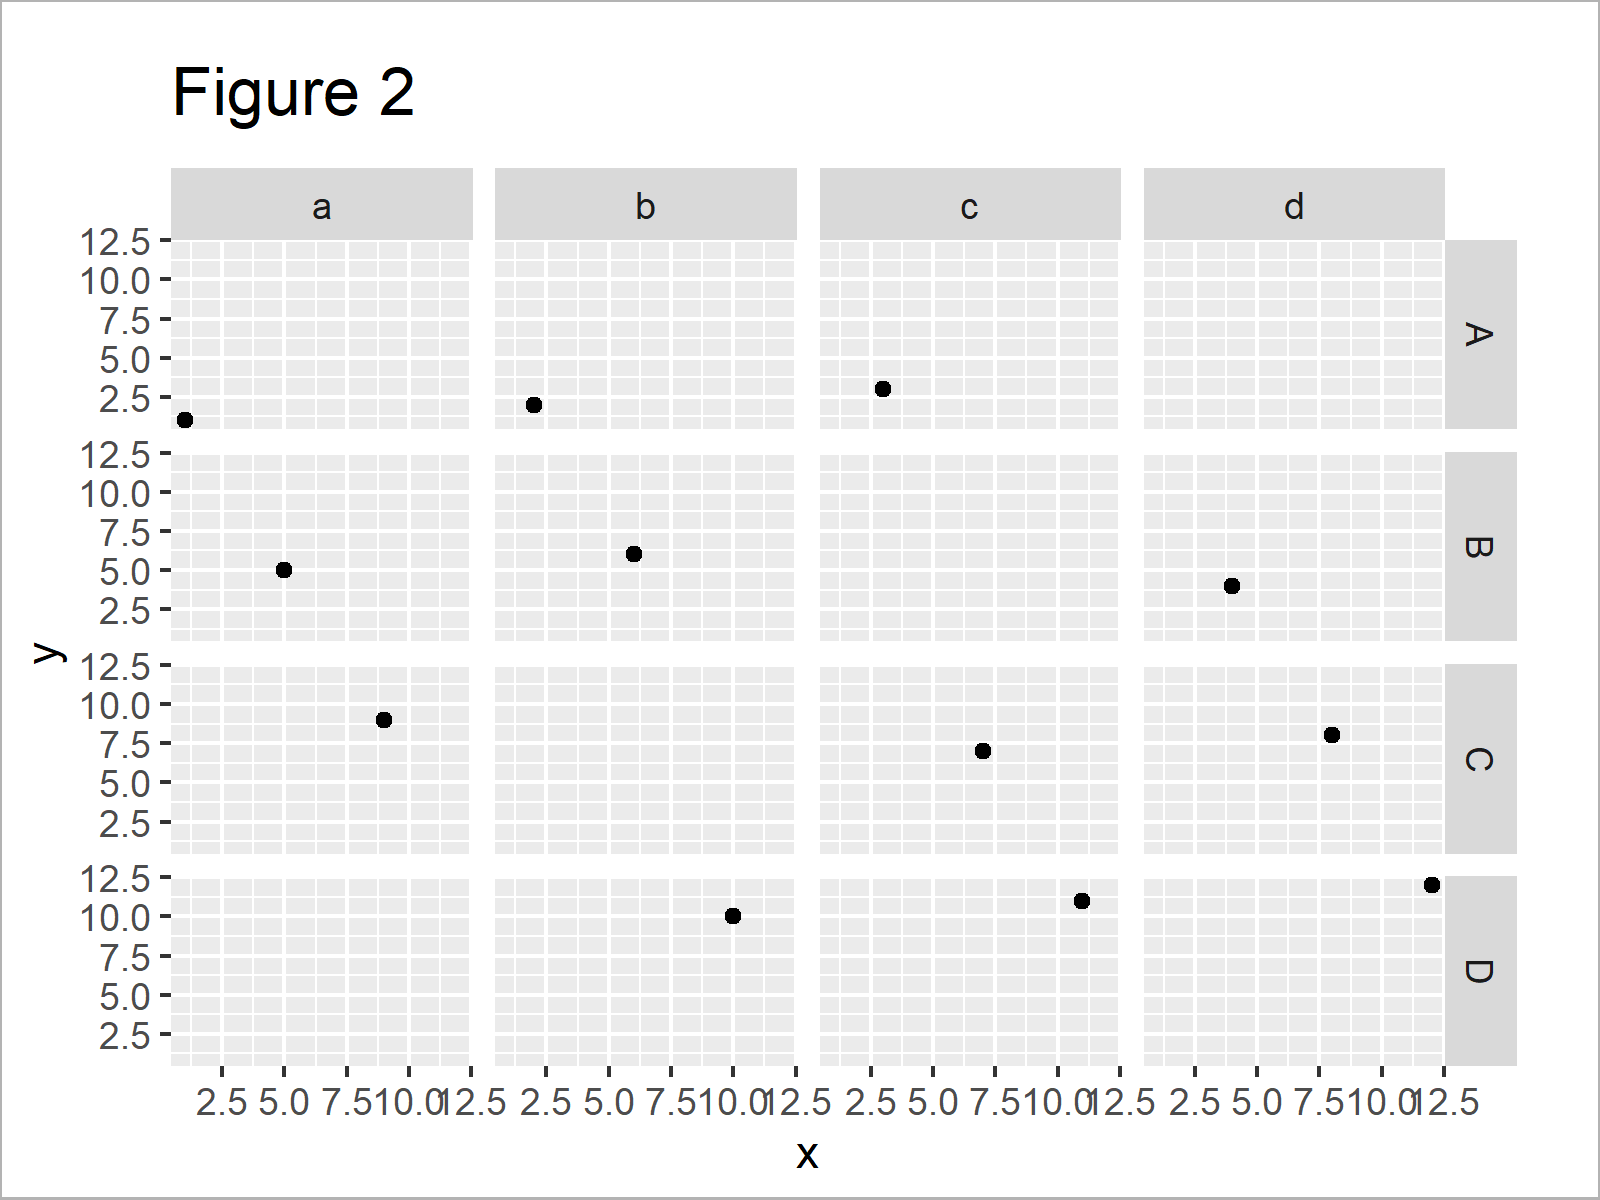
After running the previous R programming syntax the ggplot2 facet graph shown in Figure 2 has been created.
As you can see, the facet_grid function has created a grid of plots with group 1 labels on the right side of the grid and group 2 labels at the top of the grid.
All possible combinations of our two groups are shown, even though some combinations do not exist in our data (e.g. A & d).
So how does a facet_wrap plot of our data look like? Let’s move on to the next example!
Example 2: Using facet_wrap() Function to Visualize Groups in ggplot2 Plot
This example explains the difference of a facet_wrap plot compared to a facet_grid plot.
Let’s draw a facet_wrap graph:
ggp + facet_wrap(g1 ~ g2) # Apply facet_wrap
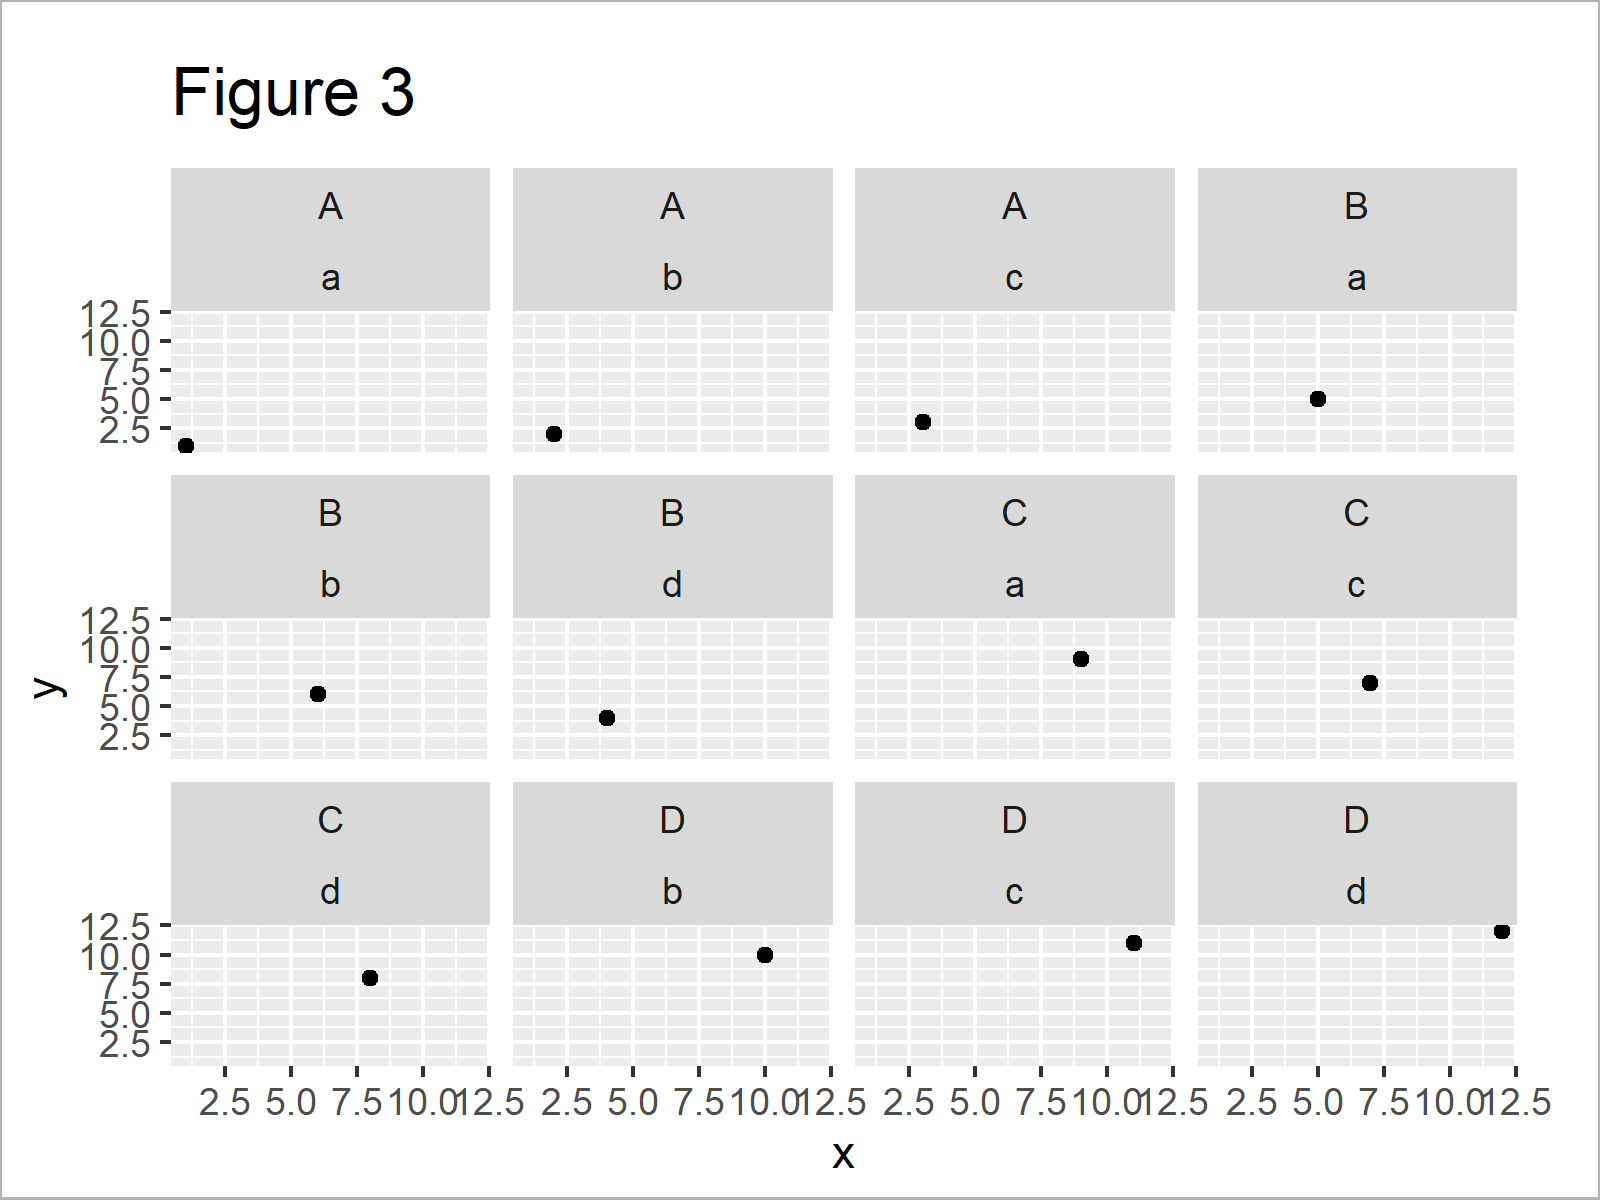
By executing the previous R code we have created Figure 3, i.e. a ggplot2 facet plot created with the facet_wrap function.
Let’s make a comparison of Figure 2 and Figure 3: As you can see, Figure three consists of fewer panels. Group combinations that do not exist in our data are not shown in the plot.
Furthermore, the facet labels are different. While facet_grid shows the labels at the margins of the facet plot, facet_wrap creates a label for each plot panel.
Whether facet_grid or facet_wrap is suited better for your data depends on your specific situation and quite often it’s just a matter of taste.
Video, Further Resources & Summary
In case you need more info on the content of this tutorial, I recommend having a look at the following video of my YouTube channel. I explain the R code of this post in the video.
In addition, you may have a look at the other tutorials of this homepage. You can find some articles below.
- Increase Space Between ggplot2 Facet Plot Panels
- Remove Labels from ggplot2 Facet Plot
- Add Individual Text to Each Facet of ggplot2 Plot
- Change Labels of ggplot2 Facet Plot in R
- Reorder Facets in ggplot2 Plot in R
- Set Axis Limits of ggplot2 Facet Plot in R
- Change Font Size of ggplot2 Facet Grid Labels
- Graphics in R
- R Programming Overview
In this tutorial, I have illustrated how to apply facet_grid and facet_wrap in the R programming language. Please tell me about it in the comments, in case you have further questions.


